Luftverschmutzung in Dourbes: Echtzeit-Luft-Qualitätsindex und Smog-Alarm.
Für die Dourbes. Heute ist Donnerstag, 4. Juni 2026. Für Dourbes wurden folgende Luftverschmutzungswerte gemessen:- Schwefeldioxid (SO2) - 1 (gut)
- Feinstaub (PM10) Schwebestaub - 15 (gut)
- Stickstoffdioxid (NO2) - 8 (gut)
- Ozon (O3) - 39 (gut)
- Feinstaub (PM2,5) - 13 (Moderate)

Wie ist die Luftqualität Dourbes heute? Ist die Luft in Dourbes? verschmutzt. Gibt es Smog?
Wie hoch ist die SO2-Belastung? (Schwefeldioxid (SO2))
1 (gut)
Wie hoch ist der PM10-Stand heute in Dourbes? (Feinstaub (PM10) Schwebestaub)
Der aktuelle Feinstaubgehalt PM10 in Dourbes is:
15 (gut)
Die höchsten PM10-Werte treten in der Regel im Monat auf: 21 (Februar 2019).
Der niedrigste Wert der Feinstaub-PM10-Belastung in Dourbes ist in der Regel in: Oktober (1.8).
Wie hoch ist das NO2-Niveau? (Stickstoffdioxid (NO2))
8 (gut)
Wie ist das O3-Niveau heute in Dourbes? (Ozon (O3))
39 (gut)
Wie hoch ist der aktuelle PM2,5-Wert in Dourbes? (Feinstaub (PM2,5))
Die heutige PM2.5-Stufe ist:
13 (Moderate)
Zum Vergleich: Der höchste PM2,5-Wert in Dourbes in den letzten 7 Tagen war: 29 (Donnerstag, 11. Januar 2024) und der niedrigste: 5 (Dienstag, 16. Januar 2024).
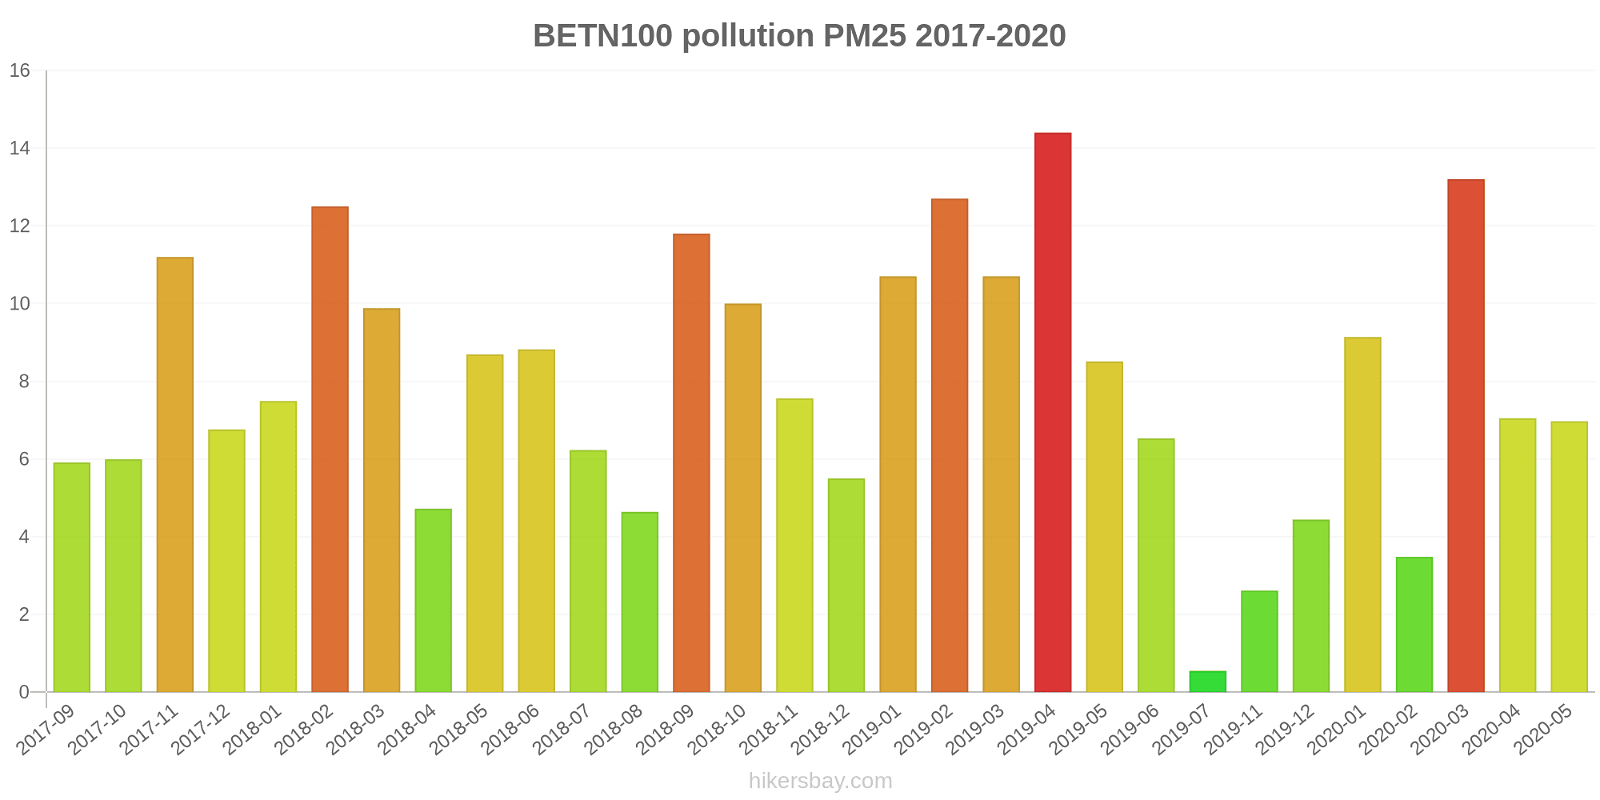
Die höchsten PM2,5-Werte wurden gemessen: 14 (April 2019).
Die niedrigste Feinstaubbelastung PM2,5 tritt im Monat auf: Juli (0.55).
Aktuelle Daten Mittwoch, 17. Januar 2024, 10:00
SO2 1 (gut)
PM10 15 (gut)
NO2 8 (gut)
O3 39 (gut)
PM2,5 13 (Moderate)
Daten zur Luftverschmutzung der letzten Tage in Dourbes
index
2024-01-10
2024-01-11
2024-01-12
2024-01-13
2024-01-14
2024-01-15
2024-01-16
2024-01-17
so2
0
Good
0
Good
0
Good
0
Good
0
Good
0
Good
0
Good
0
Good
pm10
21
Moderate
35
Moderate
23
Moderate
17
Good
12
Good
11
Good
9
Good
11
Good
o3
29
Good
17
Good
36
Good
46
Good
39
Good
-
Good
59
Good
49
Good
pm25
15
Moderate
29
Moderate
18
Moderate
14
Moderate
10
Good
9
Good
5
Good
9
Good
no2
16
Good
29
Good
12
Good
4
Good
4
Good
8
Good
7
Good
5
Good
data source »
Luftverschmutzung in Dourbes von September 2017 bis Mai 2020

index
2020-05
2020-04
2020-03
2020-02
2020-01
2019-12
2019-11
2019-10
2019-09
2019-07
2019-06
2019-05
2019-04
2019-03
2019-02
2019-01
2018-12
2018-11
2018-10
2018-09
2018-08
2018-07
2018-06
2018-05
2018-04
2018-03
2018-02
2018-01
2017-12
2017-11
2017-10
2017-09
no2
6.7 (Good)
5.7 (Good)
4.7 (Good)
2.9 (Good)
6.5 (Good)
3.3 (Good)
2.8 (Good)
1.2 (Good)
3.6 (Good)
2.3 (Good)
3.1 (Good)
4.4 (Good)
6.6 (Good)
5.4 (Good)
12 (Good)
10 (Good)
6.5 (Good)
8.3 (Good)
7.2 (Good)
5.4 (Good)
4.9 (Good)
6.2 (Good)
4.9 (Good)
5.3 (Good)
5.1 (Good)
8.9 (Good)
11 (Good)
6.4 (Good)
9.3 (Good)
9 (Good)
3.8 (Good)
3 (Good)
pm25
7 (Good)
7 (Good)
13 (Moderate)
3.5 (Good)
9.1 (Good)
4.4 (Good)
2.6 (Good)
- (Good)
- (Good)
0.55 (Good)
6.5 (Good)
8.5 (Good)
14 (Moderate)
11 (Good)
13 (Good)
11 (Good)
5.5 (Good)
7.6 (Good)
10 (Good)
12 (Good)
4.6 (Good)
6.2 (Good)
8.8 (Good)
8.7 (Good)
4.7 (Good)
9.9 (Good)
13 (Good)
7.5 (Good)
6.8 (Good)
11 (Good)
6 (Good)
5.9 (Good)
pm10
11 (Good)
14 (Good)
10 (Good)
3 (Good)
12 (Good)
5.9 (Good)
3.5 (Good)
1.8 (Good)
- (Good)
2.4 (Good)
8 (Good)
11 (Good)
19 (Good)
16 (Good)
21 (Moderate)
17 (Good)
9 (Good)
10 (Good)
17 (Good)
12 (Good)
8.3 (Good)
15 (Good)
14 (Good)
14 (Good)
7.7 (Good)
13 (Good)
18 (Good)
9.2 (Good)
11 (Good)
14 (Good)
11 (Good)
11 (Good)
so2
1.1 (Good)
0.92 (Good)
0.93 (Good)
1 (Good)
0.98 (Good)
0.67 (Good)
- (Good)
0.44 (Good)
0.58 (Good)
- (Good)
1.1 (Good)
1 (Good)
0.97 (Good)
0.99 (Good)
0.93 (Good)
0.82 (Good)
- (Good)
1 (Good)
0.86 (Good)
1 (Good)
0.73 (Good)
0.64 (Good)
1 (Good)
0.97 (Good)
1.2 (Good)
1.2 (Good)
1.6 (Good)
1.2 (Good)
1 (Good)
1.2 (Good)
0.45 (Good)
- (Good)
o3
67 (Good)
73 (Moderate)
63 (Good)
64 (Good)
46 (Good)
28 (Good)
20 (Good)
23 (Good)
31 (Good)
27 (Good)
53 (Good)
51 (Good)
61 (Good)
62 (Good)
47 (Good)
45 (Good)
47 (Good)
35 (Good)
29 (Good)
42 (Good)
48 (Good)
58 (Good)
41 (Good)
56 (Good)
73 (Moderate)
63 (Good)
49 (Good)
54 (Good)
46 (Good)
34 (Good)
39 (Good)
36 (Good)
data source »
43N100 - DOURBES
Mittwoch, 17. Januar 2024, 10:00
SO2 1 (gut)
Schwefeldioxid (SO2)
PM10 15 (gut)
Feinstaub (PM10) Schwebestaub
NO2 8 (gut)
Stickstoffdioxid (NO2)
O3 39 (gut)
Ozon (O3)
PM2,5 13 (gut)
Feinstaub (PM2,5)
43N100 - DOURBES
index
2024-01-17
2024-01-16
2024-01-15
2024-01-14
2024-01-13
2024-01-12
2024-01-11
2024-01-10
so2
0
0
0
0
0
0
0.43
0
pm10
11
8.8
11
12
17
23
35
21
o3
49
59
-
39
46
36
17
29
pm25
8.7
5.4
8.6
10
14
18
29
15
no2
5.3
6.6
7.9
4.4
4.3
12
29
16
BETN100
2017-09 2020-05
index
2020-05
2020-04
2020-03
2020-02
2020-01
2019-12
2019-11
2019-10
2019-09
2019-07
2019-06
2019-05
2019-04
2019-03
2019-02
2019-01
2018-12
2018-11
2018-10
2018-09
2018-08
2018-07
2018-06
2018-05
2018-04
2018-03
2018-02
2018-01
2017-12
2017-11
2017-10
2017-09
pm25
7
7
13
3.5
9.1
4.4
2.6
-
-
0.55
6.5
8.5
14
11
13
11
5.5
7.6
10
12
4.6
6.2
8.8
8.7
4.7
9.9
13
7.5
6.8
11
6
5.9
pm10
11
14
10
3
12
5.9
3.5
1.8
-
2.4
8
11
19
16
21
17
9
10
17
12
8.3
15
14
14
7.7
13
18
9.2
11
14
11
11
no2
6.7
5.7
4.7
2.9
6.5
3.3
2.8
1.2
3.6
2.3
3.1
4.4
6.6
5.4
12
10
6.5
8.3
7.2
5.4
4.9
6.2
4.9
5.3
5.1
8.9
11
6.4
9.3
9
3.8
3
o3
67
73
63
64
46
28
20
23
31
27
53
51
61
62
47
45
47
35
29
42
48
58
41
56
73
63
49
54
46
34
39
36
so2
1.1
0.92
0.93
1
0.98
0.67
-
0.44
0.58
-
1.1
1
0.97
0.99
0.93
0.82
-
1
0.86
1
0.73
0.64
1
0.97
1.2
1.2
1.6
1.2
1
1.2
0.45
-
* Pollution data source:
https://openaq.org
(EEA Belgium)
The data is licensed under CC-By 4.0
SO2 1 (gut)
PM10 15 (gut)
NO2 8 (gut)
O3 39 (gut)
PM2,5 13 (Moderate)
Daten zur Luftverschmutzung der letzten Tage in Dourbes
| index | 2024-01-10 | 2024-01-11 | 2024-01-12 | 2024-01-13 | 2024-01-14 | 2024-01-15 | 2024-01-16 | 2024-01-17 |
|---|---|---|---|---|---|---|---|---|
| so2 | 0 Good |
0 Good |
0 Good |
0 Good |
0 Good |
0 Good |
0 Good |
0 Good |
| pm10 | 21 Moderate |
35 Moderate |
23 Moderate |
17 Good |
12 Good |
11 Good |
9 Good |
11 Good |
| o3 | 29 Good |
17 Good |
36 Good |
46 Good |
39 Good |
- Good |
59 Good |
49 Good |
| pm25 | 15 Moderate |
29 Moderate |
18 Moderate |
14 Moderate |
10 Good |
9 Good |
5 Good |
9 Good |
| no2 | 16 Good |
29 Good |
12 Good |
4 Good |
4 Good |
8 Good |
7 Good |
5 Good |

| index | 2020-05 | 2020-04 | 2020-03 | 2020-02 | 2020-01 | 2019-12 | 2019-11 | 2019-10 | 2019-09 | 2019-07 | 2019-06 | 2019-05 | 2019-04 | 2019-03 | 2019-02 | 2019-01 | 2018-12 | 2018-11 | 2018-10 | 2018-09 | 2018-08 | 2018-07 | 2018-06 | 2018-05 | 2018-04 | 2018-03 | 2018-02 | 2018-01 | 2017-12 | 2017-11 | 2017-10 | 2017-09 |
|---|---|---|---|---|---|---|---|---|---|---|---|---|---|---|---|---|---|---|---|---|---|---|---|---|---|---|---|---|---|---|---|---|
| no2 | 6.7 (Good) | 5.7 (Good) | 4.7 (Good) | 2.9 (Good) | 6.5 (Good) | 3.3 (Good) | 2.8 (Good) | 1.2 (Good) | 3.6 (Good) | 2.3 (Good) | 3.1 (Good) | 4.4 (Good) | 6.6 (Good) | 5.4 (Good) | 12 (Good) | 10 (Good) | 6.5 (Good) | 8.3 (Good) | 7.2 (Good) | 5.4 (Good) | 4.9 (Good) | 6.2 (Good) | 4.9 (Good) | 5.3 (Good) | 5.1 (Good) | 8.9 (Good) | 11 (Good) | 6.4 (Good) | 9.3 (Good) | 9 (Good) | 3.8 (Good) | 3 (Good) |
| pm25 | 7 (Good) | 7 (Good) | 13 (Moderate) | 3.5 (Good) | 9.1 (Good) | 4.4 (Good) | 2.6 (Good) | - (Good) | - (Good) | 0.55 (Good) | 6.5 (Good) | 8.5 (Good) | 14 (Moderate) | 11 (Good) | 13 (Good) | 11 (Good) | 5.5 (Good) | 7.6 (Good) | 10 (Good) | 12 (Good) | 4.6 (Good) | 6.2 (Good) | 8.8 (Good) | 8.7 (Good) | 4.7 (Good) | 9.9 (Good) | 13 (Good) | 7.5 (Good) | 6.8 (Good) | 11 (Good) | 6 (Good) | 5.9 (Good) |
| pm10 | 11 (Good) | 14 (Good) | 10 (Good) | 3 (Good) | 12 (Good) | 5.9 (Good) | 3.5 (Good) | 1.8 (Good) | - (Good) | 2.4 (Good) | 8 (Good) | 11 (Good) | 19 (Good) | 16 (Good) | 21 (Moderate) | 17 (Good) | 9 (Good) | 10 (Good) | 17 (Good) | 12 (Good) | 8.3 (Good) | 15 (Good) | 14 (Good) | 14 (Good) | 7.7 (Good) | 13 (Good) | 18 (Good) | 9.2 (Good) | 11 (Good) | 14 (Good) | 11 (Good) | 11 (Good) |
| so2 | 1.1 (Good) | 0.92 (Good) | 0.93 (Good) | 1 (Good) | 0.98 (Good) | 0.67 (Good) | - (Good) | 0.44 (Good) | 0.58 (Good) | - (Good) | 1.1 (Good) | 1 (Good) | 0.97 (Good) | 0.99 (Good) | 0.93 (Good) | 0.82 (Good) | - (Good) | 1 (Good) | 0.86 (Good) | 1 (Good) | 0.73 (Good) | 0.64 (Good) | 1 (Good) | 0.97 (Good) | 1.2 (Good) | 1.2 (Good) | 1.6 (Good) | 1.2 (Good) | 1 (Good) | 1.2 (Good) | 0.45 (Good) | - (Good) |
| o3 | 67 (Good) | 73 (Moderate) | 63 (Good) | 64 (Good) | 46 (Good) | 28 (Good) | 20 (Good) | 23 (Good) | 31 (Good) | 27 (Good) | 53 (Good) | 51 (Good) | 61 (Good) | 62 (Good) | 47 (Good) | 45 (Good) | 47 (Good) | 35 (Good) | 29 (Good) | 42 (Good) | 48 (Good) | 58 (Good) | 41 (Good) | 56 (Good) | 73 (Moderate) | 63 (Good) | 49 (Good) | 54 (Good) | 46 (Good) | 34 (Good) | 39 (Good) | 36 (Good) |
SO2 1 (gut)
Schwefeldioxid (SO2)PM10 15 (gut)
Feinstaub (PM10) SchwebestaubNO2 8 (gut)
Stickstoffdioxid (NO2)O3 39 (gut)
Ozon (O3)PM2,5 13 (gut)
Feinstaub (PM2,5)43N100 - DOURBES
| index | 2024-01-17 | 2024-01-16 | 2024-01-15 | 2024-01-14 | 2024-01-13 | 2024-01-12 | 2024-01-11 | 2024-01-10 |
|---|---|---|---|---|---|---|---|---|
| so2 | 0 | 0 | 0 | 0 | 0 | 0 | 0.43 | 0 |
| pm10 | 11 | 8.8 | 11 | 12 | 17 | 23 | 35 | 21 |
| o3 | 49 | 59 | - | 39 | 46 | 36 | 17 | 29 |
| pm25 | 8.7 | 5.4 | 8.6 | 10 | 14 | 18 | 29 | 15 |
| no2 | 5.3 | 6.6 | 7.9 | 4.4 | 4.3 | 12 | 29 | 16 |
BETN100

| index | 2020-05 | 2020-04 | 2020-03 | 2020-02 | 2020-01 | 2019-12 | 2019-11 | 2019-10 | 2019-09 | 2019-07 | 2019-06 | 2019-05 | 2019-04 | 2019-03 | 2019-02 | 2019-01 | 2018-12 | 2018-11 | 2018-10 | 2018-09 | 2018-08 | 2018-07 | 2018-06 | 2018-05 | 2018-04 | 2018-03 | 2018-02 | 2018-01 | 2017-12 | 2017-11 | 2017-10 | 2017-09 |
|---|---|---|---|---|---|---|---|---|---|---|---|---|---|---|---|---|---|---|---|---|---|---|---|---|---|---|---|---|---|---|---|---|
| pm25 | 7 | 7 | 13 | 3.5 | 9.1 | 4.4 | 2.6 | - | - | 0.55 | 6.5 | 8.5 | 14 | 11 | 13 | 11 | 5.5 | 7.6 | 10 | 12 | 4.6 | 6.2 | 8.8 | 8.7 | 4.7 | 9.9 | 13 | 7.5 | 6.8 | 11 | 6 | 5.9 |
| pm10 | 11 | 14 | 10 | 3 | 12 | 5.9 | 3.5 | 1.8 | - | 2.4 | 8 | 11 | 19 | 16 | 21 | 17 | 9 | 10 | 17 | 12 | 8.3 | 15 | 14 | 14 | 7.7 | 13 | 18 | 9.2 | 11 | 14 | 11 | 11 |
| no2 | 6.7 | 5.7 | 4.7 | 2.9 | 6.5 | 3.3 | 2.8 | 1.2 | 3.6 | 2.3 | 3.1 | 4.4 | 6.6 | 5.4 | 12 | 10 | 6.5 | 8.3 | 7.2 | 5.4 | 4.9 | 6.2 | 4.9 | 5.3 | 5.1 | 8.9 | 11 | 6.4 | 9.3 | 9 | 3.8 | 3 |
| o3 | 67 | 73 | 63 | 64 | 46 | 28 | 20 | 23 | 31 | 27 | 53 | 51 | 61 | 62 | 47 | 45 | 47 | 35 | 29 | 42 | 48 | 58 | 41 | 56 | 73 | 63 | 49 | 54 | 46 | 34 | 39 | 36 |
| so2 | 1.1 | 0.92 | 0.93 | 1 | 0.98 | 0.67 | - | 0.44 | 0.58 | - | 1.1 | 1 | 0.97 | 0.99 | 0.93 | 0.82 | - | 1 | 0.86 | 1 | 0.73 | 0.64 | 1 | 0.97 | 1.2 | 1.2 | 1.6 | 1.2 | 1 | 1.2 | 0.45 | - |