Luftverschmutzung in Hastings County: Echtzeit-Luft-Qualitätsindex und Smog-Alarm.
Für die Hastings County. Heute ist Donnerstag, 4. Juni 2026. Für Hastings County wurden folgende Luftverschmutzungswerte gemessen:- Feinstaub (PM2,5) - 5 (gut)
- Stickstoffdioxid (NO2) - 0 (gut)
- Ozon (O3) - 0 (gut)

Wie ist die Luftqualität Hastings County heute? Ist die Luft in Hastings County? verschmutzt. Gibt es Smog?
Wie hoch ist der aktuelle PM2,5-Wert in Hastings County? (Feinstaub (PM2,5))
Die heutige PM2.5-Stufe ist:
5 (gut)
Zum Vergleich: Der höchste PM2,5-Wert in Hastings County in den letzten 7 Tagen war: 7 (Dienstag, 9. April 2024) und der niedrigste: 1 (Samstag, 13. April 2024).
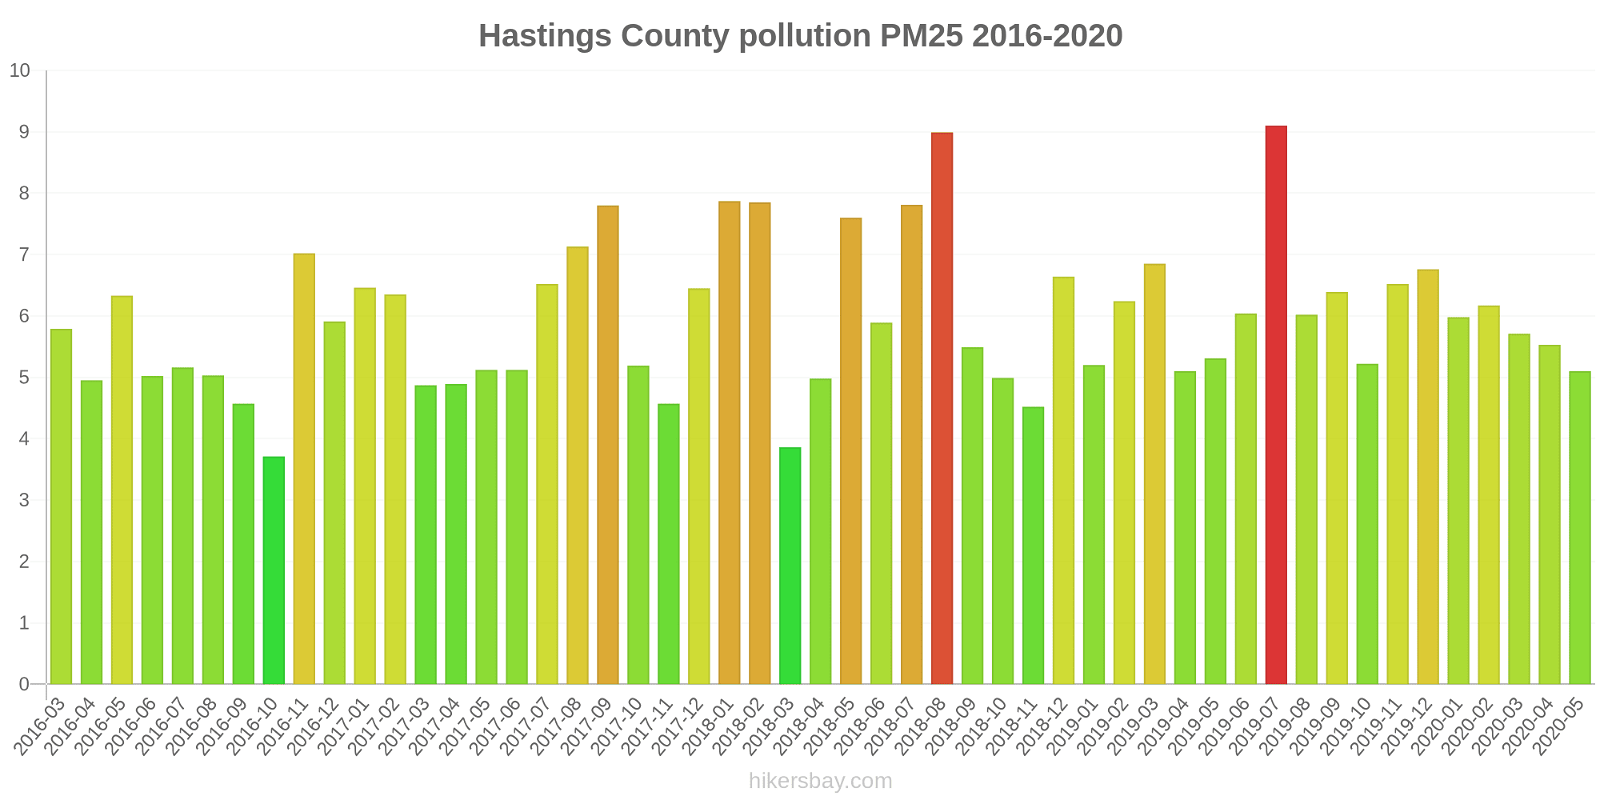
Die höchsten PM2,5-Werte wurden gemessen: 9.1 (Juli 2019).
Die niedrigste Feinstaubbelastung PM2,5 tritt im Monat auf: Oktober (3.7).
Wie hoch ist das NO2-Niveau? (Stickstoffdioxid (NO2))
0 (gut)
Wie ist das O3-Niveau heute in Hastings County? (Ozon (O3))
0 (gut)
Aktuelle Daten Dienstag, 16. April 2024, 10:00
PM2,5 5 (gut)
NO2 0 (gut)
O3 0 (gut)
0 (gut)
0 (gut)
Daten zur Luftverschmutzung der letzten Tage in Hastings County
index
2024-04-09
2024-04-10
2024-04-11
2024-04-12
2024-04-13
2024-04-14
2024-04-15
2024-04-16
nox
0
Good
0
Good
0
Good
0
Good
0
Good
0
Good
0
Good
0
Good
pm25
7
Good
5
Good
7
Good
2
Good
1
Good
3
Good
4
Good
3
Good
no2
0
Good
0
Good
0
Good
0
Good
0
Good
0
Good
0
Good
0
Good
o3
0
Good
0
Good
0
Good
0
Good
0
Good
0
Good
0
Good
0
Good
no
0
Good
0
Good
0
Good
0
Good
0
Good
0
Good
0
Good
0
Good
data source »
Luftverschmutzung in Hastings County von März 2016 bis Mai 2020
index
2020-05
2020-04
2020-03
2020-02
2020-01
2019-12
2019-11
2019-10
2019-09
2019-08
2019-07
2019-06
2019-05
2019-04
2019-03
2019-02
2019-01
2018-12
2018-11
2018-10
2018-09
2018-08
2018-07
2018-06
2018-05
2018-04
2018-03
2018-02
2018-01
2017-12
2017-11
2017-10
2017-09
2017-08
2017-07
2017-06
2017-05
2017-04
2017-03
2017-02
2017-01
2016-12
2016-11
2016-10
2016-09
2016-08
2016-07
2016-06
2016-05
2016-04
2016-03
o3:ppm
0.03 (Good)
0.04 (Good)
0.03 (Good)
0.03 (Good)
0.03 (Good)
0.02 (Good)
0.02 (Good)
0.02 (Good)
0.02 (Good)
0.03 (Good)
0.03 (Good)
0.03 (Good)
0.03 (Good)
0.04 (Good)
0.04 (Good)
0.03 (Good)
0.03 (Good)
0.02 (Good)
0.02 (Good)
0.02 (Good)
0.02 (Good)
0.03 (Good)
0.04 (Good)
0.03 (Good)
0.04 (Good)
0.04 (Good)
0.04 (Good)
0.03 (Good)
0.03 (Good)
0.03 (Good)
0.02 (Good)
0.03 (Good)
0.03 (Good)
0.03 (Good)
0.03 (Good)
0.04 (Good)
0.03 (Good)
0.04 (Good)
0.04 (Good)
0.03 (Good)
0.03 (Good)
0.03 (Good)
0.02 (Good)
0.02 (Good)
0.03 (Good)
0.03 (Good)
0.03 (Good)
0.03 (Good)
0.04 (Good)
0.04 (Good)
0.03 (Good)
pm25
5.1 (Good)
5.5 (Good)
5.7 (Good)
6.2 (Good)
6 (Good)
6.8 (Good)
6.5 (Good)
5.2 (Good)
6.4 (Good)
6 (Good)
9.1 (Good)
6 (Good)
5.3 (Good)
5.1 (Good)
6.8 (Good)
6.2 (Good)
5.2 (Good)
6.6 (Good)
4.5 (Good)
5 (Good)
5.5 (Good)
9 (Good)
7.8 (Good)
5.9 (Good)
7.6 (Good)
5 (Good)
3.9 (Good)
7.8 (Good)
7.9 (Good)
6.5 (Good)
4.6 (Good)
5.2 (Good)
7.8 (Good)
7.1 (Good)
6.5 (Good)
5.1 (Good)
5.1 (Good)
4.9 (Good)
4.9 (Good)
6.3 (Good)
6.5 (Good)
5.9 (Good)
7 (Good)
3.7 (Good)
4.6 (Good)
5 (Good)
5.2 (Good)
5 (Good)
6.3 (Good)
5 (Good)
5.8 (Good)
data source »
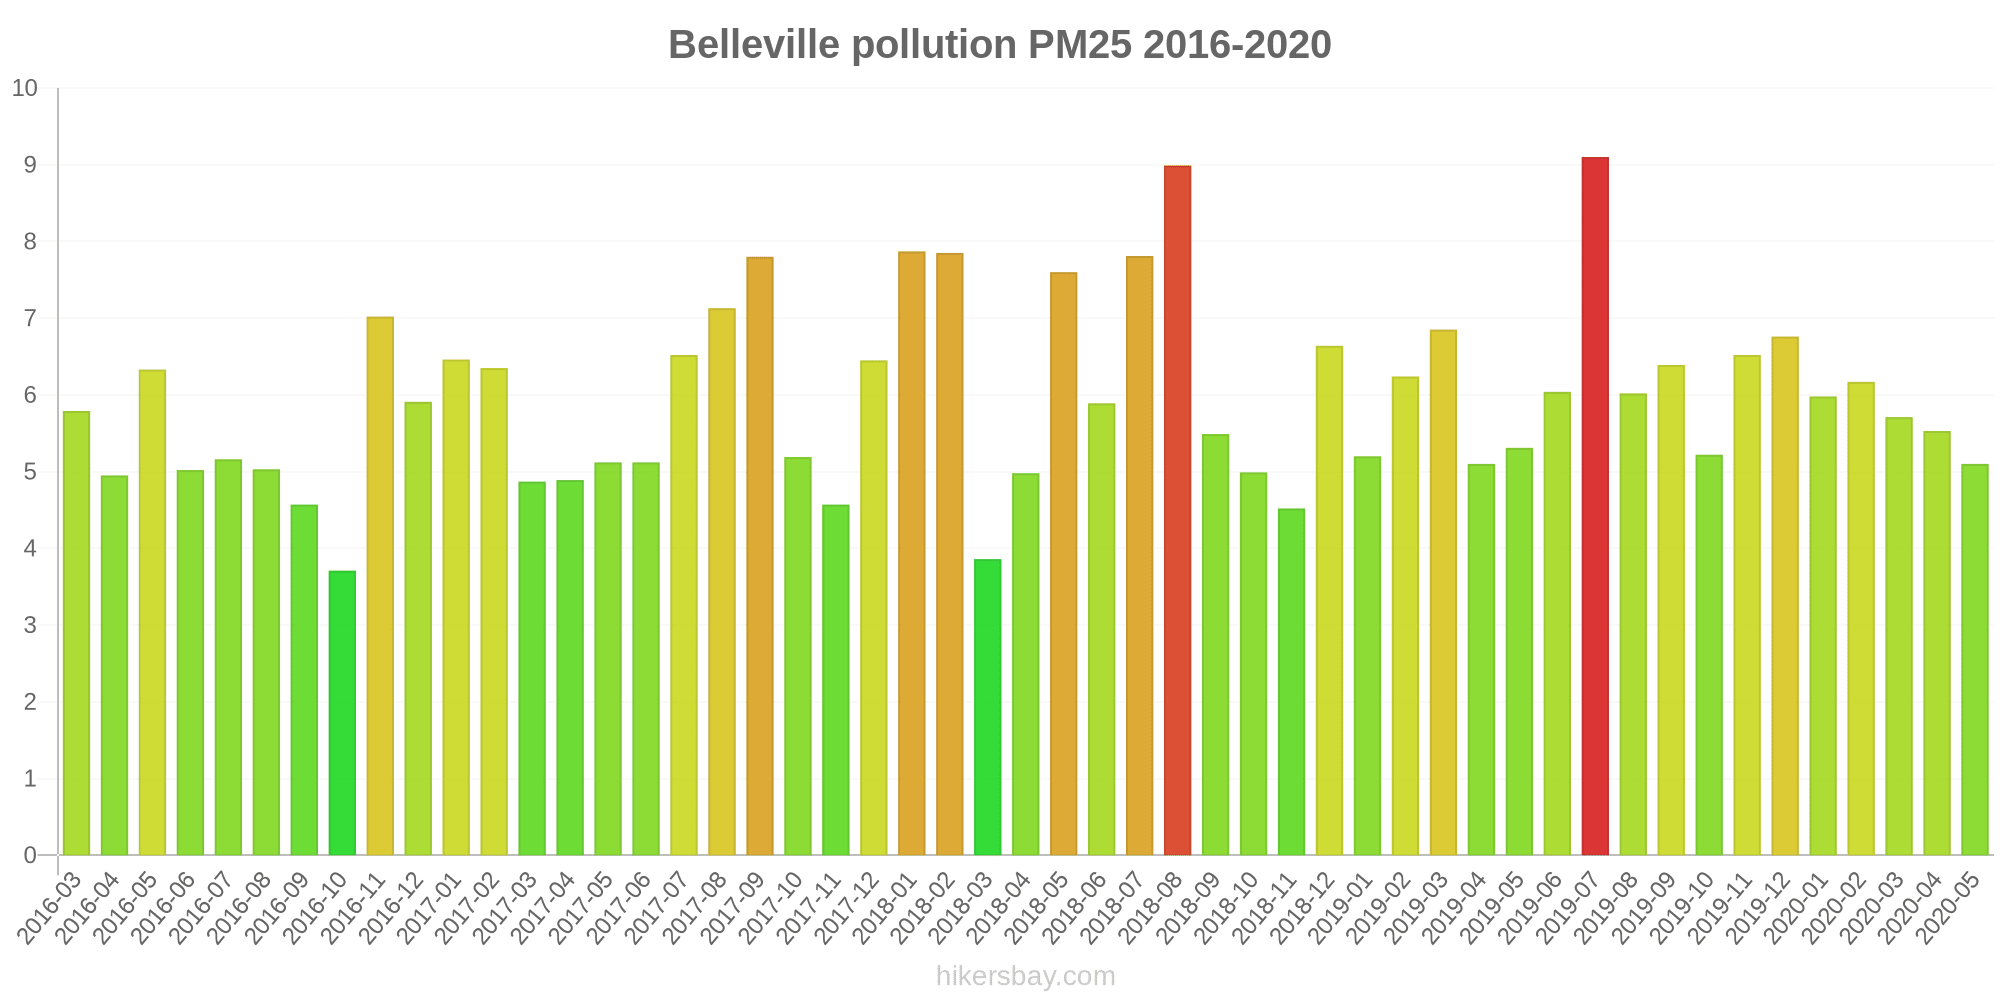
Belleville
Dienstag, 16. April 2024, 10:00
PM2,5 5 (gut)
Feinstaub (PM2,5)
NO2 0 (gut)
Stickstoffdioxid (NO2)
O3 0.03 (gut)
Ozon (O3)
0 (gut)
index_name_no
0 (gut)
index_name_nox
Belleville
index
2024-04-16
2024-04-15
2024-04-14
2024-04-13
2024-04-12
2024-04-11
2024-04-10
2024-04-09
nox
0.01
0
0
0
0
0.01
0
0.02
pm25
3.2
4
3.1
0.88
1.8
6.8
5.2
6.6
no2
0
0
0
0
0
0.01
0
0.01
o3
0.04
0.03
0.04
0.04
0.04
0.03
0.04
0.03
no
0
0
0
0
0
0
0
0.01
Belleville
2016-03 2020-05

index
2020-05
2020-04
2020-03
2020-02
2020-01
2019-12
2019-11
2019-10
2019-09
2019-08
2019-07
2019-06
2019-05
2019-04
2019-03
2019-02
2019-01
2018-12
2018-11
2018-10
2018-09
2018-08
2018-07
2018-06
2018-05
2018-04
2018-03
2018-02
2018-01
2017-12
2017-11
2017-10
2017-09
2017-08
2017-07
2017-06
2017-05
2017-04
2017-03
2017-02
2017-01
2016-12
2016-11
2016-10
2016-09
2016-08
2016-07
2016-06
2016-05
2016-04
2016-03
pm25
5.1
5.5
5.7
6.2
6
6.8
6.5
5.2
6.4
6
9.1
6
5.3
5.1
6.8
6.2
5.2
6.6
4.5
5
5.5
9
7.8
5.9
7.6
5
3.9
7.8
7.9
6.5
4.6
5.2
7.8
7.1
6.5
5.1
5.1
4.9
4.9
6.3
6.5
5.9
7
3.7
4.6
5
5.2
5
6.3
5
5.8
o3:ppm
0.03
0.04
0.03
0.03
0.03
0.02
0.02
0.02
0.02
0.03
0.03
0.03
0.03
0.04
0.04
0.03
0.03
0.02
0.02
0.02
0.02
0.03
0.04
0.03
0.04
0.04
0.04
0.03
0.03
0.03
0.02
0.03
0.03
0.03
0.03
0.04
0.03
0.04
0.04
0.03
0.03
0.03
0.02
0.02
0.03
0.03
0.03
0.03
0.04
0.04
0.03
* Pollution data source:
https://openaq.org
(AirNow)
The data is licensed under CC-By 4.0
PM2,5 5 (gut)
NO2 0 (gut)
O3 0 (gut)
0 (gut)
0 (gut)
Daten zur Luftverschmutzung der letzten Tage in Hastings County
| index | 2024-04-09 | 2024-04-10 | 2024-04-11 | 2024-04-12 | 2024-04-13 | 2024-04-14 | 2024-04-15 | 2024-04-16 |
|---|---|---|---|---|---|---|---|---|
| nox | 0 Good |
0 Good |
0 Good |
0 Good |
0 Good |
0 Good |
0 Good |
0 Good |
| pm25 | 7 Good |
5 Good |
7 Good |
2 Good |
1 Good |
3 Good |
4 Good |
3 Good |
| no2 | 0 Good |
0 Good |
0 Good |
0 Good |
0 Good |
0 Good |
0 Good |
0 Good |
| o3 | 0 Good |
0 Good |
0 Good |
0 Good |
0 Good |
0 Good |
0 Good |
0 Good |
| no | 0 Good |
0 Good |
0 Good |
0 Good |
0 Good |
0 Good |
0 Good |
0 Good |

| index | 2020-05 | 2020-04 | 2020-03 | 2020-02 | 2020-01 | 2019-12 | 2019-11 | 2019-10 | 2019-09 | 2019-08 | 2019-07 | 2019-06 | 2019-05 | 2019-04 | 2019-03 | 2019-02 | 2019-01 | 2018-12 | 2018-11 | 2018-10 | 2018-09 | 2018-08 | 2018-07 | 2018-06 | 2018-05 | 2018-04 | 2018-03 | 2018-02 | 2018-01 | 2017-12 | 2017-11 | 2017-10 | 2017-09 | 2017-08 | 2017-07 | 2017-06 | 2017-05 | 2017-04 | 2017-03 | 2017-02 | 2017-01 | 2016-12 | 2016-11 | 2016-10 | 2016-09 | 2016-08 | 2016-07 | 2016-06 | 2016-05 | 2016-04 | 2016-03 |
|---|---|---|---|---|---|---|---|---|---|---|---|---|---|---|---|---|---|---|---|---|---|---|---|---|---|---|---|---|---|---|---|---|---|---|---|---|---|---|---|---|---|---|---|---|---|---|---|---|---|---|---|
| o3:ppm | 0.03 (Good) | 0.04 (Good) | 0.03 (Good) | 0.03 (Good) | 0.03 (Good) | 0.02 (Good) | 0.02 (Good) | 0.02 (Good) | 0.02 (Good) | 0.03 (Good) | 0.03 (Good) | 0.03 (Good) | 0.03 (Good) | 0.04 (Good) | 0.04 (Good) | 0.03 (Good) | 0.03 (Good) | 0.02 (Good) | 0.02 (Good) | 0.02 (Good) | 0.02 (Good) | 0.03 (Good) | 0.04 (Good) | 0.03 (Good) | 0.04 (Good) | 0.04 (Good) | 0.04 (Good) | 0.03 (Good) | 0.03 (Good) | 0.03 (Good) | 0.02 (Good) | 0.03 (Good) | 0.03 (Good) | 0.03 (Good) | 0.03 (Good) | 0.04 (Good) | 0.03 (Good) | 0.04 (Good) | 0.04 (Good) | 0.03 (Good) | 0.03 (Good) | 0.03 (Good) | 0.02 (Good) | 0.02 (Good) | 0.03 (Good) | 0.03 (Good) | 0.03 (Good) | 0.03 (Good) | 0.04 (Good) | 0.04 (Good) | 0.03 (Good) |
| pm25 | 5.1 (Good) | 5.5 (Good) | 5.7 (Good) | 6.2 (Good) | 6 (Good) | 6.8 (Good) | 6.5 (Good) | 5.2 (Good) | 6.4 (Good) | 6 (Good) | 9.1 (Good) | 6 (Good) | 5.3 (Good) | 5.1 (Good) | 6.8 (Good) | 6.2 (Good) | 5.2 (Good) | 6.6 (Good) | 4.5 (Good) | 5 (Good) | 5.5 (Good) | 9 (Good) | 7.8 (Good) | 5.9 (Good) | 7.6 (Good) | 5 (Good) | 3.9 (Good) | 7.8 (Good) | 7.9 (Good) | 6.5 (Good) | 4.6 (Good) | 5.2 (Good) | 7.8 (Good) | 7.1 (Good) | 6.5 (Good) | 5.1 (Good) | 5.1 (Good) | 4.9 (Good) | 4.9 (Good) | 6.3 (Good) | 6.5 (Good) | 5.9 (Good) | 7 (Good) | 3.7 (Good) | 4.6 (Good) | 5 (Good) | 5.2 (Good) | 5 (Good) | 6.3 (Good) | 5 (Good) | 5.8 (Good) |
PM2,5 5 (gut)
Feinstaub (PM2,5)NO2 0 (gut)
Stickstoffdioxid (NO2)O3 0.03 (gut)
Ozon (O3)0 (gut)
index_name_no0 (gut)
index_name_noxBelleville
| index | 2024-04-16 | 2024-04-15 | 2024-04-14 | 2024-04-13 | 2024-04-12 | 2024-04-11 | 2024-04-10 | 2024-04-09 |
|---|---|---|---|---|---|---|---|---|
| nox | 0.01 | 0 | 0 | 0 | 0 | 0.01 | 0 | 0.02 |
| pm25 | 3.2 | 4 | 3.1 | 0.88 | 1.8 | 6.8 | 5.2 | 6.6 |
| no2 | 0 | 0 | 0 | 0 | 0 | 0.01 | 0 | 0.01 |
| o3 | 0.04 | 0.03 | 0.04 | 0.04 | 0.04 | 0.03 | 0.04 | 0.03 |
| no | 0 | 0 | 0 | 0 | 0 | 0 | 0 | 0.01 |
Belleville
| index | 2020-05 | 2020-04 | 2020-03 | 2020-02 | 2020-01 | 2019-12 | 2019-11 | 2019-10 | 2019-09 | 2019-08 | 2019-07 | 2019-06 | 2019-05 | 2019-04 | 2019-03 | 2019-02 | 2019-01 | 2018-12 | 2018-11 | 2018-10 | 2018-09 | 2018-08 | 2018-07 | 2018-06 | 2018-05 | 2018-04 | 2018-03 | 2018-02 | 2018-01 | 2017-12 | 2017-11 | 2017-10 | 2017-09 | 2017-08 | 2017-07 | 2017-06 | 2017-05 | 2017-04 | 2017-03 | 2017-02 | 2017-01 | 2016-12 | 2016-11 | 2016-10 | 2016-09 | 2016-08 | 2016-07 | 2016-06 | 2016-05 | 2016-04 | 2016-03 |
|---|---|---|---|---|---|---|---|---|---|---|---|---|---|---|---|---|---|---|---|---|---|---|---|---|---|---|---|---|---|---|---|---|---|---|---|---|---|---|---|---|---|---|---|---|---|---|---|---|---|---|---|
| pm25 | 5.1 | 5.5 | 5.7 | 6.2 | 6 | 6.8 | 6.5 | 5.2 | 6.4 | 6 | 9.1 | 6 | 5.3 | 5.1 | 6.8 | 6.2 | 5.2 | 6.6 | 4.5 | 5 | 5.5 | 9 | 7.8 | 5.9 | 7.6 | 5 | 3.9 | 7.8 | 7.9 | 6.5 | 4.6 | 5.2 | 7.8 | 7.1 | 6.5 | 5.1 | 5.1 | 4.9 | 4.9 | 6.3 | 6.5 | 5.9 | 7 | 3.7 | 4.6 | 5 | 5.2 | 5 | 6.3 | 5 | 5.8 |
| o3:ppm | 0.03 | 0.04 | 0.03 | 0.03 | 0.03 | 0.02 | 0.02 | 0.02 | 0.02 | 0.03 | 0.03 | 0.03 | 0.03 | 0.04 | 0.04 | 0.03 | 0.03 | 0.02 | 0.02 | 0.02 | 0.02 | 0.03 | 0.04 | 0.03 | 0.04 | 0.04 | 0.04 | 0.03 | 0.03 | 0.03 | 0.02 | 0.03 | 0.03 | 0.03 | 0.03 | 0.04 | 0.03 | 0.04 | 0.04 | 0.03 | 0.03 | 0.03 | 0.02 | 0.02 | 0.03 | 0.03 | 0.03 | 0.03 | 0.04 | 0.04 | 0.03 |