Luftverschmutzung in Thompson-Nicola Regional District: Echtzeit-Luft-Qualitätsindex und Smog-Alarm.
Für die Thompson-Nicola Regional District. Heute ist Donnerstag, 4. Juni 2026. Für Thompson-Nicola Regional District wurden folgende Luftverschmutzungswerte gemessen:- Schwefeldioxid (SO2) - 0 (gut)
- Feinstaub (PM2,5) - 1 (gut)
- Ozon (O3) - 0 (gut)
- Stickstoffdioxid (NO2) - 0 (gut)

Wie ist die Luftqualität Thompson-Nicola Regional District heute? Ist die Luft in Thompson-Nicola Regional District? verschmutzt. Gibt es Smog?
Wie hoch ist die SO2-Belastung? (Schwefeldioxid (SO2))
0 (gut)
Wie hoch ist der aktuelle PM2,5-Wert in Thompson-Nicola Regional District? (Feinstaub (PM2,5))
Die heutige PM2.5-Stufe ist:
1 (gut)
Zum Vergleich: Der höchste PM2,5-Wert in Thompson-Nicola Regional District in den letzten 7 Tagen war: 7 (Sonntag, 14. April 2024) und der niedrigste: 3 (Dienstag, 9. April 2024).
Die höchsten PM2,5-Werte wurden gemessen: 46 (August 2018).
Die niedrigste Feinstaubbelastung PM2,5 tritt im Monat auf: Mai (3.7).
Wie ist das O3-Niveau heute in Thompson-Nicola Regional District? (Ozon (O3))
0 (gut)
Wie hoch ist das NO2-Niveau? (Stickstoffdioxid (NO2))
0 (gut)
Aktuelle Daten Dienstag, 16. April 2024, 10:00
SO2 0 (gut)
PM2,5 1 (gut)
O3 0 (gut)
0 (gut)
NO2 0 (gut)
Daten zur Luftverschmutzung der letzten Tage in Thompson-Nicola Regional District
index
2024-04-09
2024-04-10
2024-04-11
2024-04-12
2024-04-13
2024-04-14
2024-04-15
2024-04-16
no2
0
Good
0
Good
0
Good
0
Good
0
Good
0
Good
0
Good
0
Good
o3
0
Good
0
Good
0
Good
0
Good
0
Good
0
Good
0
Good
0
Good
pm25
3
Good
4
Good
4
Good
5
Good
4
Good
7
Good
6
Good
3
Good
no
0
Good
0
Good
0
Good
0
Good
0
Good
0
Good
0
Good
0
Good
so2
0
Good
0
Good
0
Good
0
Good
0
Good
0
Good
0
Good
0
Good
data source »
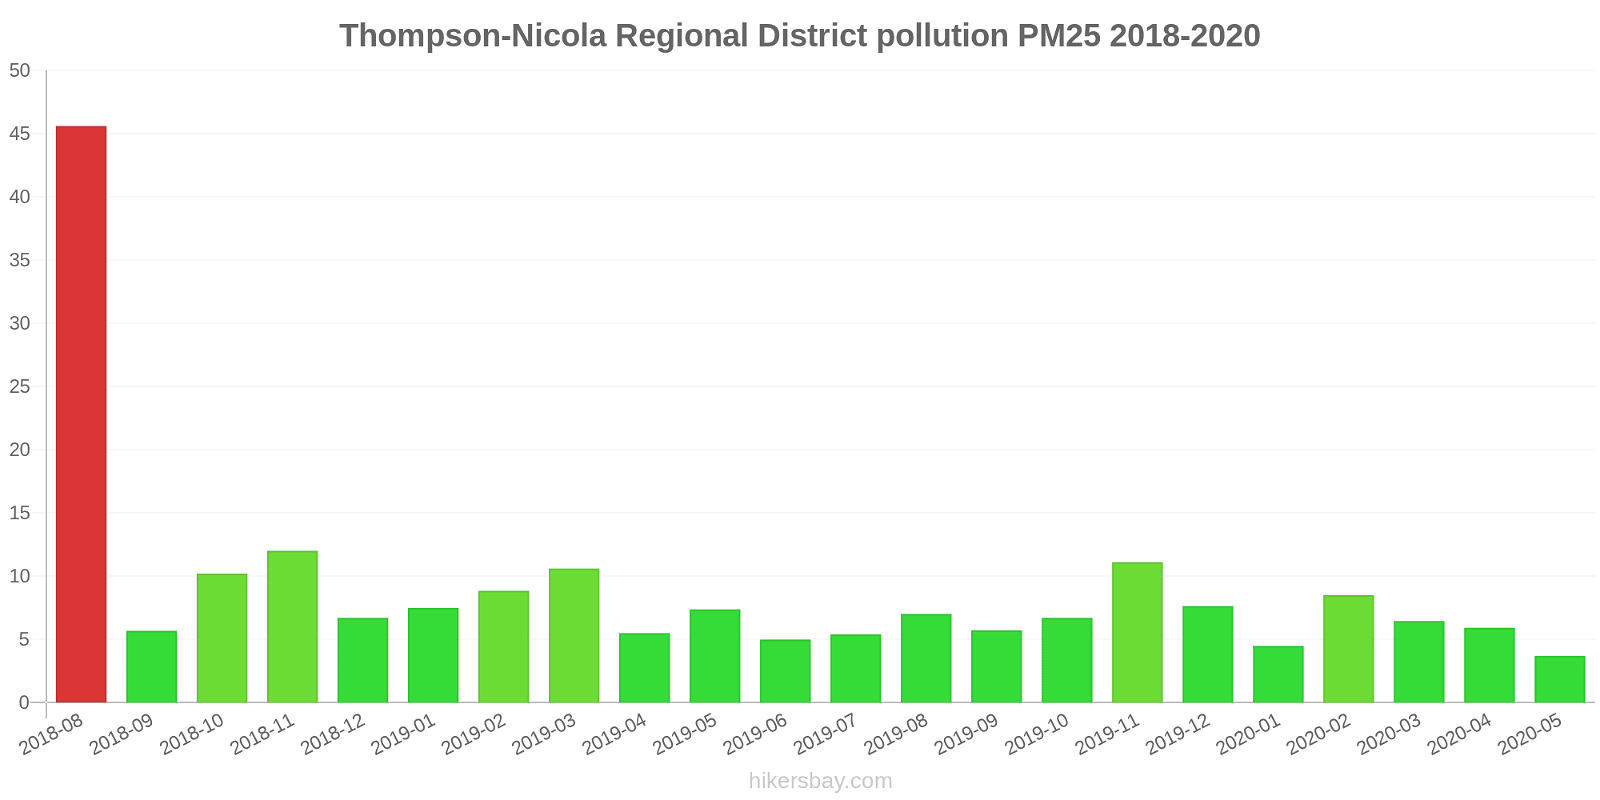
Luftverschmutzung in Thompson-Nicola Regional District von August 2018 bis Mai 2020
index
2020-05
2020-04
2020-03
2020-02
2020-01
2019-12
2019-11
2019-10
2019-09
2019-08
2019-07
2019-06
2019-05
2019-04
2019-03
2019-02
2019-01
2018-12
2018-11
2018-10
2018-09
2018-08
pm25
3.7 (Good)
5.9 (Good)
6.5 (Good)
8.5 (Good)
4.5 (Good)
7.6 (Good)
11 (Good)
6.7 (Good)
5.7 (Good)
7 (Good)
5.4 (Good)
5 (Good)
7.4 (Good)
5.5 (Good)
11 (Good)
8.8 (Good)
7.5 (Good)
6.7 (Good)
12 (Good)
10 (Good)
5.7 (Good)
46 (Unhealthy for Sensitive Groups)
data source »
Lebensqualität in Thompson-Nicola Regional District
Grün und Parks in der Stadt
Thompson-Nicola Regional District
75 %
Vereinigte Staaten von Amerika: 70 %
Venezuela: 41 %
Island: 72 %
Feinstaub PM2,5
Thompson-Nicola Regional District
8 (Good)
Vergnügen, Zeit in der Stadt zu verbringen
Thompson-Nicola Regional District
75 %
Vereinigte Staaten von Amerika: 75 %
Bahamas: 53 %
Venezuela: 41 %
Island: 89 %
Feinstaub PM10
Thompson-Nicola Regional District
15 (Good)
Luftverschmutzung
Thompson-Nicola Regional District
32 %
Vereinigte Staaten von Amerika: 29 %
Bahamas: 52 %
Venezuela: 59 %
Island: 13 %
Müllentsorgung
Thompson-Nicola Regional District
75 %
Vereinigte Staaten von Amerika: 71 %
Bahamas: 29 %
Venezuela: 18 %
Island: 79 %
Verfügbarkeit und Qualität von Trinkwasser
Thompson-Nicola Regional District
80 %
Vereinigte Staaten von Amerika: 71 %
Bahamas: 55 %
Venezuela: 28 %
Island: 96 %
Sauberkeit und Ordentlichkeit
Thompson-Nicola Regional District
68 %
Vereinigte Staaten von Amerika: 60 %
Bahamas: 35 %
Venezuela: 22 %
Island: 75 %
Lärm und Lichtverschmutzung
Thompson-Nicola Regional District
32 %
Vereinigte Staaten von Amerika: 47 %
Bahamas: 39 %
Venezuela: 47 %
Island: 23 %
Wasserverschmutzung
Thompson-Nicola Regional District
25 %
Vereinigte Staaten von Amerika: 44 %
Bahamas: 58 %
Venezuela: 76 %
Island: 8,4 %
Source: Numbeo
Kamloops Federal Bui
Dienstag, 16. April 2024, 10:00
SO2 0 (gut)
Schwefeldioxid (SO2)
PM2,5 0.9 (gut)
Feinstaub (PM2,5)
O3 0.03 (gut)
Ozon (O3)
0 (gut)
index_name_no
NO2 0.01 (gut)
Stickstoffdioxid (NO2)
Kamloops Federal Bui
index
2024-04-16
2024-04-15
2024-04-14
2024-04-13
2024-04-12
2024-04-11
2024-04-10
2024-04-09
no2
0
0.01
0.01
0.01
0.01
0.01
0.01
0.01
o3
0.04
0.04
0.03
0.03
0.03
0.03
0.02
0.03
pm25
2.6
6.1
6.6
4.1
5.3
4.4
4
3.2
no
0
0
0.01
0
0
0
0.01
0
so2
0
0
0
0
0
0
0
0
Kamloops Federal Bui
2018-08 2020-05
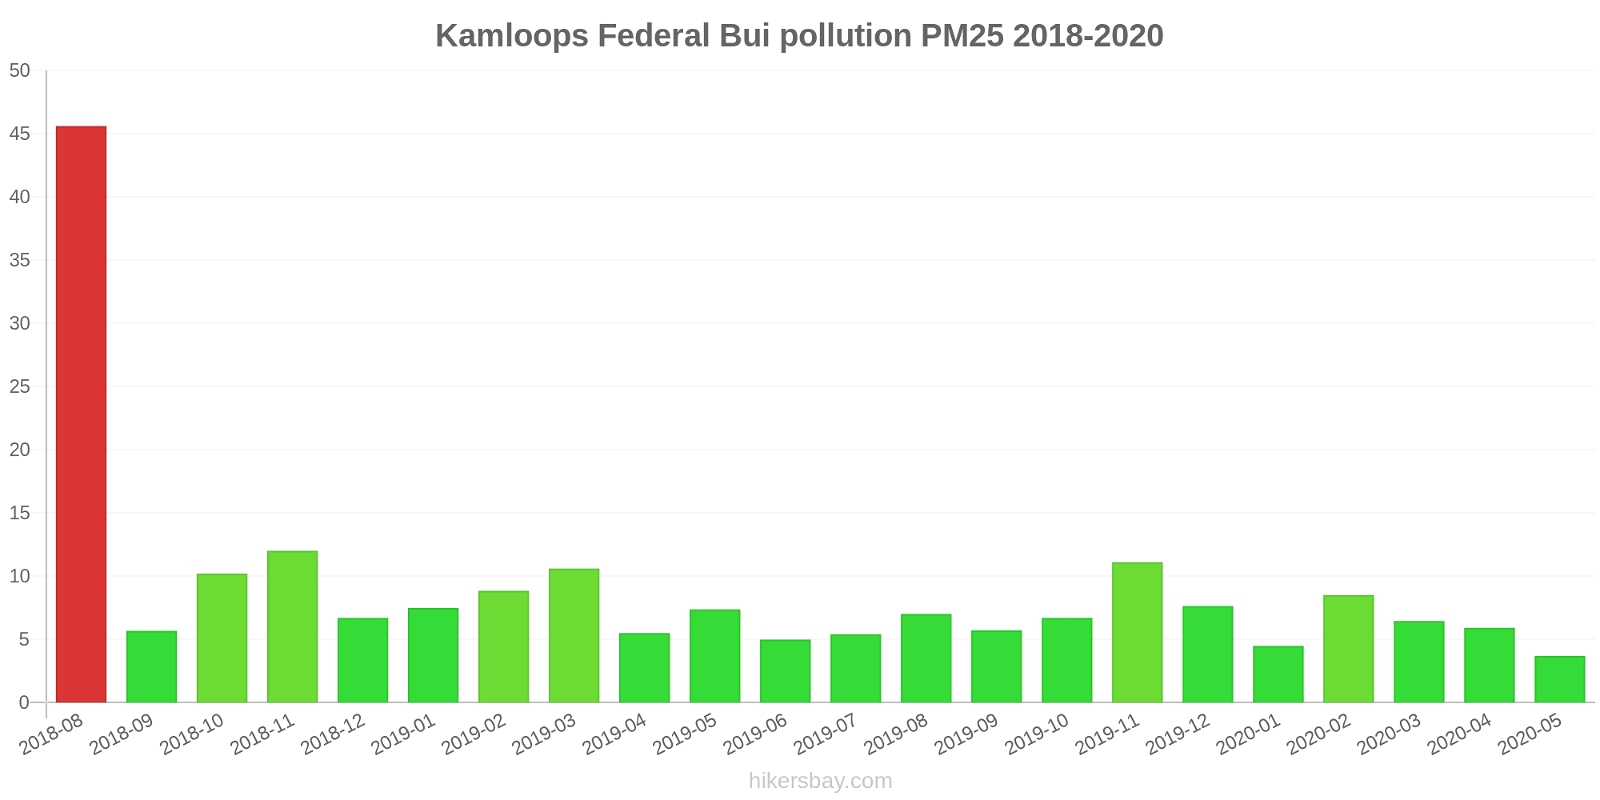
index
2020-05
2020-04
2020-03
2020-02
2020-01
2019-12
2019-11
2019-10
2019-09
2019-08
2019-07
2019-06
2019-05
2019-04
2019-03
2019-02
2019-01
2018-12
2018-11
2018-10
2018-09
2018-08
pm25
3.7
5.9
6.5
8.5
4.5
7.6
11
6.7
5.7
7
5.4
5
7.4
5.5
11
8.8
7.5
6.7
12
10
5.7
46
* Pollution data source:
https://openaq.org
(AirNow)
The data is licensed under CC-By 4.0
SO2 0 (gut)
PM2,5 1 (gut)
O3 0 (gut)
0 (gut)
NO2 0 (gut)
Daten zur Luftverschmutzung der letzten Tage in Thompson-Nicola Regional District
| index | 2024-04-09 | 2024-04-10 | 2024-04-11 | 2024-04-12 | 2024-04-13 | 2024-04-14 | 2024-04-15 | 2024-04-16 |
|---|---|---|---|---|---|---|---|---|
| no2 | 0 Good |
0 Good |
0 Good |
0 Good |
0 Good |
0 Good |
0 Good |
0 Good |
| o3 | 0 Good |
0 Good |
0 Good |
0 Good |
0 Good |
0 Good |
0 Good |
0 Good |
| pm25 | 3 Good |
4 Good |
4 Good |
5 Good |
4 Good |
7 Good |
6 Good |
3 Good |
| no | 0 Good |
0 Good |
0 Good |
0 Good |
0 Good |
0 Good |
0 Good |
0 Good |
| so2 | 0 Good |
0 Good |
0 Good |
0 Good |
0 Good |
0 Good |
0 Good |
0 Good |
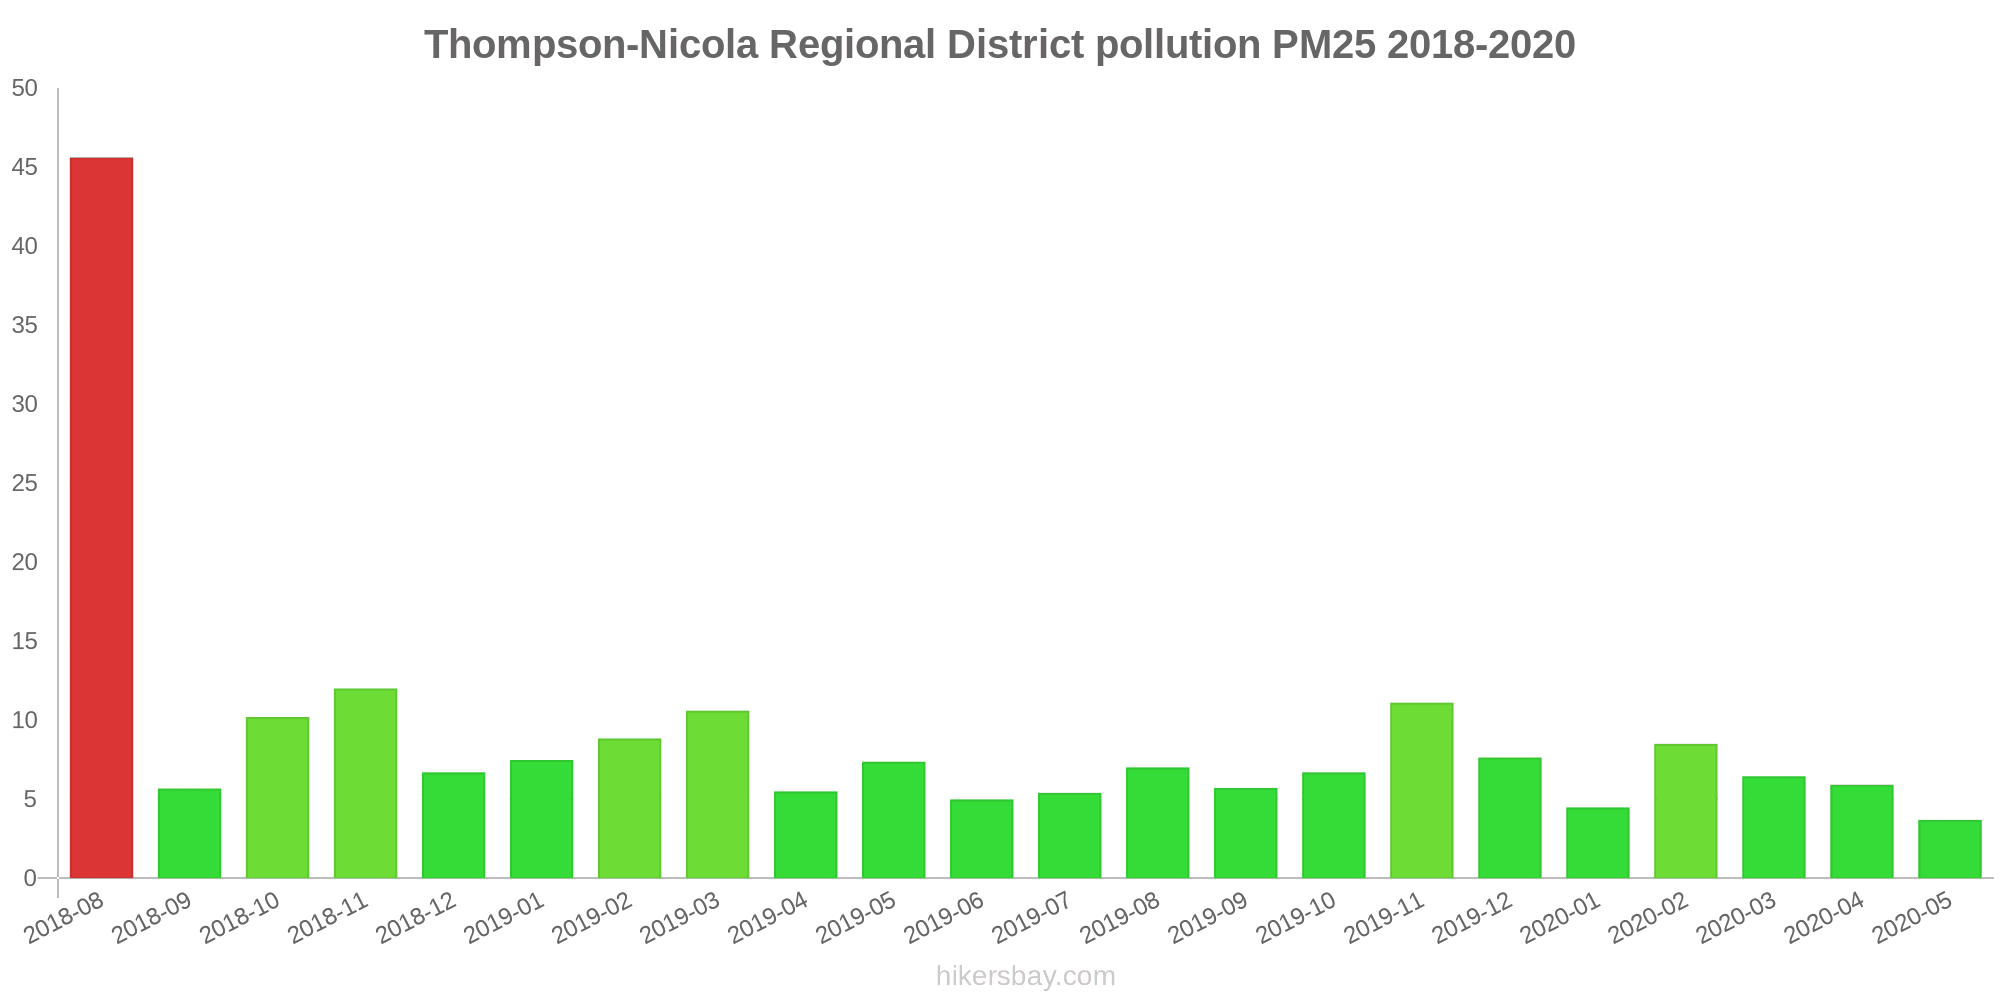
| index | 2020-05 | 2020-04 | 2020-03 | 2020-02 | 2020-01 | 2019-12 | 2019-11 | 2019-10 | 2019-09 | 2019-08 | 2019-07 | 2019-06 | 2019-05 | 2019-04 | 2019-03 | 2019-02 | 2019-01 | 2018-12 | 2018-11 | 2018-10 | 2018-09 | 2018-08 |
|---|---|---|---|---|---|---|---|---|---|---|---|---|---|---|---|---|---|---|---|---|---|---|
| pm25 | 3.7 (Good) | 5.9 (Good) | 6.5 (Good) | 8.5 (Good) | 4.5 (Good) | 7.6 (Good) | 11 (Good) | 6.7 (Good) | 5.7 (Good) | 7 (Good) | 5.4 (Good) | 5 (Good) | 7.4 (Good) | 5.5 (Good) | 11 (Good) | 8.8 (Good) | 7.5 (Good) | 6.7 (Good) | 12 (Good) | 10 (Good) | 5.7 (Good) | 46 (Unhealthy for Sensitive Groups) |
Grün und Parks in der Stadt
Thompson-Nicola Regional District 75 %
Vereinigte Staaten von Amerika: 70 % Venezuela: 41 % Island: 72 %Feinstaub PM2,5
Thompson-Nicola Regional District 8 (Good)
Vergnügen, Zeit in der Stadt zu verbringen
Thompson-Nicola Regional District 75 %
Vereinigte Staaten von Amerika: 75 % Bahamas: 53 % Venezuela: 41 % Island: 89 %Feinstaub PM10
Thompson-Nicola Regional District 15 (Good)
Luftverschmutzung
Thompson-Nicola Regional District 32 %
Vereinigte Staaten von Amerika: 29 % Bahamas: 52 % Venezuela: 59 % Island: 13 %Müllentsorgung
Thompson-Nicola Regional District 75 %
Vereinigte Staaten von Amerika: 71 % Bahamas: 29 % Venezuela: 18 % Island: 79 %Verfügbarkeit und Qualität von Trinkwasser
Thompson-Nicola Regional District 80 %
Vereinigte Staaten von Amerika: 71 % Bahamas: 55 % Venezuela: 28 % Island: 96 %Sauberkeit und Ordentlichkeit
Thompson-Nicola Regional District 68 %
Vereinigte Staaten von Amerika: 60 % Bahamas: 35 % Venezuela: 22 % Island: 75 %Lärm und Lichtverschmutzung
Thompson-Nicola Regional District 32 %
Vereinigte Staaten von Amerika: 47 % Bahamas: 39 % Venezuela: 47 % Island: 23 %Wasserverschmutzung
Thompson-Nicola Regional District 25 %
Vereinigte Staaten von Amerika: 44 % Bahamas: 58 % Venezuela: 76 % Island: 8,4 %SO2 0 (gut)
Schwefeldioxid (SO2)PM2,5 0.9 (gut)
Feinstaub (PM2,5)O3 0.03 (gut)
Ozon (O3)0 (gut)
index_name_noNO2 0.01 (gut)
Stickstoffdioxid (NO2)Kamloops Federal Bui
| index | 2024-04-16 | 2024-04-15 | 2024-04-14 | 2024-04-13 | 2024-04-12 | 2024-04-11 | 2024-04-10 | 2024-04-09 |
|---|---|---|---|---|---|---|---|---|
| no2 | 0 | 0.01 | 0.01 | 0.01 | 0.01 | 0.01 | 0.01 | 0.01 |
| o3 | 0.04 | 0.04 | 0.03 | 0.03 | 0.03 | 0.03 | 0.02 | 0.03 |
| pm25 | 2.6 | 6.1 | 6.6 | 4.1 | 5.3 | 4.4 | 4 | 3.2 |
| no | 0 | 0 | 0.01 | 0 | 0 | 0 | 0.01 | 0 |
| so2 | 0 | 0 | 0 | 0 | 0 | 0 | 0 | 0 |
Kamloops Federal Bui

| index | 2020-05 | 2020-04 | 2020-03 | 2020-02 | 2020-01 | 2019-12 | 2019-11 | 2019-10 | 2019-09 | 2019-08 | 2019-07 | 2019-06 | 2019-05 | 2019-04 | 2019-03 | 2019-02 | 2019-01 | 2018-12 | 2018-11 | 2018-10 | 2018-09 | 2018-08 |
|---|---|---|---|---|---|---|---|---|---|---|---|---|---|---|---|---|---|---|---|---|---|---|
| pm25 | 3.7 | 5.9 | 6.5 | 8.5 | 4.5 | 7.6 | 11 | 6.7 | 5.7 | 7 | 5.4 | 5 | 7.4 | 5.5 | 11 | 8.8 | 7.5 | 6.7 | 12 | 10 | 5.7 | 46 |