Luftverschmutzung in Victoria: Echtzeit-Luft-Qualitätsindex und Smog-Alarm.
Für die Victoria. Heute ist Donnerstag, 4. Juni 2026. Für Victoria wurden folgende Luftverschmutzungswerte gemessen:- Stickstoffdioxid (NO2) - 0 (gut)
- Schwefeldioxid (SO2) - 0 (gut)
- Kohlenmonoxid (CO) - 0 (gut)
- Feinstaub (PM2,5) - 2 (gut)
- Ozon (O3) - 0 (gut)

Wie ist die Luftqualität Victoria heute? Ist die Luft in Victoria? verschmutzt. Gibt es Smog?
Wie hoch ist das NO2-Niveau? (Stickstoffdioxid (NO2))
0 (gut)
Wie hoch ist die SO2-Belastung? (Schwefeldioxid (SO2))
0 (gut)
Wie hoch ist der CO-Gehalt? (Kohlenmonoxid (CO))
0 (gut)
Wie hoch ist der aktuelle PM2,5-Wert in Victoria? (Feinstaub (PM2,5))
Die heutige PM2.5-Stufe ist:
2 (gut)
Zum Vergleich: Der höchste PM2,5-Wert in Victoria in den letzten 7 Tagen war: 10 (Freitag, 26. Mai 2023) und der niedrigste: 5 (Montag, 29. Mai 2023).
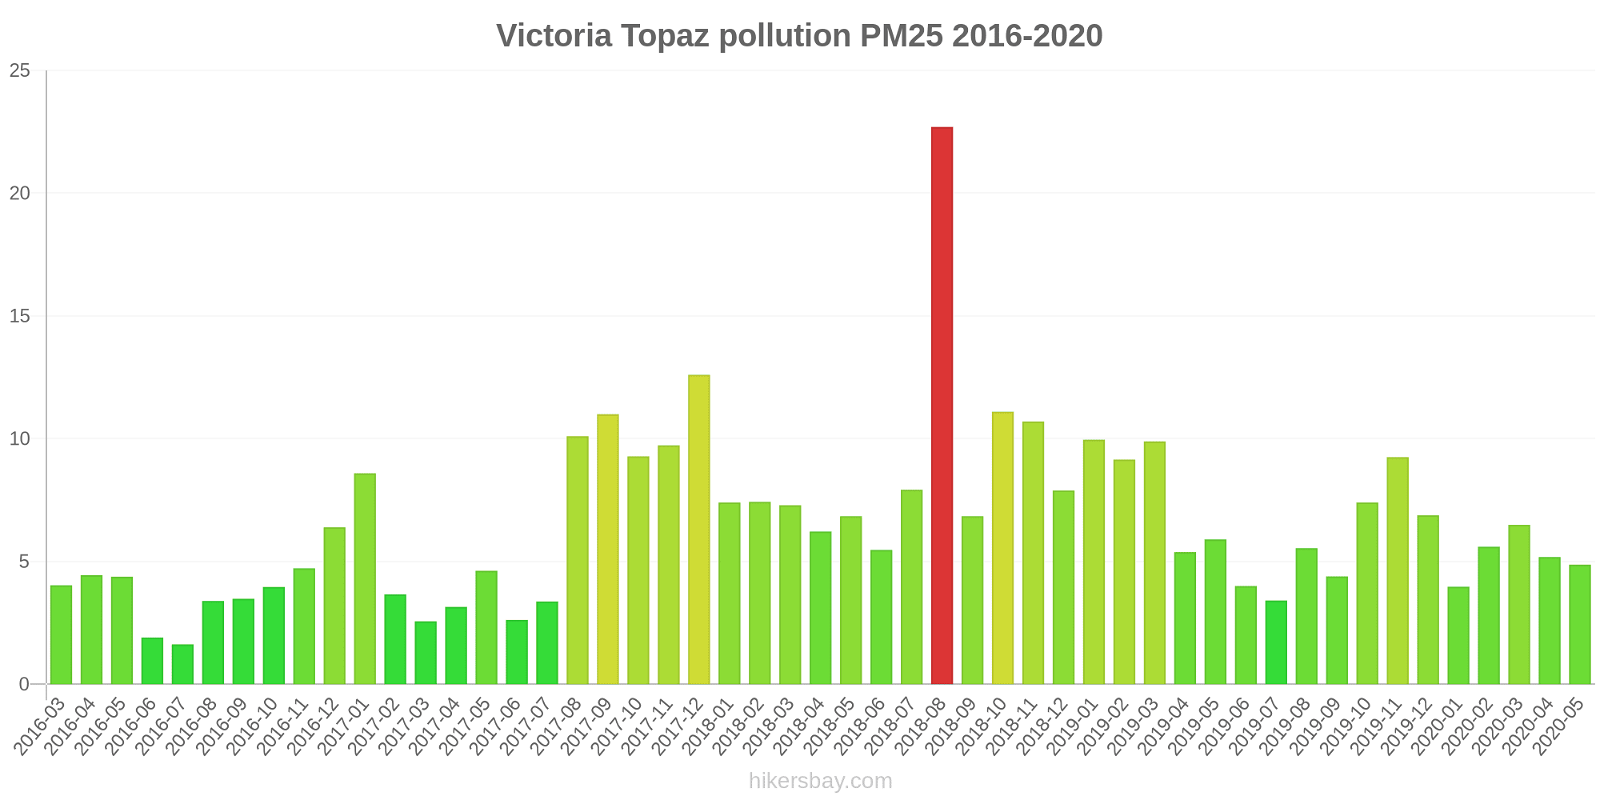
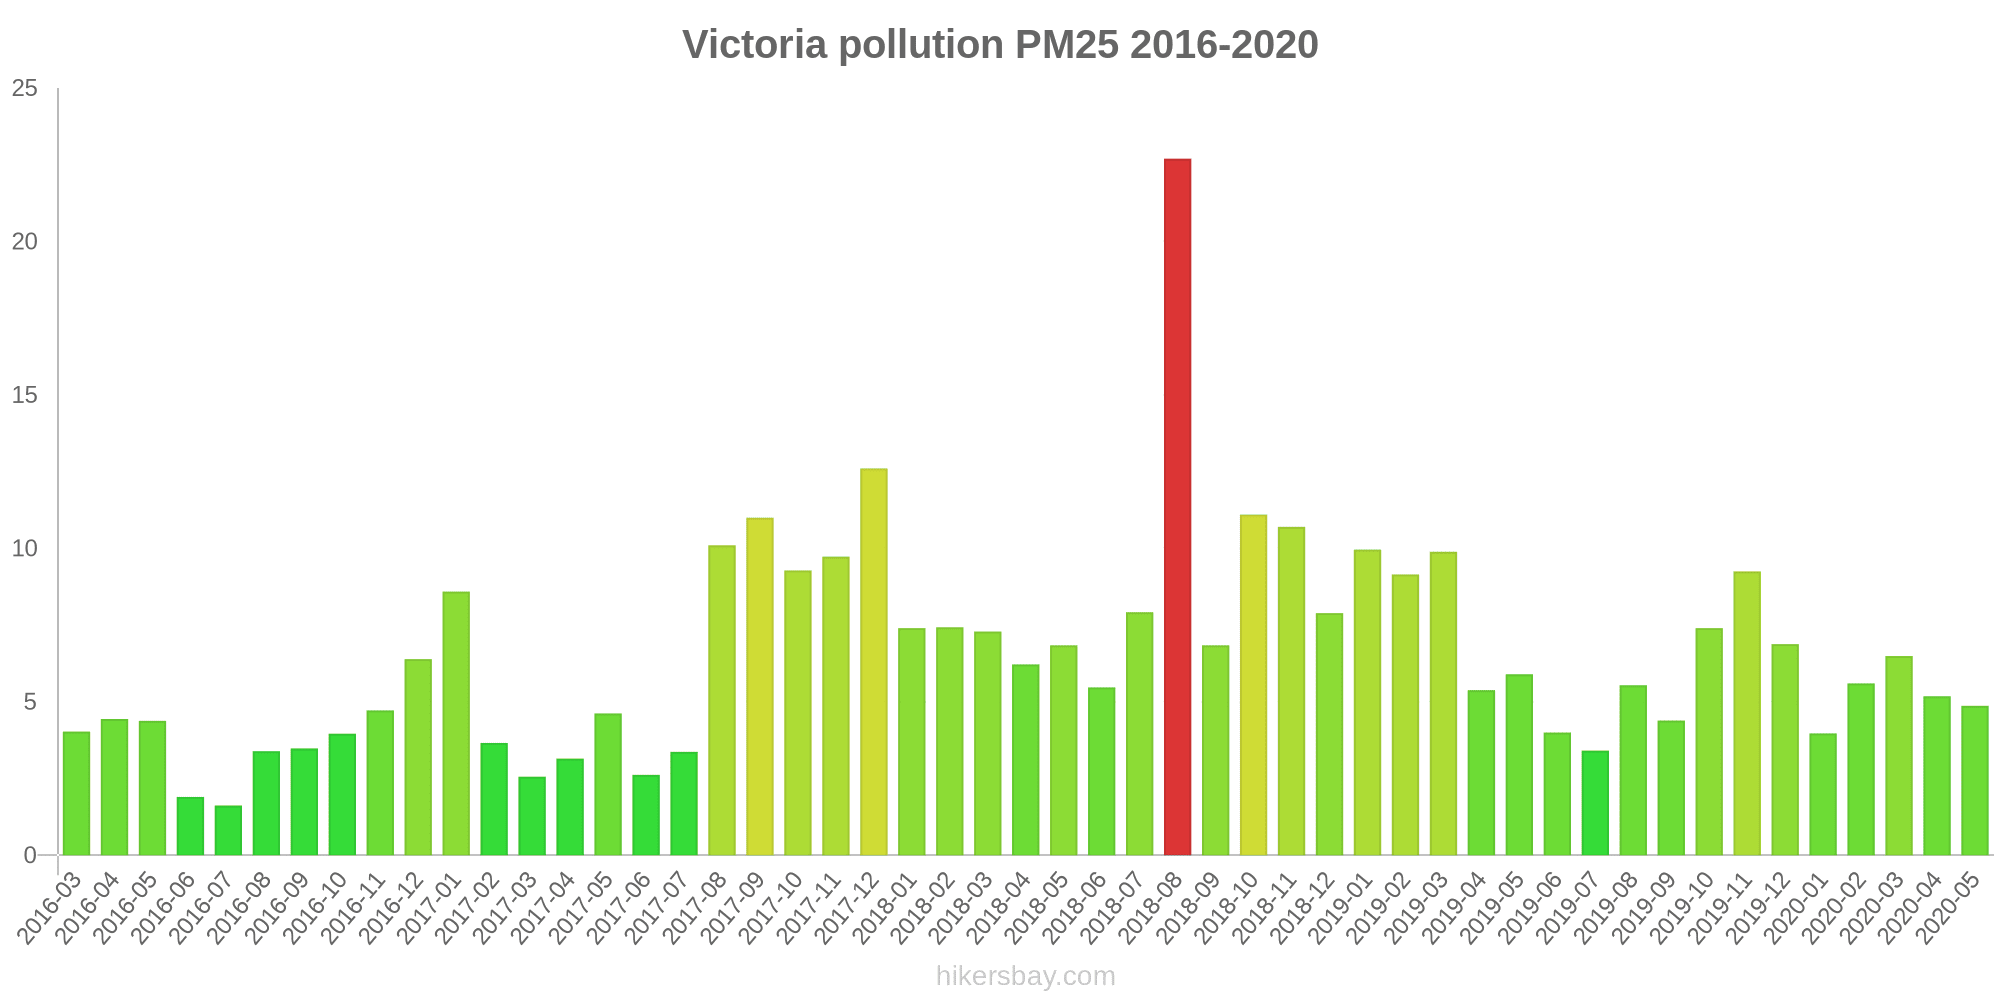
Die höchsten PM2,5-Werte wurden gemessen: 23 (August 2018).
Die niedrigste Feinstaubbelastung PM2,5 tritt im Monat auf: Juli (1.6).
Wie ist das O3-Niveau heute in Victoria? (Ozon (O3))
0 (gut)
Aktuelle Daten Dienstag, 30. Mai 2023, 23:00
NO2 0 (gut)
SO2 0 (gut)
CO 0 (gut)
PM2,5 2 (gut)
O3 0 (gut)
0 (gut)
Daten zur Luftverschmutzung der letzten Tage in Victoria
index
2023-05-24
2023-05-25
2023-05-26
2023-05-27
2023-05-28
2023-05-29
2023-05-30
pm25
9
Good
8
Good
10
Good
6
Good
7
Good
5
Good
7
Good
co
0
Good
0
Good
0
Good
0
Good
0
Good
0
Good
0
Good
no2
0
Good
0
Good
0
Good
0
Good
0
Good
0
Good
0
Good
o3
0
Good
0
Good
0
Good
0
Good
0
Good
0
Good
0
Good
no
0
Good
0
Good
0
Good
0
Good
0
Good
0
Good
0
Good
so2
0
Good
0
Good
0
Good
0
Good
0
Good
0
Good
0
Good
data source »
Luftverschmutzung in Victoria von März 2016 bis Mai 2020

index
2020-05
2020-04
2020-03
2020-02
2020-01
2019-12
2019-11
2019-10
2019-09
2019-08
2019-07
2019-06
2019-05
2019-04
2019-03
2019-02
2019-01
2018-12
2018-11
2018-10
2018-09
2018-08
2018-07
2018-06
2018-05
2018-04
2018-03
2018-02
2018-01
2017-12
2017-11
2017-10
2017-09
2017-08
2017-07
2017-06
2017-05
2017-04
2017-03
2017-02
2017-01
2016-12
2016-11
2016-10
2016-09
2016-08
2016-07
2016-06
2016-05
2016-04
2016-03
o3:ppm
0.03 (Good)
0.03 (Good)
0.03 (Good)
0.02 (Good)
0.02 (Good)
0.02 (Good)
0.01 (Good)
0.02 (Good)
0.02 (Good)
0.02 (Good)
0.02 (Good)
0.02 (Good)
0.03 (Good)
0.03 (Good)
0.03 (Good)
0.03 (Good)
0.02 (Good)
0.02 (Good)
0.01 (Good)
0.01 (Good)
0.02 (Good)
0.02 (Good)
0.02 (Good)
0.02 (Good)
0.03 (Good)
0.03 (Good)
0.03 (Good)
0.02 (Good)
0.02 (Good)
0.01 (Good)
0.02 (Good)
0.02 (Good)
0.02 (Good)
0.02 (Good)
0.02 (Good)
0.02 (Good)
0.03 (Good)
0.04 (Good)
0.03 (Good)
0.03 (Good)
0.02 (Good)
0.02 (Good)
0.02 (Good)
0.02 (Good)
0.02 (Good)
0.02 (Good)
0.02 (Good)
0.02 (Good)
0.03 (Good)
0.03 (Good)
0.03 (Good)
pm25
4.9 (Good)
5.2 (Good)
6.5 (Good)
5.6 (Good)
4 (Good)
6.9 (Good)
9.3 (Good)
7.4 (Good)
4.4 (Good)
5.5 (Good)
3.4 (Good)
4 (Good)
5.9 (Good)
5.4 (Good)
9.9 (Good)
9.2 (Good)
10 (Good)
7.9 (Good)
11 (Good)
11 (Good)
6.8 (Good)
23 (Moderate)
7.9 (Good)
5.5 (Good)
6.8 (Good)
6.2 (Good)
7.3 (Good)
7.4 (Good)
7.4 (Good)
13 (Good)
9.7 (Good)
9.3 (Good)
11 (Good)
10 (Good)
3.4 (Good)
2.6 (Good)
4.6 (Good)
3.1 (Good)
2.6 (Good)
3.7 (Good)
8.6 (Good)
6.4 (Good)
4.7 (Good)
4 (Good)
3.5 (Good)
3.4 (Good)
1.6 (Good)
1.9 (Good)
4.4 (Good)
4.4 (Good)
4 (Good)
data source »
Lebensqualität in Victoria
Grün und Parks in der Stadt
Victoria
83 %
Vereinigte Staaten von Amerika: 70 %
Venezuela: 41 %
Island: 72 %
Feinstaub PM2,5
Victoria
6 (Good)
Vergnügen, Zeit in der Stadt zu verbringen
Victoria
88 %
Vereinigte Staaten von Amerika: 75 %
Bahamas: 53 %
Venezuela: 41 %
Island: 89 %
Feinstaub PM10
Victoria
11 (Good)
Luftverschmutzung
Victoria
13 %
Vereinigte Staaten von Amerika: 29 %
Bahamas: 52 %
Venezuela: 59 %
Island: 13 %
Müllentsorgung
Victoria
73 %
Vereinigte Staaten von Amerika: 71 %
Bahamas: 29 %
Venezuela: 18 %
Island: 79 %
Verfügbarkeit und Qualität von Trinkwasser
Victoria
87 %
Vereinigte Staaten von Amerika: 71 %
Bahamas: 55 %
Venezuela: 28 %
Island: 96 %
Sauberkeit und Ordentlichkeit
Victoria
78 %
Vereinigte Staaten von Amerika: 60 %
Bahamas: 35 %
Venezuela: 22 %
Island: 75 %
Lärm und Lichtverschmutzung
Victoria
39 %
Vereinigte Staaten von Amerika: 47 %
Bahamas: 39 %
Venezuela: 47 %
Island: 23 %
Wasserverschmutzung
Victoria
33 %
Vereinigte Staaten von Amerika: 44 %
Bahamas: 58 %
Venezuela: 76 %
Island: 8,4 %
Source: Numbeo
Victoria Topaz
Dienstag, 30. Mai 2023, 23:00
NO2 0 (gut)
Stickstoffdioxid (NO2)
SO2 0 (gut)
Schwefeldioxid (SO2)
CO 0.1 (gut)
Kohlenmonoxid (CO)
PM2,5 2 (gut)
Feinstaub (PM2,5)
O3 0.04 (gut)
Ozon (O3)
0 (gut)
index_name_no
Victoria Topaz
index
2023-05-30
2023-05-29
2023-05-28
2023-05-27
2023-05-26
2023-05-25
2023-05-24
pm25
6.5
5.2
7.1
6.4
10
8.5
9.3
co
0.06
0.05
0.05
0.04
0.13
0.11
0.11
no2
0
0.01
0
0.01
0.01
0.01
0.01
o3
0.03
0.03
0.03
0.02
0.02
0.02
0.02
no
0
0
0
0
0.01
0
0
so2
0
0
0
0
0
0
0
Victoria Topaz
2016-03 2020-05
index
2020-05
2020-04
2020-03
2020-02
2020-01
2019-12
2019-11
2019-10
2019-09
2019-08
2019-07
2019-06
2019-05
2019-04
2019-03
2019-02
2019-01
2018-12
2018-11
2018-10
2018-09
2018-08
2018-07
2018-06
2018-05
2018-04
2018-03
2018-02
2018-01
2017-12
2017-11
2017-10
2017-09
2017-08
2017-07
2017-06
2017-05
2017-04
2017-03
2017-02
2017-01
2016-12
2016-11
2016-10
2016-09
2016-08
2016-07
2016-06
2016-05
2016-04
2016-03
pm25
4.9
5.2
6.5
5.6
4
6.9
9.3
7.4
4.4
5.5
3.4
4
5.9
5.4
9.9
9.2
10
7.9
11
11
6.8
23
7.9
5.5
6.8
6.2
7.3
7.4
7.4
13
9.7
9.3
11
10
3.4
2.6
4.6
3.1
2.6
3.7
8.6
6.4
4.7
4
3.5
3.4
1.6
1.9
4.4
4.4
4
o3:ppm
0.03
0.03
0.03
0.02
0.02
0.02
0.01
0.02
0.02
0.02
0.02
0.02
0.03
0.03
0.03
0.03
0.02
0.02
0.01
0.01
0.02
0.02
0.02
0.02
0.03
0.03
0.03
0.02
0.02
0.01
0.02
0.02
0.02
0.02
0.02
0.02
0.03
0.04
0.03
0.03
0.02
0.02
0.02
0.02
0.02
0.02
0.02
0.02
0.03
0.03
0.03
* Pollution data source:
https://openaq.org
(AirNow)
The data is licensed under CC-By 4.0
NO2 0 (gut)
SO2 0 (gut)
CO 0 (gut)
PM2,5 2 (gut)
O3 0 (gut)
0 (gut)
Daten zur Luftverschmutzung der letzten Tage in Victoria
| index | 2023-05-24 | 2023-05-25 | 2023-05-26 | 2023-05-27 | 2023-05-28 | 2023-05-29 | 2023-05-30 |
|---|---|---|---|---|---|---|---|
| pm25 | 9 Good |
8 Good |
10 Good |
6 Good |
7 Good |
5 Good |
7 Good |
| co | 0 Good |
0 Good |
0 Good |
0 Good |
0 Good |
0 Good |
0 Good |
| no2 | 0 Good |
0 Good |
0 Good |
0 Good |
0 Good |
0 Good |
0 Good |
| o3 | 0 Good |
0 Good |
0 Good |
0 Good |
0 Good |
0 Good |
0 Good |
| no | 0 Good |
0 Good |
0 Good |
0 Good |
0 Good |
0 Good |
0 Good |
| so2 | 0 Good |
0 Good |
0 Good |
0 Good |
0 Good |
0 Good |
0 Good |
| index | 2020-05 | 2020-04 | 2020-03 | 2020-02 | 2020-01 | 2019-12 | 2019-11 | 2019-10 | 2019-09 | 2019-08 | 2019-07 | 2019-06 | 2019-05 | 2019-04 | 2019-03 | 2019-02 | 2019-01 | 2018-12 | 2018-11 | 2018-10 | 2018-09 | 2018-08 | 2018-07 | 2018-06 | 2018-05 | 2018-04 | 2018-03 | 2018-02 | 2018-01 | 2017-12 | 2017-11 | 2017-10 | 2017-09 | 2017-08 | 2017-07 | 2017-06 | 2017-05 | 2017-04 | 2017-03 | 2017-02 | 2017-01 | 2016-12 | 2016-11 | 2016-10 | 2016-09 | 2016-08 | 2016-07 | 2016-06 | 2016-05 | 2016-04 | 2016-03 |
|---|---|---|---|---|---|---|---|---|---|---|---|---|---|---|---|---|---|---|---|---|---|---|---|---|---|---|---|---|---|---|---|---|---|---|---|---|---|---|---|---|---|---|---|---|---|---|---|---|---|---|---|
| o3:ppm | 0.03 (Good) | 0.03 (Good) | 0.03 (Good) | 0.02 (Good) | 0.02 (Good) | 0.02 (Good) | 0.01 (Good) | 0.02 (Good) | 0.02 (Good) | 0.02 (Good) | 0.02 (Good) | 0.02 (Good) | 0.03 (Good) | 0.03 (Good) | 0.03 (Good) | 0.03 (Good) | 0.02 (Good) | 0.02 (Good) | 0.01 (Good) | 0.01 (Good) | 0.02 (Good) | 0.02 (Good) | 0.02 (Good) | 0.02 (Good) | 0.03 (Good) | 0.03 (Good) | 0.03 (Good) | 0.02 (Good) | 0.02 (Good) | 0.01 (Good) | 0.02 (Good) | 0.02 (Good) | 0.02 (Good) | 0.02 (Good) | 0.02 (Good) | 0.02 (Good) | 0.03 (Good) | 0.04 (Good) | 0.03 (Good) | 0.03 (Good) | 0.02 (Good) | 0.02 (Good) | 0.02 (Good) | 0.02 (Good) | 0.02 (Good) | 0.02 (Good) | 0.02 (Good) | 0.02 (Good) | 0.03 (Good) | 0.03 (Good) | 0.03 (Good) |
| pm25 | 4.9 (Good) | 5.2 (Good) | 6.5 (Good) | 5.6 (Good) | 4 (Good) | 6.9 (Good) | 9.3 (Good) | 7.4 (Good) | 4.4 (Good) | 5.5 (Good) | 3.4 (Good) | 4 (Good) | 5.9 (Good) | 5.4 (Good) | 9.9 (Good) | 9.2 (Good) | 10 (Good) | 7.9 (Good) | 11 (Good) | 11 (Good) | 6.8 (Good) | 23 (Moderate) | 7.9 (Good) | 5.5 (Good) | 6.8 (Good) | 6.2 (Good) | 7.3 (Good) | 7.4 (Good) | 7.4 (Good) | 13 (Good) | 9.7 (Good) | 9.3 (Good) | 11 (Good) | 10 (Good) | 3.4 (Good) | 2.6 (Good) | 4.6 (Good) | 3.1 (Good) | 2.6 (Good) | 3.7 (Good) | 8.6 (Good) | 6.4 (Good) | 4.7 (Good) | 4 (Good) | 3.5 (Good) | 3.4 (Good) | 1.6 (Good) | 1.9 (Good) | 4.4 (Good) | 4.4 (Good) | 4 (Good) |
Grün und Parks in der Stadt
Victoria 83 %
Vereinigte Staaten von Amerika: 70 % Venezuela: 41 % Island: 72 %Feinstaub PM2,5
Victoria 6 (Good)
Vergnügen, Zeit in der Stadt zu verbringen
Victoria 88 %
Vereinigte Staaten von Amerika: 75 % Bahamas: 53 % Venezuela: 41 % Island: 89 %Feinstaub PM10
Victoria 11 (Good)
Luftverschmutzung
Victoria 13 %
Vereinigte Staaten von Amerika: 29 % Bahamas: 52 % Venezuela: 59 % Island: 13 %Müllentsorgung
Victoria 73 %
Vereinigte Staaten von Amerika: 71 % Bahamas: 29 % Venezuela: 18 % Island: 79 %Verfügbarkeit und Qualität von Trinkwasser
Victoria 87 %
Vereinigte Staaten von Amerika: 71 % Bahamas: 55 % Venezuela: 28 % Island: 96 %Sauberkeit und Ordentlichkeit
Victoria 78 %
Vereinigte Staaten von Amerika: 60 % Bahamas: 35 % Venezuela: 22 % Island: 75 %Lärm und Lichtverschmutzung
Victoria 39 %
Vereinigte Staaten von Amerika: 47 % Bahamas: 39 % Venezuela: 47 % Island: 23 %Wasserverschmutzung
Victoria 33 %
Vereinigte Staaten von Amerika: 44 % Bahamas: 58 % Venezuela: 76 % Island: 8,4 %NO2 0 (gut)
Stickstoffdioxid (NO2)SO2 0 (gut)
Schwefeldioxid (SO2)CO 0.1 (gut)
Kohlenmonoxid (CO)PM2,5 2 (gut)
Feinstaub (PM2,5)O3 0.04 (gut)
Ozon (O3)0 (gut)
index_name_noVictoria Topaz
| index | 2023-05-30 | 2023-05-29 | 2023-05-28 | 2023-05-27 | 2023-05-26 | 2023-05-25 | 2023-05-24 |
|---|---|---|---|---|---|---|---|
| pm25 | 6.5 | 5.2 | 7.1 | 6.4 | 10 | 8.5 | 9.3 |
| co | 0.06 | 0.05 | 0.05 | 0.04 | 0.13 | 0.11 | 0.11 |
| no2 | 0 | 0.01 | 0 | 0.01 | 0.01 | 0.01 | 0.01 |
| o3 | 0.03 | 0.03 | 0.03 | 0.02 | 0.02 | 0.02 | 0.02 |
| no | 0 | 0 | 0 | 0 | 0.01 | 0 | 0 |
| so2 | 0 | 0 | 0 | 0 | 0 | 0 | 0 |
Victoria Topaz

| index | 2020-05 | 2020-04 | 2020-03 | 2020-02 | 2020-01 | 2019-12 | 2019-11 | 2019-10 | 2019-09 | 2019-08 | 2019-07 | 2019-06 | 2019-05 | 2019-04 | 2019-03 | 2019-02 | 2019-01 | 2018-12 | 2018-11 | 2018-10 | 2018-09 | 2018-08 | 2018-07 | 2018-06 | 2018-05 | 2018-04 | 2018-03 | 2018-02 | 2018-01 | 2017-12 | 2017-11 | 2017-10 | 2017-09 | 2017-08 | 2017-07 | 2017-06 | 2017-05 | 2017-04 | 2017-03 | 2017-02 | 2017-01 | 2016-12 | 2016-11 | 2016-10 | 2016-09 | 2016-08 | 2016-07 | 2016-06 | 2016-05 | 2016-04 | 2016-03 |
|---|---|---|---|---|---|---|---|---|---|---|---|---|---|---|---|---|---|---|---|---|---|---|---|---|---|---|---|---|---|---|---|---|---|---|---|---|---|---|---|---|---|---|---|---|---|---|---|---|---|---|---|
| pm25 | 4.9 | 5.2 | 6.5 | 5.6 | 4 | 6.9 | 9.3 | 7.4 | 4.4 | 5.5 | 3.4 | 4 | 5.9 | 5.4 | 9.9 | 9.2 | 10 | 7.9 | 11 | 11 | 6.8 | 23 | 7.9 | 5.5 | 6.8 | 6.2 | 7.3 | 7.4 | 7.4 | 13 | 9.7 | 9.3 | 11 | 10 | 3.4 | 2.6 | 4.6 | 3.1 | 2.6 | 3.7 | 8.6 | 6.4 | 4.7 | 4 | 3.5 | 3.4 | 1.6 | 1.9 | 4.4 | 4.4 | 4 |
| o3:ppm | 0.03 | 0.03 | 0.03 | 0.02 | 0.02 | 0.02 | 0.01 | 0.02 | 0.02 | 0.02 | 0.02 | 0.02 | 0.03 | 0.03 | 0.03 | 0.03 | 0.02 | 0.02 | 0.01 | 0.01 | 0.02 | 0.02 | 0.02 | 0.02 | 0.03 | 0.03 | 0.03 | 0.02 | 0.02 | 0.01 | 0.02 | 0.02 | 0.02 | 0.02 | 0.02 | 0.02 | 0.03 | 0.04 | 0.03 | 0.03 | 0.02 | 0.02 | 0.02 | 0.02 | 0.02 | 0.02 | 0.02 | 0.02 | 0.03 | 0.03 | 0.03 |