Luftverschmutzung in Qileya: Echtzeit-Luft-Qualitätsindex und Smog-Alarm.
Für die Qileya. Heute ist Donnerstag, 4. Juni 2026. Für Qileya wurden folgende Luftverschmutzungswerte gemessen:- Feinstaub (PM2,5) - 61 (ungesund)
- Stickstoffdioxid (NO2) - 22 (gut)
- Feinstaub (PM10) Schwebestaub - 69 (Ungesund für sensible Gruppen)
- Kohlenmonoxid (CO) - 219 (gut)
- Ozon (O3) - 0 (gut)
- Schwefeldioxid (SO2) - 8 (gut)

Wie ist die Luftqualität Qileya heute? Ist die Luft in Qileya? verschmutzt. Gibt es Smog?
Wie hoch ist der aktuelle PM2,5-Wert in Qileya? (Feinstaub (PM2,5))
Die heutige PM2.5-Stufe ist:
61 (ungesund)
Zum Vergleich: Der höchste PM2,5-Wert in Qileya in den letzten 7 Tagen war: 28 (Freitag, 27. Mai 2022) und der niedrigste: 28 (Freitag, 27. Mai 2022).
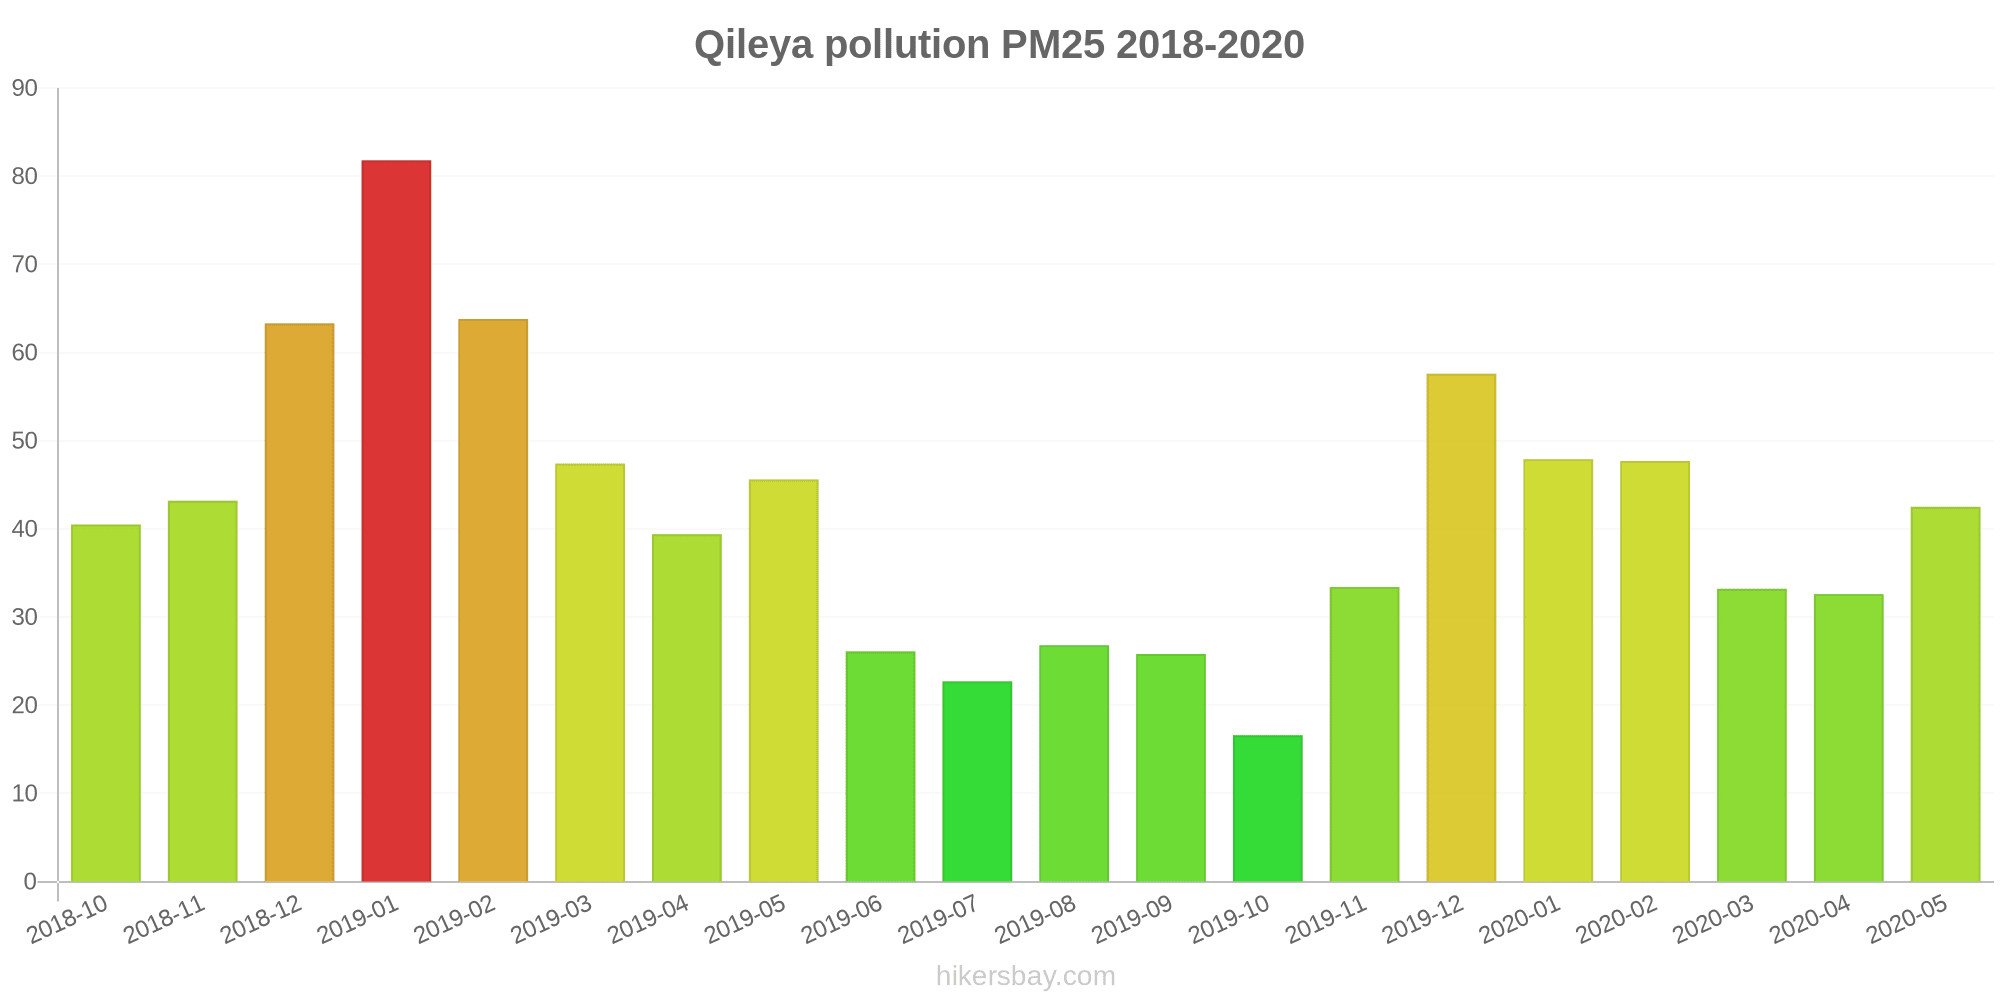
Die höchsten PM2,5-Werte wurden gemessen: 82 (Januar 2019).
Die niedrigste Feinstaubbelastung PM2,5 tritt im Monat auf: Oktober (17).
Wie hoch ist das NO2-Niveau? (Stickstoffdioxid (NO2))
22 (gut)
Wie hoch ist der PM10-Stand heute in Qileya? (Feinstaub (PM10) Schwebestaub)
Der aktuelle Feinstaubgehalt PM10 in Qileya is:
69 (Ungesund für sensible Gruppen)
Die höchsten PM10-Werte treten in der Regel im Monat auf: 97 (Januar 2019).
Der niedrigste Wert der Feinstaub-PM10-Belastung in Qileya ist in der Regel in: Oktober (26).
Wie hoch ist der CO-Gehalt? (Kohlenmonoxid (CO))
219 (gut)
Wie ist das O3-Niveau heute in Qileya? (Ozon (O3))
0 (gut)
Wie hoch ist die SO2-Belastung? (Schwefeldioxid (SO2))
8 (gut)
Aktuelle Daten Freitag, 27. Mai 2022, 15:00
PM2,5 61 (ungesund)
NO2 22 (gut)
PM10 69 (Ungesund für sensible Gruppen)
CO 219 (gut)
O3 0 (gut)
SO2 8 (gut)
Daten zur Luftverschmutzung der letzten Tage in Qileya
index
2022-05-27
pm25
28
Moderate
no2
22
Good
pm10
35
Moderate
co
579
Good
o3
22
Good
so2
5
Good
data source »
Luftverschmutzung in Qileya von Oktober 2018 bis Mai 2020

index
2020-05
2020-04
2020-03
2020-02
2020-01
2019-12
2019-11
2019-10
2019-09
2019-08
2019-07
2019-06
2019-05
2019-04
2019-03
2019-02
2019-01
2018-12
2018-11
2018-10
pm25
43 (Unhealthy for Sensitive Groups)
33 (Moderate)
33 (Moderate)
48 (Unhealthy for Sensitive Groups)
48 (Unhealthy for Sensitive Groups)
58 (Unhealthy)
33 (Moderate)
17 (Moderate)
26 (Moderate)
27 (Moderate)
23 (Moderate)
26 (Moderate)
46 (Unhealthy for Sensitive Groups)
39 (Unhealthy for Sensitive Groups)
47 (Unhealthy for Sensitive Groups)
64 (Unhealthy)
82 (Very Unhealthy)
63 (Unhealthy)
43 (Unhealthy for Sensitive Groups)
41 (Unhealthy for Sensitive Groups)
co
732 (Good)
629 (Good)
584 (Good)
762 (Good)
919 (Good)
742 (Good)
711 (Good)
790 (Good)
876 (Good)
682 (Good)
661 (Good)
870 (Good)
815 (Good)
807 (Good)
762 (Good)
989 (Good)
1 (Good)
981 (Good)
759 (Good)
853 (Good)
no2
16 (Good)
15 (Good)
14 (Good)
16 (Good)
21 (Good)
23 (Good)
22 (Good)
19 (Good)
14 (Good)
22 (Good)
21 (Good)
19 (Good)
13 (Good)
13 (Good)
15 (Good)
14 (Good)
25 (Good)
16 (Good)
15 (Good)
21 (Good)
o3
165 (Unhealthy)
129 (Unhealthy for Sensitive Groups)
113 (Moderate)
73 (Moderate)
67 (Good)
75 (Moderate)
64 (Good)
72 (Moderate)
98 (Moderate)
134 (Unhealthy for Sensitive Groups)
102 (Moderate)
121 (Unhealthy for Sensitive Groups)
130 (Unhealthy for Sensitive Groups)
126 (Unhealthy for Sensitive Groups)
98 (Moderate)
79 (Moderate)
50 (Good)
60 (Good)
79 (Moderate)
71 (Moderate)
pm10
66 (Unhealthy for Sensitive Groups)
46 (Moderate)
46 (Moderate)
65 (Unhealthy for Sensitive Groups)
64 (Unhealthy for Sensitive Groups)
75 (Unhealthy for Sensitive Groups)
54 (Unhealthy for Sensitive Groups)
26 (Moderate)
38 (Moderate)
44 (Moderate)
31 (Moderate)
34 (Moderate)
61 (Unhealthy for Sensitive Groups)
46 (Moderate)
60 (Unhealthy for Sensitive Groups)
76 (Unhealthy for Sensitive Groups)
97 (Unhealthy)
88 (Unhealthy)
68 (Unhealthy for Sensitive Groups)
63 (Unhealthy for Sensitive Groups)
so2
3.4 (Good)
3.5 (Good)
5.7 (Good)
7.5 (Good)
5.7 (Good)
6.4 (Good)
3.6 (Good)
5.8 (Good)
3.4 (Good)
4.6 (Good)
4.5 (Good)
5.8 (Good)
4.7 (Good)
4.6 (Good)
4.3 (Good)
3.7 (Good)
4.8 (Good)
5.1 (Good)
5 (Good)
7.2 (Good)
data source »
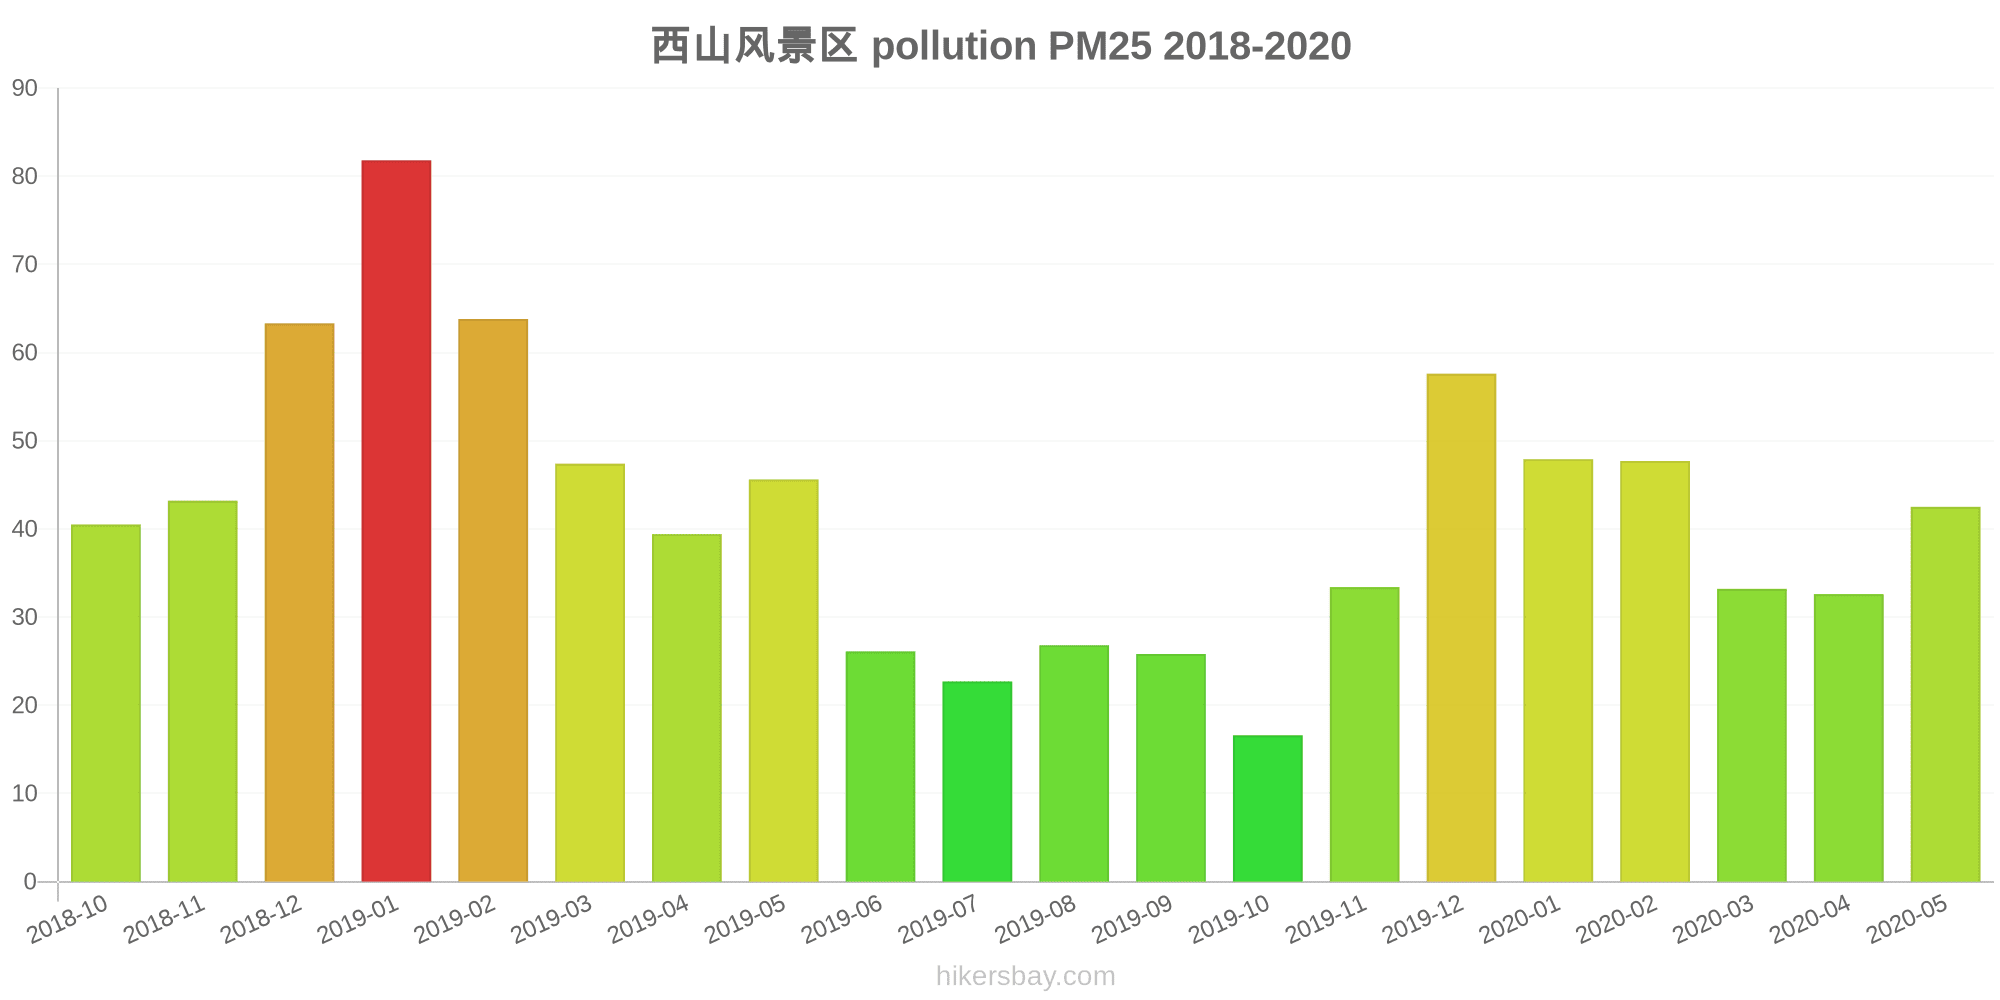
西山风景区
Freitag, 27. Mai 2022, 15:00
PM2,5 61 (ungesund)
Feinstaub (PM2,5)
NO2 22 (gut)
Stickstoffdioxid (NO2)
PM10 69 (Ungesund für sensible Gruppen)
Feinstaub (PM10) Schwebestaub
CO 219 (gut)
Kohlenmonoxid (CO)
O3 0.05 (gut)
Ozon (O3)
SO2 7.7 (gut)
Schwefeldioxid (SO2)
西山风景区
index
2022-05-27
pm25
28
no2
22
pm10
35
co
579
o3
22
so2
4.6
西山风景区
2018-10 2020-05

index
2020-05
2020-04
2020-03
2020-02
2020-01
2019-12
2019-11
2019-10
2019-09
2019-08
2019-07
2019-06
2019-05
2019-04
2019-03
2019-02
2019-01
2018-12
2018-11
2018-10
pm25
43
33
33
48
48
58
33
17
26
27
23
26
46
39
47
64
82
63
43
41
co
732
629
584
762
919
742
711
790
876
682
661
870
815
807
762
989
1
981
759
853
no2
16
15
14
16
21
23
22
19
14
22
21
19
13
13
15
14
25
16
15
21
o3
165
129
113
73
67
75
64
72
98
134
102
121
130
126
98
79
50
60
79
71
pm10
66
46
46
65
64
75
54
26
38
44
31
34
61
46
60
76
97
88
68
63
so2
3.4
3.5
5.7
7.5
5.7
6.4
3.6
5.8
3.4
4.6
4.5
5.8
4.7
4.6
4.3
3.7
4.8
5.1
5
7.2
* Pollution data source:
https://openaq.org
(ChinaAQIData)
The data is licensed under CC-By 4.0
PM2,5 61 (ungesund)
NO2 22 (gut)
PM10 69 (Ungesund für sensible Gruppen)
CO 219 (gut)
O3 0 (gut)
SO2 8 (gut)
Daten zur Luftverschmutzung der letzten Tage in Qileya
| index | 2022-05-27 |
|---|---|
| pm25 | 28 Moderate |
| no2 | 22 Good |
| pm10 | 35 Moderate |
| co | 579 Good |
| o3 | 22 Good |
| so2 | 5 Good |
| index | 2020-05 | 2020-04 | 2020-03 | 2020-02 | 2020-01 | 2019-12 | 2019-11 | 2019-10 | 2019-09 | 2019-08 | 2019-07 | 2019-06 | 2019-05 | 2019-04 | 2019-03 | 2019-02 | 2019-01 | 2018-12 | 2018-11 | 2018-10 |
|---|---|---|---|---|---|---|---|---|---|---|---|---|---|---|---|---|---|---|---|---|
| pm25 | 43 (Unhealthy for Sensitive Groups) | 33 (Moderate) | 33 (Moderate) | 48 (Unhealthy for Sensitive Groups) | 48 (Unhealthy for Sensitive Groups) | 58 (Unhealthy) | 33 (Moderate) | 17 (Moderate) | 26 (Moderate) | 27 (Moderate) | 23 (Moderate) | 26 (Moderate) | 46 (Unhealthy for Sensitive Groups) | 39 (Unhealthy for Sensitive Groups) | 47 (Unhealthy for Sensitive Groups) | 64 (Unhealthy) | 82 (Very Unhealthy) | 63 (Unhealthy) | 43 (Unhealthy for Sensitive Groups) | 41 (Unhealthy for Sensitive Groups) |
| co | 732 (Good) | 629 (Good) | 584 (Good) | 762 (Good) | 919 (Good) | 742 (Good) | 711 (Good) | 790 (Good) | 876 (Good) | 682 (Good) | 661 (Good) | 870 (Good) | 815 (Good) | 807 (Good) | 762 (Good) | 989 (Good) | 1 (Good) | 981 (Good) | 759 (Good) | 853 (Good) |
| no2 | 16 (Good) | 15 (Good) | 14 (Good) | 16 (Good) | 21 (Good) | 23 (Good) | 22 (Good) | 19 (Good) | 14 (Good) | 22 (Good) | 21 (Good) | 19 (Good) | 13 (Good) | 13 (Good) | 15 (Good) | 14 (Good) | 25 (Good) | 16 (Good) | 15 (Good) | 21 (Good) |
| o3 | 165 (Unhealthy) | 129 (Unhealthy for Sensitive Groups) | 113 (Moderate) | 73 (Moderate) | 67 (Good) | 75 (Moderate) | 64 (Good) | 72 (Moderate) | 98 (Moderate) | 134 (Unhealthy for Sensitive Groups) | 102 (Moderate) | 121 (Unhealthy for Sensitive Groups) | 130 (Unhealthy for Sensitive Groups) | 126 (Unhealthy for Sensitive Groups) | 98 (Moderate) | 79 (Moderate) | 50 (Good) | 60 (Good) | 79 (Moderate) | 71 (Moderate) |
| pm10 | 66 (Unhealthy for Sensitive Groups) | 46 (Moderate) | 46 (Moderate) | 65 (Unhealthy for Sensitive Groups) | 64 (Unhealthy for Sensitive Groups) | 75 (Unhealthy for Sensitive Groups) | 54 (Unhealthy for Sensitive Groups) | 26 (Moderate) | 38 (Moderate) | 44 (Moderate) | 31 (Moderate) | 34 (Moderate) | 61 (Unhealthy for Sensitive Groups) | 46 (Moderate) | 60 (Unhealthy for Sensitive Groups) | 76 (Unhealthy for Sensitive Groups) | 97 (Unhealthy) | 88 (Unhealthy) | 68 (Unhealthy for Sensitive Groups) | 63 (Unhealthy for Sensitive Groups) |
| so2 | 3.4 (Good) | 3.5 (Good) | 5.7 (Good) | 7.5 (Good) | 5.7 (Good) | 6.4 (Good) | 3.6 (Good) | 5.8 (Good) | 3.4 (Good) | 4.6 (Good) | 4.5 (Good) | 5.8 (Good) | 4.7 (Good) | 4.6 (Good) | 4.3 (Good) | 3.7 (Good) | 4.8 (Good) | 5.1 (Good) | 5 (Good) | 7.2 (Good) |
PM2,5 61 (ungesund)
Feinstaub (PM2,5)NO2 22 (gut)
Stickstoffdioxid (NO2)PM10 69 (Ungesund für sensible Gruppen)
Feinstaub (PM10) SchwebestaubCO 219 (gut)
Kohlenmonoxid (CO)O3 0.05 (gut)
Ozon (O3)SO2 7.7 (gut)
Schwefeldioxid (SO2)西山风景区
| index | 2022-05-27 |
|---|---|
| pm25 | 28 |
| no2 | 22 |
| pm10 | 35 |
| co | 579 |
| o3 | 22 |
| so2 | 4.6 |
西山风景区
| index | 2020-05 | 2020-04 | 2020-03 | 2020-02 | 2020-01 | 2019-12 | 2019-11 | 2019-10 | 2019-09 | 2019-08 | 2019-07 | 2019-06 | 2019-05 | 2019-04 | 2019-03 | 2019-02 | 2019-01 | 2018-12 | 2018-11 | 2018-10 |
|---|---|---|---|---|---|---|---|---|---|---|---|---|---|---|---|---|---|---|---|---|
| pm25 | 43 | 33 | 33 | 48 | 48 | 58 | 33 | 17 | 26 | 27 | 23 | 26 | 46 | 39 | 47 | 64 | 82 | 63 | 43 | 41 |
| co | 732 | 629 | 584 | 762 | 919 | 742 | 711 | 790 | 876 | 682 | 661 | 870 | 815 | 807 | 762 | 989 | 1 | 981 | 759 | 853 |
| no2 | 16 | 15 | 14 | 16 | 21 | 23 | 22 | 19 | 14 | 22 | 21 | 19 | 13 | 13 | 15 | 14 | 25 | 16 | 15 | 21 |
| o3 | 165 | 129 | 113 | 73 | 67 | 75 | 64 | 72 | 98 | 134 | 102 | 121 | 130 | 126 | 98 | 79 | 50 | 60 | 79 | 71 |
| pm10 | 66 | 46 | 46 | 65 | 64 | 75 | 54 | 26 | 38 | 44 | 31 | 34 | 61 | 46 | 60 | 76 | 97 | 88 | 68 | 63 |
| so2 | 3.4 | 3.5 | 5.7 | 7.5 | 5.7 | 6.4 | 3.6 | 5.8 | 3.4 | 4.6 | 4.5 | 5.8 | 4.7 | 4.6 | 4.3 | 3.7 | 4.8 | 5.1 | 5 | 7.2 |