Luftverschmutzung in Zhangqiwan: Echtzeit-Luft-Qualitätsindex und Smog-Alarm.
Für die Zhangqiwan. Heute ist Samstag, 13. Juni 2026. Für Zhangqiwan wurden folgende Luftverschmutzungswerte gemessen:- Feinstaub (PM2,5) - 61 (ungesund)
- Stickstoffdioxid (NO2) - 22 (gut)
- Feinstaub (PM10) Schwebestaub - 69 (Ungesund für sensible Gruppen)
- Kohlenmonoxid (CO) - 219 (gut)
- Ozon (O3) - 0 (gut)
- Schwefeldioxid (SO2) - 8 (gut)

Wie ist die Luftqualität Zhangqiwan heute? Ist die Luft in Zhangqiwan? verschmutzt. Gibt es Smog?
Wie hoch ist der aktuelle PM2,5-Wert in Zhangqiwan? (Feinstaub (PM2,5))
Die heutige PM2.5-Stufe ist:
61 (ungesund)
Zum Vergleich: Der höchste PM2,5-Wert in Zhangqiwan in den letzten 7 Tagen war: 28 (Freitag, 27. Mai 2022) und der niedrigste: 28 (Freitag, 27. Mai 2022).
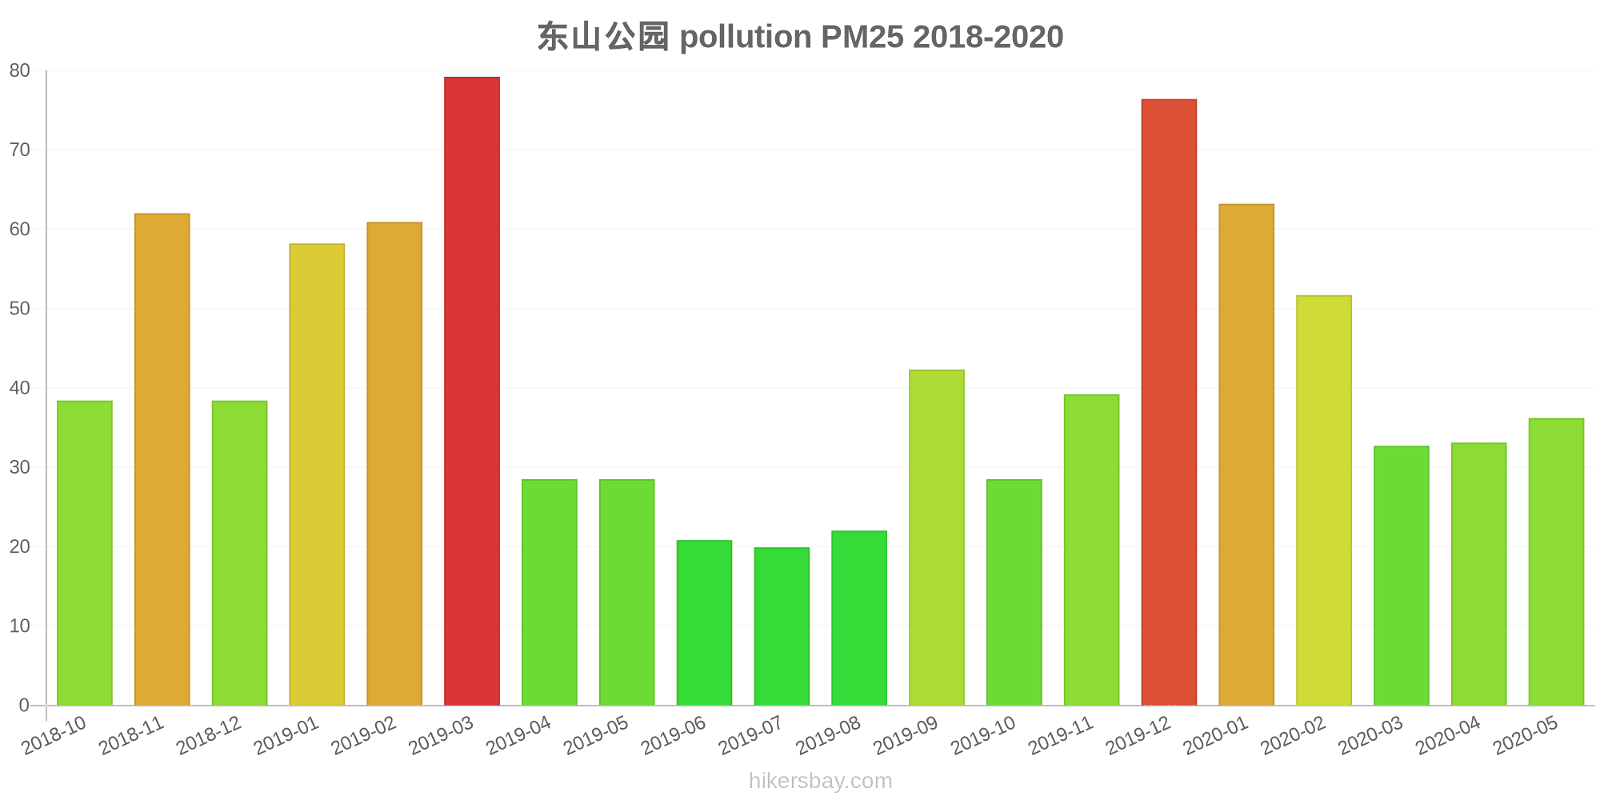
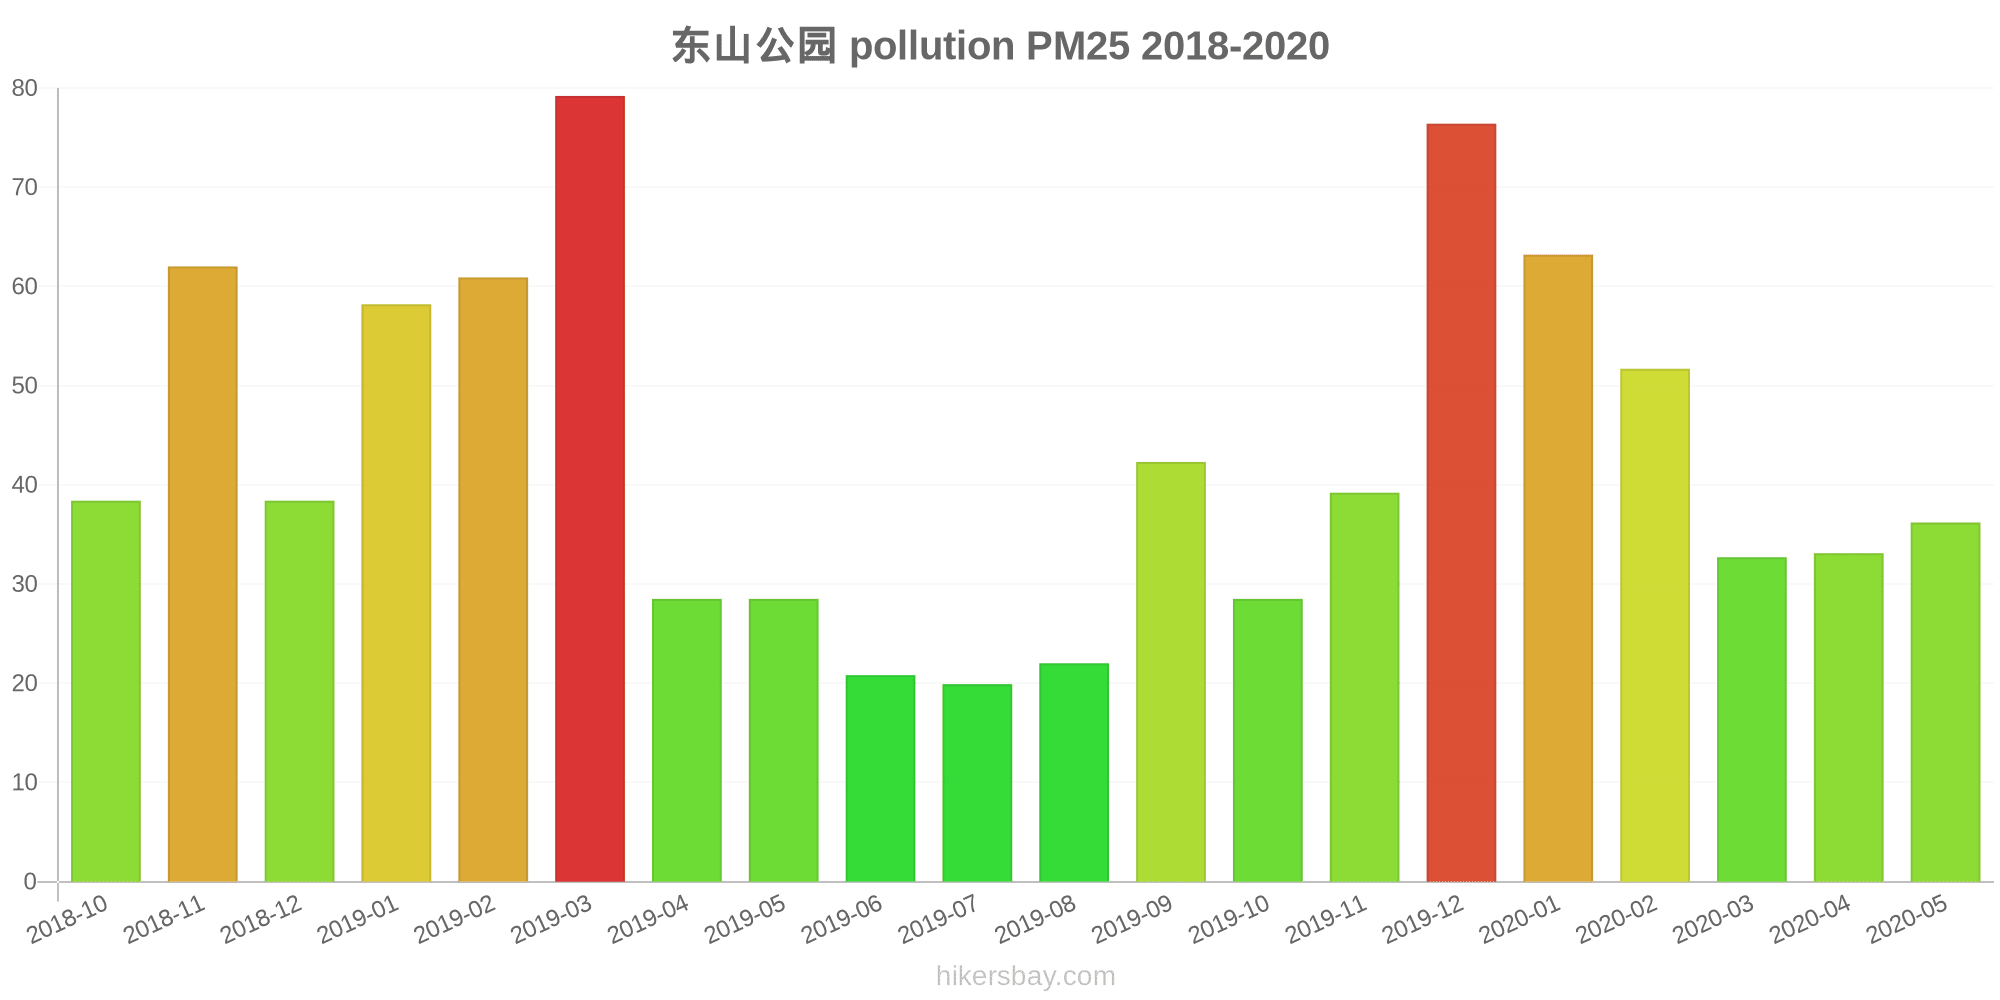
Die höchsten PM2,5-Werte wurden gemessen: 79 (März 2019).
Die niedrigste Feinstaubbelastung PM2,5 tritt im Monat auf: Juli (20).
Wie hoch ist das NO2-Niveau? (Stickstoffdioxid (NO2))
22 (gut)
Wie hoch ist der PM10-Stand heute in Zhangqiwan? (Feinstaub (PM10) Schwebestaub)
Der aktuelle Feinstaubgehalt PM10 in Zhangqiwan is:
69 (Ungesund für sensible Gruppen)
Die höchsten PM10-Werte treten in der Regel im Monat auf: 103 (März 2019).
Der niedrigste Wert der Feinstaub-PM10-Belastung in Zhangqiwan ist in der Regel in: Juni (31).
Wie hoch ist der CO-Gehalt? (Kohlenmonoxid (CO))
219 (gut)
Wie ist das O3-Niveau heute in Zhangqiwan? (Ozon (O3))
0 (gut)
Wie hoch ist die SO2-Belastung? (Schwefeldioxid (SO2))
8 (gut)
Aktuelle Daten Freitag, 27. Mai 2022, 15:00
PM2,5 61 (ungesund)
NO2 22 (gut)
PM10 69 (Ungesund für sensible Gruppen)
CO 219 (gut)
O3 0 (gut)
SO2 8 (gut)
Daten zur Luftverschmutzung der letzten Tage in Zhangqiwan
index
2022-05-27
pm25
28
Moderate
no2
22
Good
pm10
35
Moderate
co
579
Good
o3
22
Good
so2
5
Good
data source »
Luftverschmutzung in Zhangqiwan von Oktober 2018 bis Mai 2020

index
2020-05
2020-04
2020-03
2020-02
2020-01
2019-12
2019-11
2019-10
2019-09
2019-08
2019-07
2019-06
2019-05
2019-04
2019-03
2019-02
2019-01
2018-12
2018-11
2018-10
pm25
36 (Unhealthy for Sensitive Groups)
33 (Moderate)
33 (Moderate)
52 (Unhealthy for Sensitive Groups)
63 (Unhealthy)
76 (Very Unhealthy)
39 (Unhealthy for Sensitive Groups)
29 (Moderate)
42 (Unhealthy for Sensitive Groups)
22 (Moderate)
20 (Moderate)
21 (Moderate)
29 (Moderate)
29 (Moderate)
79 (Very Unhealthy)
61 (Unhealthy)
58 (Unhealthy)
38 (Unhealthy for Sensitive Groups)
62 (Unhealthy)
38 (Unhealthy for Sensitive Groups)
co
619 (Good)
586 (Good)
554 (Good)
680 (Good)
936 (Good)
860 (Good)
623 (Good)
667 (Good)
817 (Good)
530 (Good)
620 (Good)
592 (Good)
586 (Good)
623 (Good)
972 (Good)
994 (Good)
1 (Good)
712 (Good)
826 (Good)
524 (Good)
no2
29 (Good)
26 (Good)
27 (Good)
15 (Good)
28 (Good)
39 (Good)
30 (Good)
18 (Good)
12 (Good)
9.8 (Good)
18 (Good)
14 (Good)
16 (Good)
22 (Good)
35 (Good)
32 (Good)
41 (Moderate)
30 (Good)
36 (Good)
25 (Good)
o3
169 (Unhealthy)
132 (Unhealthy for Sensitive Groups)
108 (Moderate)
92 (Moderate)
73 (Moderate)
65 (Good)
70 (Moderate)
94 (Moderate)
121 (Unhealthy for Sensitive Groups)
96 (Moderate)
124 (Unhealthy for Sensitive Groups)
129 (Unhealthy for Sensitive Groups)
125 (Unhealthy for Sensitive Groups)
134 (Unhealthy for Sensitive Groups)
110 (Moderate)
93 (Moderate)
74 (Moderate)
58 (Good)
67 (Good)
77 (Moderate)
pm10
78 (Unhealthy for Sensitive Groups)
63 (Unhealthy for Sensitive Groups)
67 (Unhealthy for Sensitive Groups)
74 (Unhealthy for Sensitive Groups)
79 (Unhealthy for Sensitive Groups)
100 (Unhealthy)
64 (Unhealthy for Sensitive Groups)
50 (Unhealthy for Sensitive Groups)
58 (Unhealthy for Sensitive Groups)
32 (Moderate)
34 (Moderate)
31 (Moderate)
55 (Unhealthy for Sensitive Groups)
59 (Unhealthy for Sensitive Groups)
103 (Unhealthy)
89 (Unhealthy)
87 (Unhealthy)
60 (Unhealthy for Sensitive Groups)
94 (Unhealthy)
56 (Unhealthy for Sensitive Groups)
so2
9.9 (Good)
6.9 (Good)
7 (Good)
4.5 (Good)
4.7 (Good)
6.1 (Good)
4.7 (Good)
5.7 (Good)
8.2 (Good)
4.6 (Good)
3.7 (Good)
4.3 (Good)
5.8 (Good)
9.5 (Good)
21 (Good)
35 (Good)
36 (Good)
22 (Good)
21 (Good)
8.4 (Good)
data source »
东山公园
Freitag, 27. Mai 2022, 15:00
PM2,5 61 (ungesund)
Feinstaub (PM2,5)
NO2 22 (gut)
Stickstoffdioxid (NO2)
PM10 69 (Ungesund für sensible Gruppen)
Feinstaub (PM10) Schwebestaub
CO 219 (gut)
Kohlenmonoxid (CO)
O3 0.05 (gut)
Ozon (O3)
SO2 7.7 (gut)
Schwefeldioxid (SO2)
东山公园
index
2022-05-27
pm25
28
no2
22
pm10
35
co
579
o3
22
so2
4.6
东山公园
2018-10 2020-05
index
2020-05
2020-04
2020-03
2020-02
2020-01
2019-12
2019-11
2019-10
2019-09
2019-08
2019-07
2019-06
2019-05
2019-04
2019-03
2019-02
2019-01
2018-12
2018-11
2018-10
pm25
36
33
33
52
63
76
39
29
42
22
20
21
29
29
79
61
58
38
62
38
co
619
586
554
680
936
860
623
667
817
530
620
592
586
623
972
994
1
712
826
524
no2
29
26
27
15
28
39
30
18
12
9.8
18
14
16
22
35
32
41
30
36
25
o3
169
132
108
92
73
65
70
94
121
96
124
129
125
134
110
93
74
58
67
77
pm10
78
63
67
74
79
100
64
50
58
32
34
31
55
59
103
89
87
60
94
56
so2
9.9
6.9
7
4.5
4.7
6.1
4.7
5.7
8.2
4.6
3.7
4.3
5.8
9.5
21
35
36
22
21
8.4
* Pollution data source:
https://openaq.org
(ChinaAQIData)
The data is licensed under CC-By 4.0
PM2,5 61 (ungesund)
NO2 22 (gut)
PM10 69 (Ungesund für sensible Gruppen)
CO 219 (gut)
O3 0 (gut)
SO2 8 (gut)
Daten zur Luftverschmutzung der letzten Tage in Zhangqiwan
| index | 2022-05-27 |
|---|---|
| pm25 | 28 Moderate |
| no2 | 22 Good |
| pm10 | 35 Moderate |
| co | 579 Good |
| o3 | 22 Good |
| so2 | 5 Good |

| index | 2020-05 | 2020-04 | 2020-03 | 2020-02 | 2020-01 | 2019-12 | 2019-11 | 2019-10 | 2019-09 | 2019-08 | 2019-07 | 2019-06 | 2019-05 | 2019-04 | 2019-03 | 2019-02 | 2019-01 | 2018-12 | 2018-11 | 2018-10 |
|---|---|---|---|---|---|---|---|---|---|---|---|---|---|---|---|---|---|---|---|---|
| pm25 | 36 (Unhealthy for Sensitive Groups) | 33 (Moderate) | 33 (Moderate) | 52 (Unhealthy for Sensitive Groups) | 63 (Unhealthy) | 76 (Very Unhealthy) | 39 (Unhealthy for Sensitive Groups) | 29 (Moderate) | 42 (Unhealthy for Sensitive Groups) | 22 (Moderate) | 20 (Moderate) | 21 (Moderate) | 29 (Moderate) | 29 (Moderate) | 79 (Very Unhealthy) | 61 (Unhealthy) | 58 (Unhealthy) | 38 (Unhealthy for Sensitive Groups) | 62 (Unhealthy) | 38 (Unhealthy for Sensitive Groups) |
| co | 619 (Good) | 586 (Good) | 554 (Good) | 680 (Good) | 936 (Good) | 860 (Good) | 623 (Good) | 667 (Good) | 817 (Good) | 530 (Good) | 620 (Good) | 592 (Good) | 586 (Good) | 623 (Good) | 972 (Good) | 994 (Good) | 1 (Good) | 712 (Good) | 826 (Good) | 524 (Good) |
| no2 | 29 (Good) | 26 (Good) | 27 (Good) | 15 (Good) | 28 (Good) | 39 (Good) | 30 (Good) | 18 (Good) | 12 (Good) | 9.8 (Good) | 18 (Good) | 14 (Good) | 16 (Good) | 22 (Good) | 35 (Good) | 32 (Good) | 41 (Moderate) | 30 (Good) | 36 (Good) | 25 (Good) |
| o3 | 169 (Unhealthy) | 132 (Unhealthy for Sensitive Groups) | 108 (Moderate) | 92 (Moderate) | 73 (Moderate) | 65 (Good) | 70 (Moderate) | 94 (Moderate) | 121 (Unhealthy for Sensitive Groups) | 96 (Moderate) | 124 (Unhealthy for Sensitive Groups) | 129 (Unhealthy for Sensitive Groups) | 125 (Unhealthy for Sensitive Groups) | 134 (Unhealthy for Sensitive Groups) | 110 (Moderate) | 93 (Moderate) | 74 (Moderate) | 58 (Good) | 67 (Good) | 77 (Moderate) |
| pm10 | 78 (Unhealthy for Sensitive Groups) | 63 (Unhealthy for Sensitive Groups) | 67 (Unhealthy for Sensitive Groups) | 74 (Unhealthy for Sensitive Groups) | 79 (Unhealthy for Sensitive Groups) | 100 (Unhealthy) | 64 (Unhealthy for Sensitive Groups) | 50 (Unhealthy for Sensitive Groups) | 58 (Unhealthy for Sensitive Groups) | 32 (Moderate) | 34 (Moderate) | 31 (Moderate) | 55 (Unhealthy for Sensitive Groups) | 59 (Unhealthy for Sensitive Groups) | 103 (Unhealthy) | 89 (Unhealthy) | 87 (Unhealthy) | 60 (Unhealthy for Sensitive Groups) | 94 (Unhealthy) | 56 (Unhealthy for Sensitive Groups) |
| so2 | 9.9 (Good) | 6.9 (Good) | 7 (Good) | 4.5 (Good) | 4.7 (Good) | 6.1 (Good) | 4.7 (Good) | 5.7 (Good) | 8.2 (Good) | 4.6 (Good) | 3.7 (Good) | 4.3 (Good) | 5.8 (Good) | 9.5 (Good) | 21 (Good) | 35 (Good) | 36 (Good) | 22 (Good) | 21 (Good) | 8.4 (Good) |
PM2,5 61 (ungesund)
Feinstaub (PM2,5)NO2 22 (gut)
Stickstoffdioxid (NO2)PM10 69 (Ungesund für sensible Gruppen)
Feinstaub (PM10) SchwebestaubCO 219 (gut)
Kohlenmonoxid (CO)O3 0.05 (gut)
Ozon (O3)SO2 7.7 (gut)
Schwefeldioxid (SO2)东山公园
| index | 2022-05-27 |
|---|---|
| pm25 | 28 |
| no2 | 22 |
| pm10 | 35 |
| co | 579 |
| o3 | 22 |
| so2 | 4.6 |
东山公园
| index | 2020-05 | 2020-04 | 2020-03 | 2020-02 | 2020-01 | 2019-12 | 2019-11 | 2019-10 | 2019-09 | 2019-08 | 2019-07 | 2019-06 | 2019-05 | 2019-04 | 2019-03 | 2019-02 | 2019-01 | 2018-12 | 2018-11 | 2018-10 |
|---|---|---|---|---|---|---|---|---|---|---|---|---|---|---|---|---|---|---|---|---|
| pm25 | 36 | 33 | 33 | 52 | 63 | 76 | 39 | 29 | 42 | 22 | 20 | 21 | 29 | 29 | 79 | 61 | 58 | 38 | 62 | 38 |
| co | 619 | 586 | 554 | 680 | 936 | 860 | 623 | 667 | 817 | 530 | 620 | 592 | 586 | 623 | 972 | 994 | 1 | 712 | 826 | 524 |
| no2 | 29 | 26 | 27 | 15 | 28 | 39 | 30 | 18 | 12 | 9.8 | 18 | 14 | 16 | 22 | 35 | 32 | 41 | 30 | 36 | 25 |
| o3 | 169 | 132 | 108 | 92 | 73 | 65 | 70 | 94 | 121 | 96 | 124 | 129 | 125 | 134 | 110 | 93 | 74 | 58 | 67 | 77 |
| pm10 | 78 | 63 | 67 | 74 | 79 | 100 | 64 | 50 | 58 | 32 | 34 | 31 | 55 | 59 | 103 | 89 | 87 | 60 | 94 | 56 |
| so2 | 9.9 | 6.9 | 7 | 4.5 | 4.7 | 6.1 | 4.7 | 5.7 | 8.2 | 4.6 | 3.7 | 4.3 | 5.8 | 9.5 | 21 | 35 | 36 | 22 | 21 | 8.4 |