Luftverschmutzung in Dawucun: Echtzeit-Luft-Qualitätsindex und Smog-Alarm.
Für die Dawucun. Heute ist Donnerstag, 4. Juni 2026. Für Dawucun wurden folgende Luftverschmutzungswerte gemessen:- Feinstaub (PM10) Schwebestaub - 7 (gut)
- Feinstaub (PM2,5) - 2 (gut)
- Kohlenmonoxid (CO) - 100 (gut)
- Stickstoffdioxid (NO2) - 8 (gut)
- Ozon (O3) - 0 (gut)
- Schwefeldioxid (SO2) - 9 (gut)

Wie ist die Luftqualität Dawucun heute? Ist die Luft in Dawucun? verschmutzt. Gibt es Smog?
Wie hoch ist der PM10-Stand heute in Dawucun? (Feinstaub (PM10) Schwebestaub)
Der aktuelle Feinstaubgehalt PM10 in Dawucun is:
7 (gut)
Die höchsten PM10-Werte treten in der Regel im Monat auf: 119 (Januar 2019).
Der niedrigste Wert der Feinstaub-PM10-Belastung in Dawucun ist in der Regel in: August (39).
Wie hoch ist der aktuelle PM2,5-Wert in Dawucun? (Feinstaub (PM2,5))
Die heutige PM2.5-Stufe ist:
2 (gut)
Zum Vergleich: Der höchste PM2,5-Wert in Dawucun in den letzten 7 Tagen war: 24 (Freitag, 27. Mai 2022) und der niedrigste: 24 (Freitag, 27. Mai 2022).
Die höchsten PM2,5-Werte wurden gemessen: 101 (Januar 2020).
Die niedrigste Feinstaubbelastung PM2,5 tritt im Monat auf: August (20).
Wie hoch ist der CO-Gehalt? (Kohlenmonoxid (CO))
100 (gut)
Wie hoch ist das NO2-Niveau? (Stickstoffdioxid (NO2))
8 (gut)
Wie ist das O3-Niveau heute in Dawucun? (Ozon (O3))
0 (gut)
Wie hoch ist die SO2-Belastung? (Schwefeldioxid (SO2))
9 (gut)
Aktuelle Daten Freitag, 27. Mai 2022, 12:00
PM10 7 (gut)
PM2,5 2 (gut)
CO 100 (gut)
NO2 8 (gut)
O3 0 (gut)
SO2 9 (gut)
Daten zur Luftverschmutzung der letzten Tage in Dawucun
index
2022-05-27
pm10
32
Moderate
pm25
24
Moderate
co
468
Good
no2
21
Good
o3
32
Good
so2
5
Good
data source »
Luftverschmutzung in Dawucun von Dezember 2018 bis Januar 2020
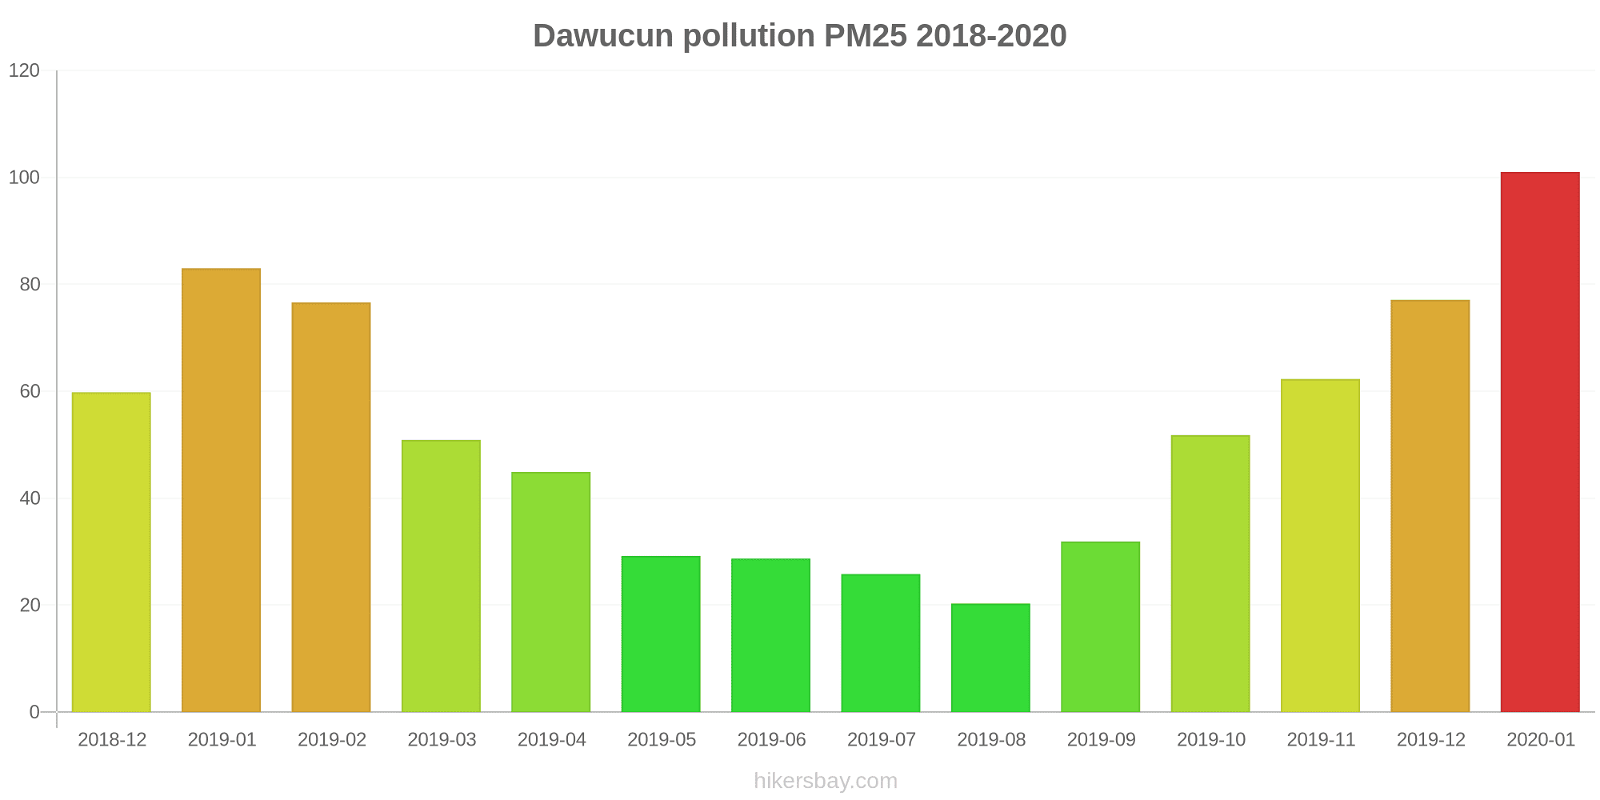
index
2020-01
2019-12
2019-11
2019-10
2019-09
2019-08
2019-07
2019-06
2019-05
2019-04
2019-03
2019-02
2019-01
2018-12
pm25
101 (Very Unhealthy)
77 (Very Unhealthy)
62 (Unhealthy)
52 (Unhealthy for Sensitive Groups)
32 (Moderate)
20 (Moderate)
26 (Moderate)
29 (Moderate)
29 (Moderate)
45 (Unhealthy for Sensitive Groups)
51 (Unhealthy for Sensitive Groups)
77 (Very Unhealthy)
83 (Very Unhealthy)
60 (Unhealthy)
co
1 (Good)
677 (Good)
535 (Good)
473 (Good)
494 (Good)
445 (Good)
480 (Good)
476 (Good)
482 (Good)
511 (Good)
545 (Good)
688 (Good)
793 (Good)
825 (Good)
no2
34 (Good)
39 (Good)
25 (Good)
26 (Good)
15 (Good)
11 (Good)
13 (Good)
11 (Good)
15 (Good)
19 (Good)
34 (Good)
29 (Good)
45 (Moderate)
56 (Moderate)
o3
66 (Good)
73 (Moderate)
108 (Moderate)
125 (Unhealthy for Sensitive Groups)
163 (Unhealthy)
142 (Unhealthy for Sensitive Groups)
165 (Unhealthy)
188 (Very Unhealthy)
148 (Unhealthy for Sensitive Groups)
116 (Moderate)
118 (Moderate)
82 (Moderate)
67 (Good)
61 (Good)
pm10
117 (Very Unhealthy)
101 (Unhealthy)
115 (Very Unhealthy)
114 (Very Unhealthy)
63 (Unhealthy for Sensitive Groups)
39 (Moderate)
49 (Moderate)
64 (Unhealthy for Sensitive Groups)
76 (Unhealthy for Sensitive Groups)
81 (Unhealthy)
100 (Unhealthy)
104 (Unhealthy)
119 (Very Unhealthy)
97 (Unhealthy)
so2
6.8 (Good)
5.8 (Good)
4.3 (Good)
5.2 (Good)
5.2 (Good)
4.8 (Good)
5.1 (Good)
6.3 (Good)
7.7 (Good)
8.1 (Good)
7.6 (Good)
9 (Good)
8.5 (Good)
12 (Good)
data source »
远航博物馆(181204启用)
Freitag, 27. Mai 2022, 12:00
PM10 6.7 (gut)
Feinstaub (PM10) Schwebestaub
PM2,5 1.7 (gut)
Feinstaub (PM2,5)
CO 100 (gut)
Kohlenmonoxid (CO)
NO2 7.6 (gut)
Stickstoffdioxid (NO2)
O3 0.02 (gut)
Ozon (O3)
SO2 8.6 (gut)
Schwefeldioxid (SO2)
远航博物馆(181204启用)
index
2022-05-27
pm10
32
pm25
24
co
468
no2
21
o3
32
so2
4.6
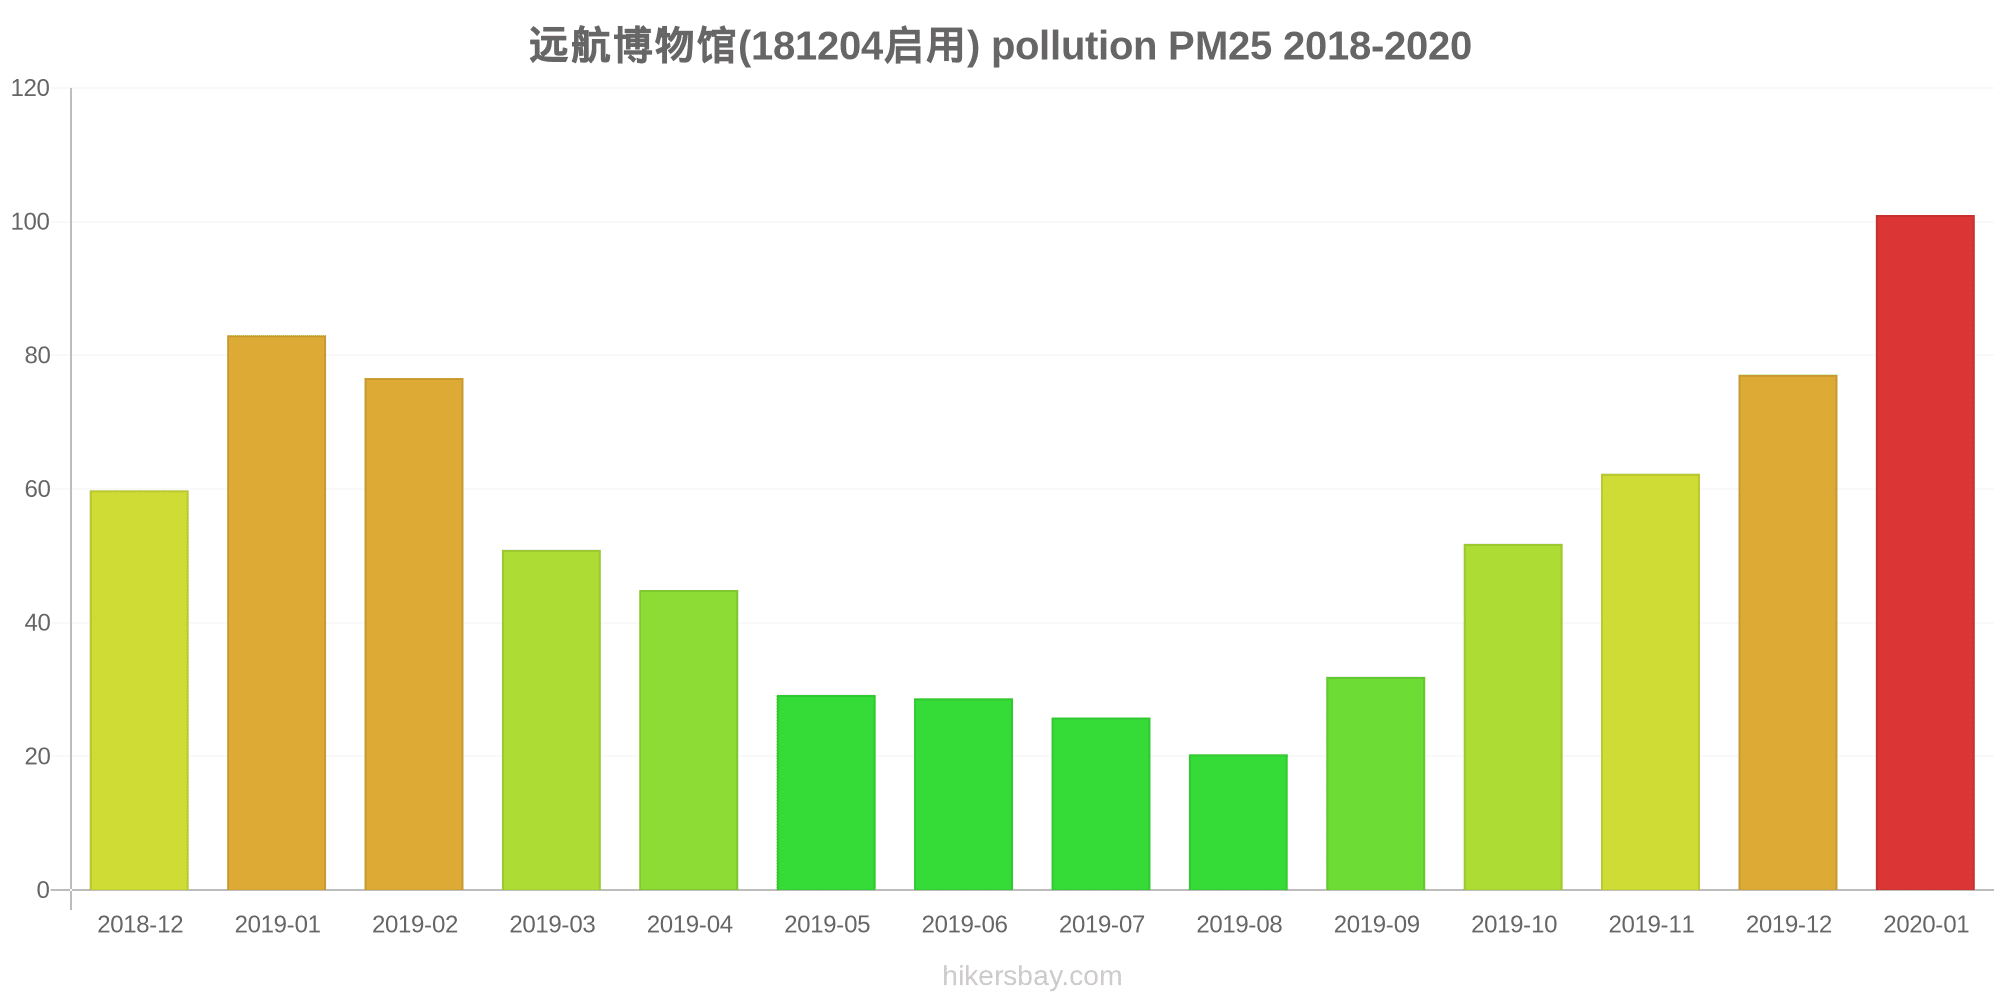
远航博物馆(181204启用)
2018-12 2020-01

index
2020-01
2019-12
2019-11
2019-10
2019-09
2019-08
2019-07
2019-06
2019-05
2019-04
2019-03
2019-02
2019-01
2018-12
pm25
101
77
62
52
32
20
26
29
29
45
51
77
83
60
co
1
677
535
473
494
445
480
476
482
511
545
688
793
825
no2
34
39
25
26
15
11
13
11
15
19
34
29
45
56
o3
66
73
108
125
163
142
165
188
148
116
118
82
67
61
pm10
117
101
115
114
63
39
49
64
76
81
100
104
119
97
so2
6.8
5.8
4.3
5.2
5.2
4.8
5.1
6.3
7.7
8.1
7.6
9
8.5
12
* Pollution data source:
https://openaq.org
()
The data is licensed under CC-By 4.0
PM10 7 (gut)
PM2,5 2 (gut)
CO 100 (gut)
NO2 8 (gut)
O3 0 (gut)
SO2 9 (gut)
Daten zur Luftverschmutzung der letzten Tage in Dawucun
| index | 2022-05-27 |
|---|---|
| pm10 | 32 Moderate |
| pm25 | 24 Moderate |
| co | 468 Good |
| no2 | 21 Good |
| o3 | 32 Good |
| so2 | 5 Good |

| index | 2020-01 | 2019-12 | 2019-11 | 2019-10 | 2019-09 | 2019-08 | 2019-07 | 2019-06 | 2019-05 | 2019-04 | 2019-03 | 2019-02 | 2019-01 | 2018-12 |
|---|---|---|---|---|---|---|---|---|---|---|---|---|---|---|
| pm25 | 101 (Very Unhealthy) | 77 (Very Unhealthy) | 62 (Unhealthy) | 52 (Unhealthy for Sensitive Groups) | 32 (Moderate) | 20 (Moderate) | 26 (Moderate) | 29 (Moderate) | 29 (Moderate) | 45 (Unhealthy for Sensitive Groups) | 51 (Unhealthy for Sensitive Groups) | 77 (Very Unhealthy) | 83 (Very Unhealthy) | 60 (Unhealthy) |
| co | 1 (Good) | 677 (Good) | 535 (Good) | 473 (Good) | 494 (Good) | 445 (Good) | 480 (Good) | 476 (Good) | 482 (Good) | 511 (Good) | 545 (Good) | 688 (Good) | 793 (Good) | 825 (Good) |
| no2 | 34 (Good) | 39 (Good) | 25 (Good) | 26 (Good) | 15 (Good) | 11 (Good) | 13 (Good) | 11 (Good) | 15 (Good) | 19 (Good) | 34 (Good) | 29 (Good) | 45 (Moderate) | 56 (Moderate) |
| o3 | 66 (Good) | 73 (Moderate) | 108 (Moderate) | 125 (Unhealthy for Sensitive Groups) | 163 (Unhealthy) | 142 (Unhealthy for Sensitive Groups) | 165 (Unhealthy) | 188 (Very Unhealthy) | 148 (Unhealthy for Sensitive Groups) | 116 (Moderate) | 118 (Moderate) | 82 (Moderate) | 67 (Good) | 61 (Good) |
| pm10 | 117 (Very Unhealthy) | 101 (Unhealthy) | 115 (Very Unhealthy) | 114 (Very Unhealthy) | 63 (Unhealthy for Sensitive Groups) | 39 (Moderate) | 49 (Moderate) | 64 (Unhealthy for Sensitive Groups) | 76 (Unhealthy for Sensitive Groups) | 81 (Unhealthy) | 100 (Unhealthy) | 104 (Unhealthy) | 119 (Very Unhealthy) | 97 (Unhealthy) |
| so2 | 6.8 (Good) | 5.8 (Good) | 4.3 (Good) | 5.2 (Good) | 5.2 (Good) | 4.8 (Good) | 5.1 (Good) | 6.3 (Good) | 7.7 (Good) | 8.1 (Good) | 7.6 (Good) | 9 (Good) | 8.5 (Good) | 12 (Good) |
PM10 6.7 (gut)
Feinstaub (PM10) SchwebestaubPM2,5 1.7 (gut)
Feinstaub (PM2,5)CO 100 (gut)
Kohlenmonoxid (CO)NO2 7.6 (gut)
Stickstoffdioxid (NO2)O3 0.02 (gut)
Ozon (O3)SO2 8.6 (gut)
Schwefeldioxid (SO2)远航博物馆(181204启用)
| index | 2022-05-27 |
|---|---|
| pm10 | 32 |
| pm25 | 24 |
| co | 468 |
| no2 | 21 |
| o3 | 32 |
| so2 | 4.6 |
远航博物馆(181204启用)
| index | 2020-01 | 2019-12 | 2019-11 | 2019-10 | 2019-09 | 2019-08 | 2019-07 | 2019-06 | 2019-05 | 2019-04 | 2019-03 | 2019-02 | 2019-01 | 2018-12 |
|---|---|---|---|---|---|---|---|---|---|---|---|---|---|---|
| pm25 | 101 | 77 | 62 | 52 | 32 | 20 | 26 | 29 | 29 | 45 | 51 | 77 | 83 | 60 |
| co | 1 | 677 | 535 | 473 | 494 | 445 | 480 | 476 | 482 | 511 | 545 | 688 | 793 | 825 |
| no2 | 34 | 39 | 25 | 26 | 15 | 11 | 13 | 11 | 15 | 19 | 34 | 29 | 45 | 56 |
| o3 | 66 | 73 | 108 | 125 | 163 | 142 | 165 | 188 | 148 | 116 | 118 | 82 | 67 | 61 |
| pm10 | 117 | 101 | 115 | 114 | 63 | 39 | 49 | 64 | 76 | 81 | 100 | 104 | 119 | 97 |
| so2 | 6.8 | 5.8 | 4.3 | 5.2 | 5.2 | 4.8 | 5.1 | 6.3 | 7.7 | 8.1 | 7.6 | 9 | 8.5 | 12 |