Luftverschmutzung in Dingloucun: Echtzeit-Luft-Qualitätsindex und Smog-Alarm.
Für die Dingloucun. Heute ist Donnerstag, 4. Juni 2026. Für Dingloucun wurden folgende Luftverschmutzungswerte gemessen:- Feinstaub (PM10) Schwebestaub - 7 (gut)
- Feinstaub (PM2,5) - 2 (gut)
- Kohlenmonoxid (CO) - 100 (gut)
- Stickstoffdioxid (NO2) - 8 (gut)
- Ozon (O3) - 0 (gut)
- Schwefeldioxid (SO2) - 9 (gut)

Wie ist die Luftqualität Dingloucun heute? Ist die Luft in Dingloucun? verschmutzt. Gibt es Smog?
Wie hoch ist der PM10-Stand heute in Dingloucun? (Feinstaub (PM10) Schwebestaub)
Der aktuelle Feinstaubgehalt PM10 in Dingloucun is:
7 (gut)
Die höchsten PM10-Werte treten in der Regel im Monat auf: 149 (Januar 2019).
Der niedrigste Wert der Feinstaub-PM10-Belastung in Dingloucun ist in der Regel in: August (40).
Wie hoch ist der aktuelle PM2,5-Wert in Dingloucun? (Feinstaub (PM2,5))
Die heutige PM2.5-Stufe ist:
2 (gut)
Zum Vergleich: Der höchste PM2,5-Wert in Dingloucun in den letzten 7 Tagen war: 24 (Freitag, 27. Mai 2022) und der niedrigste: 24 (Freitag, 27. Mai 2022).
Die höchsten PM2,5-Werte wurden gemessen: 115 (Januar 2020).
Die niedrigste Feinstaubbelastung PM2,5 tritt im Monat auf: August (23).
Wie hoch ist der CO-Gehalt? (Kohlenmonoxid (CO))
100 (gut)
Wie hoch ist das NO2-Niveau? (Stickstoffdioxid (NO2))
8 (gut)
Wie ist das O3-Niveau heute in Dingloucun? (Ozon (O3))
0 (gut)
Wie hoch ist die SO2-Belastung? (Schwefeldioxid (SO2))
9 (gut)
Aktuelle Daten Freitag, 27. Mai 2022, 12:00
PM10 7 (gut)
PM2,5 2 (gut)
CO 100 (gut)
NO2 8 (gut)
O3 0 (gut)
SO2 9 (gut)
Daten zur Luftverschmutzung der letzten Tage in Dingloucun
index
2022-05-27
pm10
32
Moderate
pm25
24
Moderate
co
468
Good
no2
21
Good
o3
32
Good
so2
5
Good
data source »
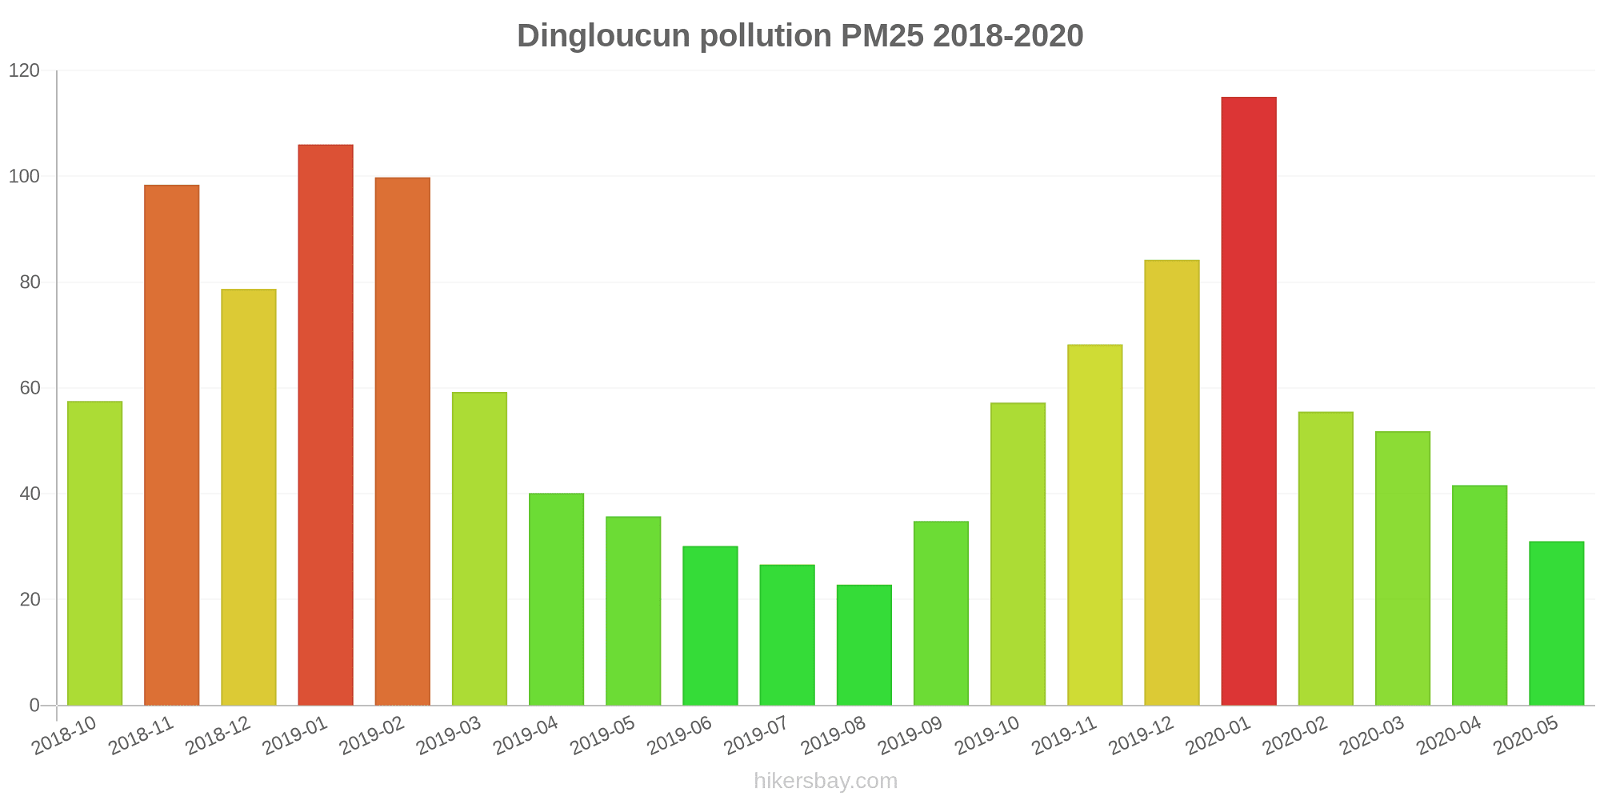
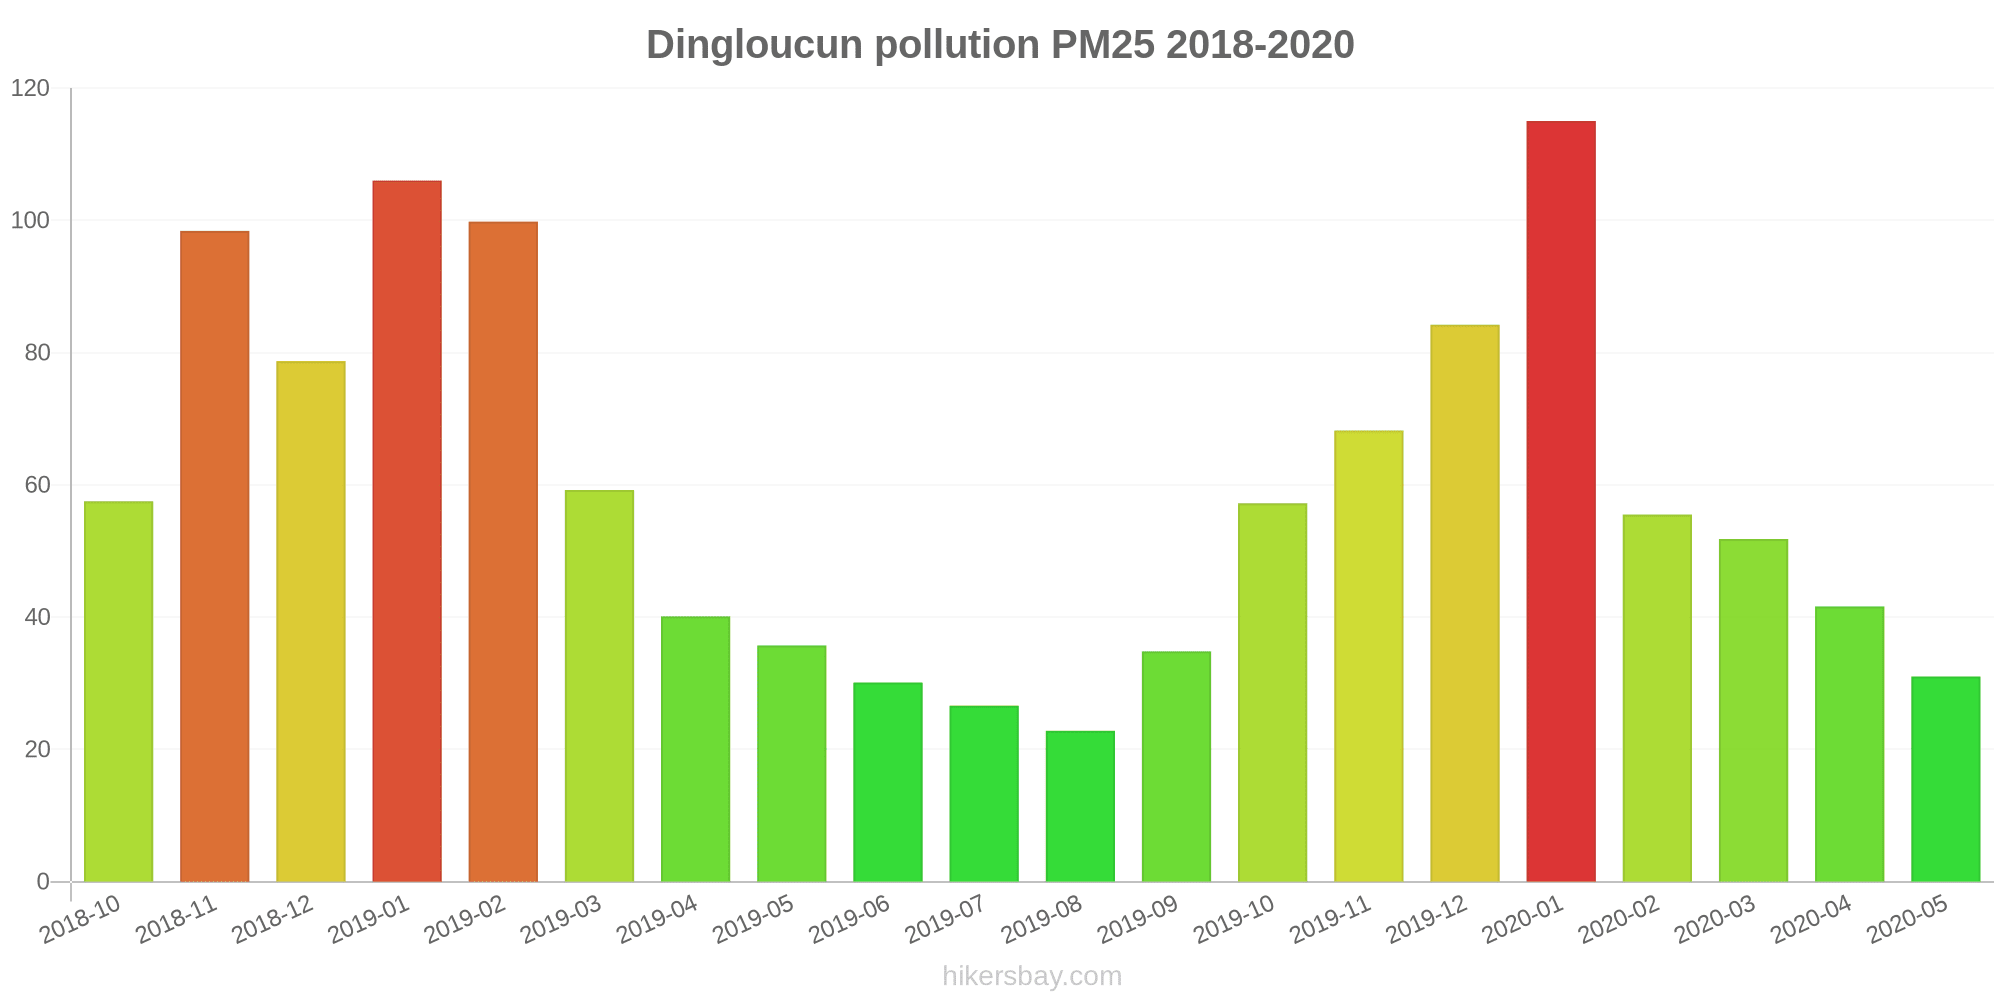
Luftverschmutzung in Dingloucun von Oktober 2018 bis Mai 2020
index
2020-05
2020-04
2020-03
2020-02
2020-01
2019-12
2019-11
2019-10
2019-09
2019-08
2019-07
2019-06
2019-05
2019-04
2019-03
2019-02
2019-01
2018-12
2018-11
2018-10
pm25
31 (Moderate)
42 (Unhealthy for Sensitive Groups)
52 (Unhealthy for Sensitive Groups)
56 (Unhealthy)
115 (Very bad Hazardous)
84 (Very Unhealthy)
68 (Unhealthy)
57 (Unhealthy)
35 (Moderate)
23 (Moderate)
27 (Moderate)
30 (Moderate)
36 (Unhealthy for Sensitive Groups)
40 (Unhealthy for Sensitive Groups)
59 (Unhealthy)
100 (Very Unhealthy)
106 (Very Unhealthy)
79 (Very Unhealthy)
98 (Very Unhealthy)
58 (Unhealthy)
co
569 (Good)
594 (Good)
692 (Good)
720 (Good)
1 (Good)
989 (Good)
851 (Good)
922 (Good)
868 (Good)
719 (Good)
737 (Good)
670 (Good)
486 (Good)
536 (Good)
560 (Good)
1 (Good)
1 (Good)
873 (Good)
958 (Good)
708 (Good)
no2
19 (Good)
27 (Good)
28 (Good)
15 (Good)
34 (Good)
50 (Moderate)
43 (Moderate)
39 (Good)
19 (Good)
12 (Good)
15 (Good)
12 (Good)
20 (Good)
22 (Good)
31 (Good)
34 (Good)
50 (Moderate)
49 (Moderate)
40 (Good)
46 (Moderate)
o3
137 (Unhealthy for Sensitive Groups)
148 (Unhealthy for Sensitive Groups)
106 (Moderate)
93 (Moderate)
75 (Moderate)
67 (Good)
102 (Moderate)
127 (Unhealthy for Sensitive Groups)
168 (Unhealthy)
150 (Unhealthy)
173 (Unhealthy)
194 (Very Unhealthy)
153 (Unhealthy)
127 (Unhealthy for Sensitive Groups)
113 (Moderate)
89 (Moderate)
62 (Good)
50 (Good)
90 (Moderate)
116 (Moderate)
pm10
70 (Unhealthy for Sensitive Groups)
84 (Unhealthy)
89 (Unhealthy)
74 (Unhealthy for Sensitive Groups)
142 (Very Unhealthy)
119 (Very Unhealthy)
126 (Very Unhealthy)
116 (Very Unhealthy)
64 (Unhealthy for Sensitive Groups)
40 (Moderate)
45 (Moderate)
62 (Unhealthy for Sensitive Groups)
85 (Unhealthy)
81 (Unhealthy)
106 (Unhealthy)
130 (Very Unhealthy)
149 (Very Unhealthy)
121 (Very Unhealthy)
139 (Very Unhealthy)
93 (Unhealthy)
so2
7.2 (Good)
8 (Good)
7.5 (Good)
5.8 (Good)
8.3 (Good)
10 (Good)
12 (Good)
11 (Good)
8.7 (Good)
6.7 (Good)
6.5 (Good)
7.6 (Good)
10 (Good)
9.4 (Good)
14 (Good)
13 (Good)
16 (Good)
13 (Good)
11 (Good)
12 (Good)
data source »
Huaibei Zhi Ye Ji Zhu Xue Yuan
Freitag, 27. Mai 2022, 12:00
PM10 6.7 (gut)
Feinstaub (PM10) Schwebestaub
PM2,5 1.7 (gut)
Feinstaub (PM2,5)
CO 100 (gut)
Kohlenmonoxid (CO)
NO2 7.6 (gut)
Stickstoffdioxid (NO2)
O3 0.02 (gut)
Ozon (O3)
SO2 8.6 (gut)
Schwefeldioxid (SO2)
Huaibei Zhi Ye Ji Zhu Xue Yuan
index
2022-05-27
pm10
32
pm25
24
co
468
no2
21
o3
32
so2
4.6
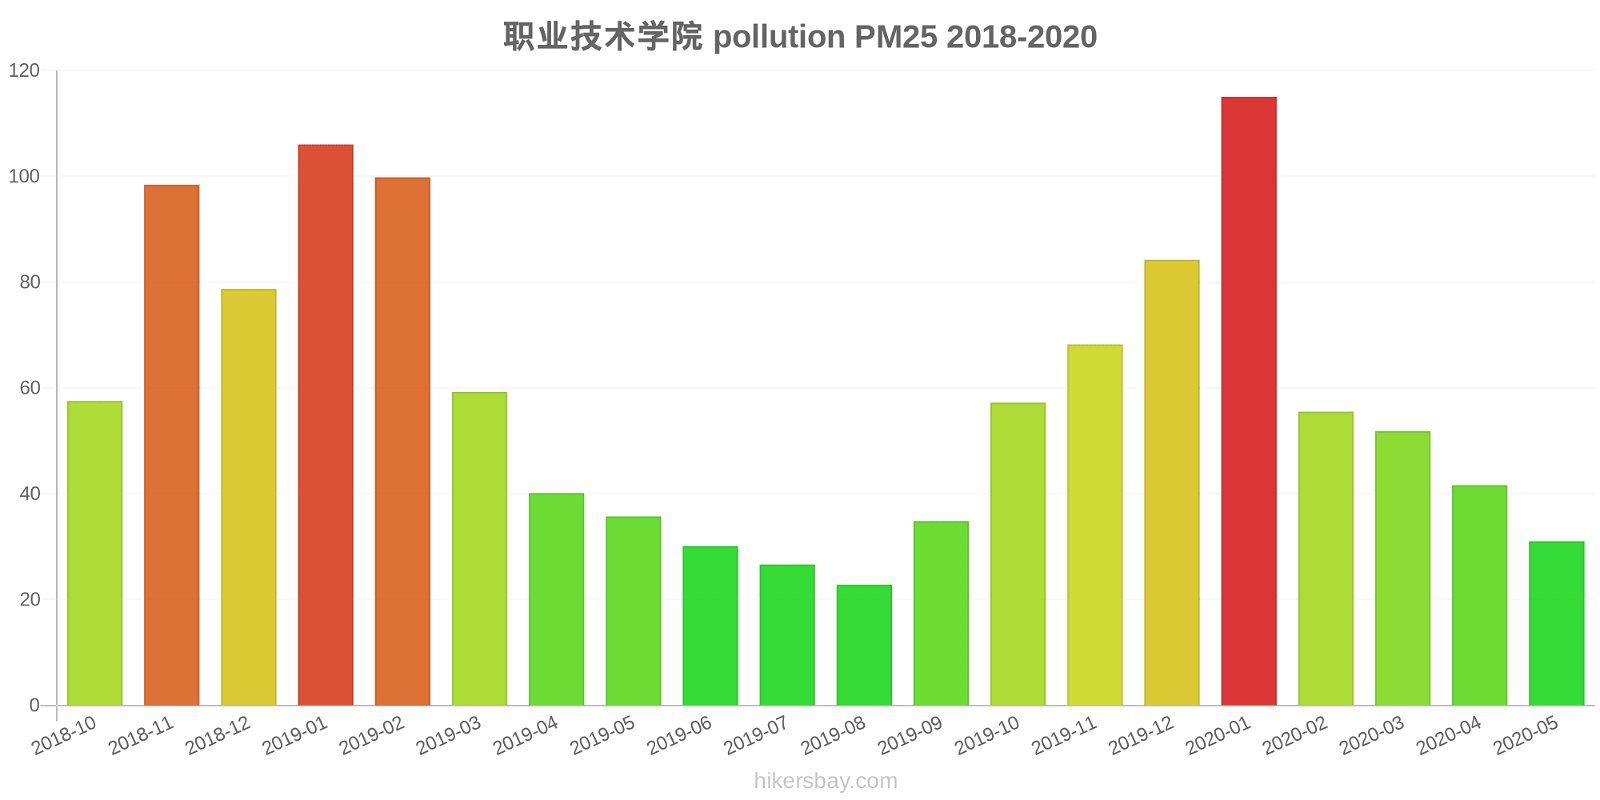
职业技术学院
2018-10 2020-05
index
2020-05
2020-04
2020-03
2020-02
2020-01
2019-12
2019-11
2019-10
2019-09
2019-08
2019-07
2019-06
2019-05
2019-04
2019-03
2019-02
2019-01
2018-12
2018-11
2018-10
pm25
31
42
52
56
115
84
68
57
35
23
27
30
36
40
59
100
106
79
98
58
co
569
594
692
720
1
989
851
922
868
719
737
670
486
536
560
1
1
873
958
708
no2
19
27
28
15
34
50
43
39
19
12
15
12
20
22
31
34
50
49
40
46
o3
137
148
106
93
75
67
102
127
168
150
173
194
153
127
113
89
62
50
90
116
pm10
70
84
89
74
142
119
126
116
64
40
45
62
85
81
106
130
149
121
139
93
so2
7.2
8
7.5
5.8
8.3
10
12
11
8.7
6.7
6.5
7.6
10
9.4
14
13
16
13
11
12
* Pollution data source:
https://openaq.org
(ChinaAQIData)
The data is licensed under CC-By 4.0
PM10 7 (gut)
PM2,5 2 (gut)
CO 100 (gut)
NO2 8 (gut)
O3 0 (gut)
SO2 9 (gut)
Daten zur Luftverschmutzung der letzten Tage in Dingloucun
| index | 2022-05-27 |
|---|---|
| pm10 | 32 Moderate |
| pm25 | 24 Moderate |
| co | 468 Good |
| no2 | 21 Good |
| o3 | 32 Good |
| so2 | 5 Good |
| index | 2020-05 | 2020-04 | 2020-03 | 2020-02 | 2020-01 | 2019-12 | 2019-11 | 2019-10 | 2019-09 | 2019-08 | 2019-07 | 2019-06 | 2019-05 | 2019-04 | 2019-03 | 2019-02 | 2019-01 | 2018-12 | 2018-11 | 2018-10 |
|---|---|---|---|---|---|---|---|---|---|---|---|---|---|---|---|---|---|---|---|---|
| pm25 | 31 (Moderate) | 42 (Unhealthy for Sensitive Groups) | 52 (Unhealthy for Sensitive Groups) | 56 (Unhealthy) | 115 (Very bad Hazardous) | 84 (Very Unhealthy) | 68 (Unhealthy) | 57 (Unhealthy) | 35 (Moderate) | 23 (Moderate) | 27 (Moderate) | 30 (Moderate) | 36 (Unhealthy for Sensitive Groups) | 40 (Unhealthy for Sensitive Groups) | 59 (Unhealthy) | 100 (Very Unhealthy) | 106 (Very Unhealthy) | 79 (Very Unhealthy) | 98 (Very Unhealthy) | 58 (Unhealthy) |
| co | 569 (Good) | 594 (Good) | 692 (Good) | 720 (Good) | 1 (Good) | 989 (Good) | 851 (Good) | 922 (Good) | 868 (Good) | 719 (Good) | 737 (Good) | 670 (Good) | 486 (Good) | 536 (Good) | 560 (Good) | 1 (Good) | 1 (Good) | 873 (Good) | 958 (Good) | 708 (Good) |
| no2 | 19 (Good) | 27 (Good) | 28 (Good) | 15 (Good) | 34 (Good) | 50 (Moderate) | 43 (Moderate) | 39 (Good) | 19 (Good) | 12 (Good) | 15 (Good) | 12 (Good) | 20 (Good) | 22 (Good) | 31 (Good) | 34 (Good) | 50 (Moderate) | 49 (Moderate) | 40 (Good) | 46 (Moderate) |
| o3 | 137 (Unhealthy for Sensitive Groups) | 148 (Unhealthy for Sensitive Groups) | 106 (Moderate) | 93 (Moderate) | 75 (Moderate) | 67 (Good) | 102 (Moderate) | 127 (Unhealthy for Sensitive Groups) | 168 (Unhealthy) | 150 (Unhealthy) | 173 (Unhealthy) | 194 (Very Unhealthy) | 153 (Unhealthy) | 127 (Unhealthy for Sensitive Groups) | 113 (Moderate) | 89 (Moderate) | 62 (Good) | 50 (Good) | 90 (Moderate) | 116 (Moderate) |
| pm10 | 70 (Unhealthy for Sensitive Groups) | 84 (Unhealthy) | 89 (Unhealthy) | 74 (Unhealthy for Sensitive Groups) | 142 (Very Unhealthy) | 119 (Very Unhealthy) | 126 (Very Unhealthy) | 116 (Very Unhealthy) | 64 (Unhealthy for Sensitive Groups) | 40 (Moderate) | 45 (Moderate) | 62 (Unhealthy for Sensitive Groups) | 85 (Unhealthy) | 81 (Unhealthy) | 106 (Unhealthy) | 130 (Very Unhealthy) | 149 (Very Unhealthy) | 121 (Very Unhealthy) | 139 (Very Unhealthy) | 93 (Unhealthy) |
| so2 | 7.2 (Good) | 8 (Good) | 7.5 (Good) | 5.8 (Good) | 8.3 (Good) | 10 (Good) | 12 (Good) | 11 (Good) | 8.7 (Good) | 6.7 (Good) | 6.5 (Good) | 7.6 (Good) | 10 (Good) | 9.4 (Good) | 14 (Good) | 13 (Good) | 16 (Good) | 13 (Good) | 11 (Good) | 12 (Good) |
PM10 6.7 (gut)
Feinstaub (PM10) SchwebestaubPM2,5 1.7 (gut)
Feinstaub (PM2,5)CO 100 (gut)
Kohlenmonoxid (CO)NO2 7.6 (gut)
Stickstoffdioxid (NO2)O3 0.02 (gut)
Ozon (O3)SO2 8.6 (gut)
Schwefeldioxid (SO2)Huaibei Zhi Ye Ji Zhu Xue Yuan
| index | 2022-05-27 |
|---|---|
| pm10 | 32 |
| pm25 | 24 |
| co | 468 |
| no2 | 21 |
| o3 | 32 |
| so2 | 4.6 |
职业技术学院

| index | 2020-05 | 2020-04 | 2020-03 | 2020-02 | 2020-01 | 2019-12 | 2019-11 | 2019-10 | 2019-09 | 2019-08 | 2019-07 | 2019-06 | 2019-05 | 2019-04 | 2019-03 | 2019-02 | 2019-01 | 2018-12 | 2018-11 | 2018-10 |
|---|---|---|---|---|---|---|---|---|---|---|---|---|---|---|---|---|---|---|---|---|
| pm25 | 31 | 42 | 52 | 56 | 115 | 84 | 68 | 57 | 35 | 23 | 27 | 30 | 36 | 40 | 59 | 100 | 106 | 79 | 98 | 58 |
| co | 569 | 594 | 692 | 720 | 1 | 989 | 851 | 922 | 868 | 719 | 737 | 670 | 486 | 536 | 560 | 1 | 1 | 873 | 958 | 708 |
| no2 | 19 | 27 | 28 | 15 | 34 | 50 | 43 | 39 | 19 | 12 | 15 | 12 | 20 | 22 | 31 | 34 | 50 | 49 | 40 | 46 |
| o3 | 137 | 148 | 106 | 93 | 75 | 67 | 102 | 127 | 168 | 150 | 173 | 194 | 153 | 127 | 113 | 89 | 62 | 50 | 90 | 116 |
| pm10 | 70 | 84 | 89 | 74 | 142 | 119 | 126 | 116 | 64 | 40 | 45 | 62 | 85 | 81 | 106 | 130 | 149 | 121 | 139 | 93 |
| so2 | 7.2 | 8 | 7.5 | 5.8 | 8.3 | 10 | 12 | 11 | 8.7 | 6.7 | 6.5 | 7.6 | 10 | 9.4 | 14 | 13 | 16 | 13 | 11 | 12 |