Luftverschmutzung in Honghe: Echtzeit-Luft-Qualitätsindex und Smog-Alarm.
Für die Honghe. Heute ist Donnerstag, 4. Juni 2026. Für Honghe wurden folgende Luftverschmutzungswerte gemessen:- Feinstaub (PM10) Schwebestaub - 179 (Sehr schlecht Gefährlich)
- Feinstaub (PM2,5) - 35 (Ungesund für sensible Gruppen)
- Ozon (O3) - 0 (gut)
- Stickstoffdioxid (NO2) - 0 (gut)
- Schwefeldioxid (SO2) - 0 (gut)

Wie ist die Luftqualität Honghe heute? Ist die Luft in Honghe? verschmutzt. Gibt es Smog?
Wie hoch ist der PM10-Stand heute in Honghe? (Feinstaub (PM10) Schwebestaub)
Der aktuelle Feinstaubgehalt PM10 in Honghe is:
179 (Sehr schlecht Gefährlich)
Die höchsten PM10-Werte treten in der Regel im Monat auf: 172 (Januar 2019).
Der niedrigste Wert der Feinstaub-PM10-Belastung in Honghe ist in der Regel in: September (56).
Wie hoch ist der aktuelle PM2,5-Wert in Honghe? (Feinstaub (PM2,5))
Die heutige PM2.5-Stufe ist:
35 (Ungesund für sensible Gruppen)
Zum Vergleich: Der höchste PM2,5-Wert in Honghe in den letzten 7 Tagen war: 56 (Freitag, 27. Mai 2022) und der niedrigste: 56 (Freitag, 27. Mai 2022).
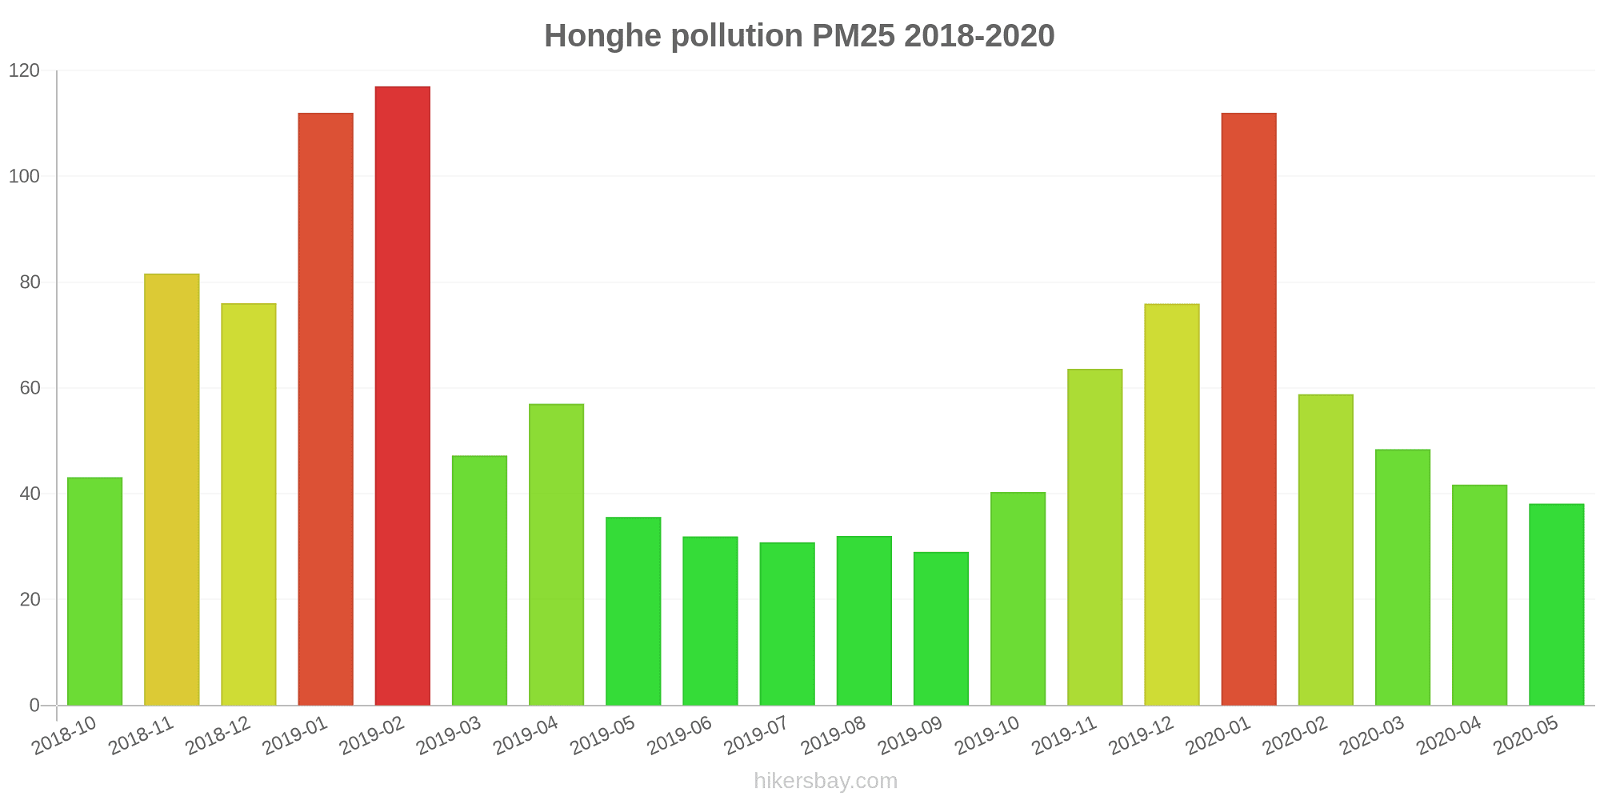
Die höchsten PM2,5-Werte wurden gemessen: 117 (Februar 2019).
Die niedrigste Feinstaubbelastung PM2,5 tritt im Monat auf: September (29).
Wie ist das O3-Niveau heute in Honghe? (Ozon (O3))
0 (gut)
Wie hoch ist das NO2-Niveau? (Stickstoffdioxid (NO2))
0 (gut)
Wie hoch ist die SO2-Belastung? (Schwefeldioxid (SO2))
0 (gut)
Aktuelle Daten Freitag, 27. Mai 2022, 12:00
PM10 179 (Sehr schlecht Gefährlich)
PM2,5 35 (Ungesund für sensible Gruppen)
O3 0 (gut)
NO2 0 (gut)
SO2 0 (gut)
Daten zur Luftverschmutzung der letzten Tage in Honghe
index
2022-05-27
pm10
56
Unhealthy for Sensitive Groups
pm25
56
Unhealthy
o3
0
Good
no2
0
Good
so2
0
Good
data source »
Luftverschmutzung in Honghe von Oktober 2018 bis Mai 2020
index
2020-05
2020-04
2020-03
2020-02
2020-01
2019-12
2019-11
2019-10
2019-09
2019-08
2019-07
2019-06
2019-05
2019-04
2019-03
2019-02
2019-01
2018-12
2018-11
2018-10
pm25
38 (Unhealthy for Sensitive Groups)
42 (Unhealthy for Sensitive Groups)
48 (Unhealthy for Sensitive Groups)
59 (Unhealthy)
112 (Very bad Hazardous)
76 (Very Unhealthy)
64 (Unhealthy)
40 (Unhealthy for Sensitive Groups)
29 (Moderate)
32 (Moderate)
31 (Moderate)
32 (Moderate)
36 (Unhealthy for Sensitive Groups)
57 (Unhealthy)
47 (Unhealthy for Sensitive Groups)
117 (Very bad Hazardous)
112 (Very bad Hazardous)
76 (Very Unhealthy)
82 (Very Unhealthy)
43 (Unhealthy for Sensitive Groups)
co
892 (Good)
688 (Good)
681 (Good)
987 (Good)
1 (Good)
1 (Good)
866 (Good)
728 (Good)
686 (Good)
646 (Good)
511 (Good)
565 (Good)
442 (Good)
942 (Good)
680 (Good)
1 (Good)
1 (Good)
1 (Good)
1 (Good)
889 (Good)
no2
19 (Good)
20 (Good)
22 (Good)
14 (Good)
35 (Good)
36 (Good)
24 (Good)
18 (Good)
16 (Good)
13 (Good)
14 (Good)
17 (Good)
23 (Good)
20 (Good)
14 (Good)
20 (Good)
45 (Moderate)
43 (Moderate)
35 (Good)
21 (Good)
o3
155 (Unhealthy)
135 (Unhealthy for Sensitive Groups)
103 (Moderate)
94 (Moderate)
63 (Good)
60 (Good)
86 (Moderate)
107 (Moderate)
171 (Unhealthy)
143 (Unhealthy for Sensitive Groups)
195 (Very Unhealthy)
196 (Very Unhealthy)
164 (Unhealthy)
130 (Unhealthy for Sensitive Groups)
113 (Moderate)
91 (Moderate)
56 (Good)
46 (Good)
79 (Moderate)
109 (Moderate)
pm10
74 (Unhealthy for Sensitive Groups)
85 (Unhealthy)
97 (Unhealthy)
85 (Unhealthy)
146 (Very Unhealthy)
112 (Very Unhealthy)
118 (Very Unhealthy)
75 (Unhealthy for Sensitive Groups)
56 (Unhealthy for Sensitive Groups)
59 (Unhealthy for Sensitive Groups)
61 (Unhealthy for Sensitive Groups)
70 (Unhealthy for Sensitive Groups)
104 (Unhealthy)
109 (Unhealthy)
98 (Unhealthy)
166 (Very bad Hazardous)
172 (Very bad Hazardous)
141 (Very Unhealthy)
145 (Very Unhealthy)
79 (Unhealthy for Sensitive Groups)
so2
9.8 (Good)
11 (Good)
11 (Good)
10 (Good)
13 (Good)
14 (Good)
13 (Good)
9.1 (Good)
7.9 (Good)
6.8 (Good)
6.8 (Good)
12 (Good)
11 (Good)
12 (Good)
13 (Good)
13 (Good)
20 (Good)
19 (Good)
14 (Good)
14 (Good)
data source »
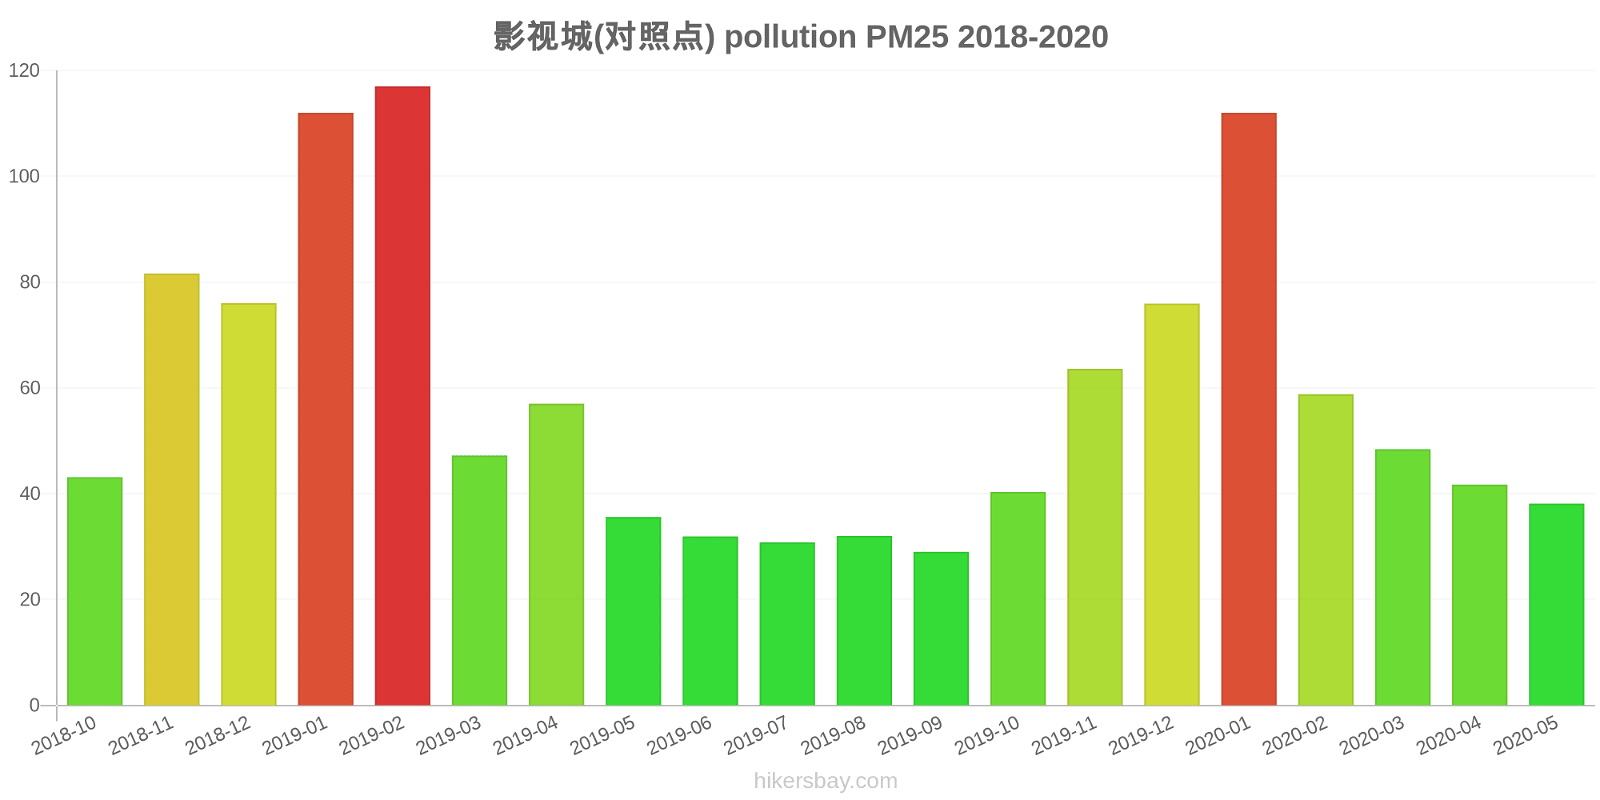
影视城(对照点)
Freitag, 27. Mai 2022, 12:00
PM10 179 (Sehr schlecht Gefährlich)
Feinstaub (PM10) Schwebestaub
PM2,5 35 (Ungesund für sensible Gruppen)
Feinstaub (PM2,5)
O3 0.04 (gut)
Ozon (O3)
NO2 0 (gut)
Stickstoffdioxid (NO2)
SO2 0 (gut)
Schwefeldioxid (SO2)
影视城(对照点)
index
2022-05-27
pm10
56
pm25
56
o3
0.03
no2
0
so2
0
影视城(对照点)
2018-10 2020-05
index
2020-05
2020-04
2020-03
2020-02
2020-01
2019-12
2019-11
2019-10
2019-09
2019-08
2019-07
2019-06
2019-05
2019-04
2019-03
2019-02
2019-01
2018-12
2018-11
2018-10
pm25
38
42
48
59
112
76
64
40
29
32
31
32
36
57
47
117
112
76
82
43
co
892
688
681
987
1
1
866
728
686
646
511
565
442
942
680
1
1
1
1
889
no2
19
20
22
14
35
36
24
18
16
13
14
17
23
20
14
20
45
43
35
21
o3
155
135
103
94
63
60
86
107
171
143
195
196
164
130
113
91
56
46
79
109
pm10
74
85
97
85
146
112
118
75
56
59
61
70
104
109
98
166
172
141
145
79
so2
9.8
11
11
10
13
14
13
9.1
7.9
6.8
6.8
12
11
12
13
13
20
19
14
14
* Pollution data source:
https://openaq.org
(ChinaAQIData)
The data is licensed under CC-By 4.0
PM10 179 (Sehr schlecht Gefährlich)
PM2,5 35 (Ungesund für sensible Gruppen)
O3 0 (gut)
NO2 0 (gut)
SO2 0 (gut)
Daten zur Luftverschmutzung der letzten Tage in Honghe
| index | 2022-05-27 |
|---|---|
| pm10 | 56 Unhealthy for Sensitive Groups |
| pm25 | 56 Unhealthy |
| o3 | 0 Good |
| no2 | 0 Good |
| so2 | 0 Good |
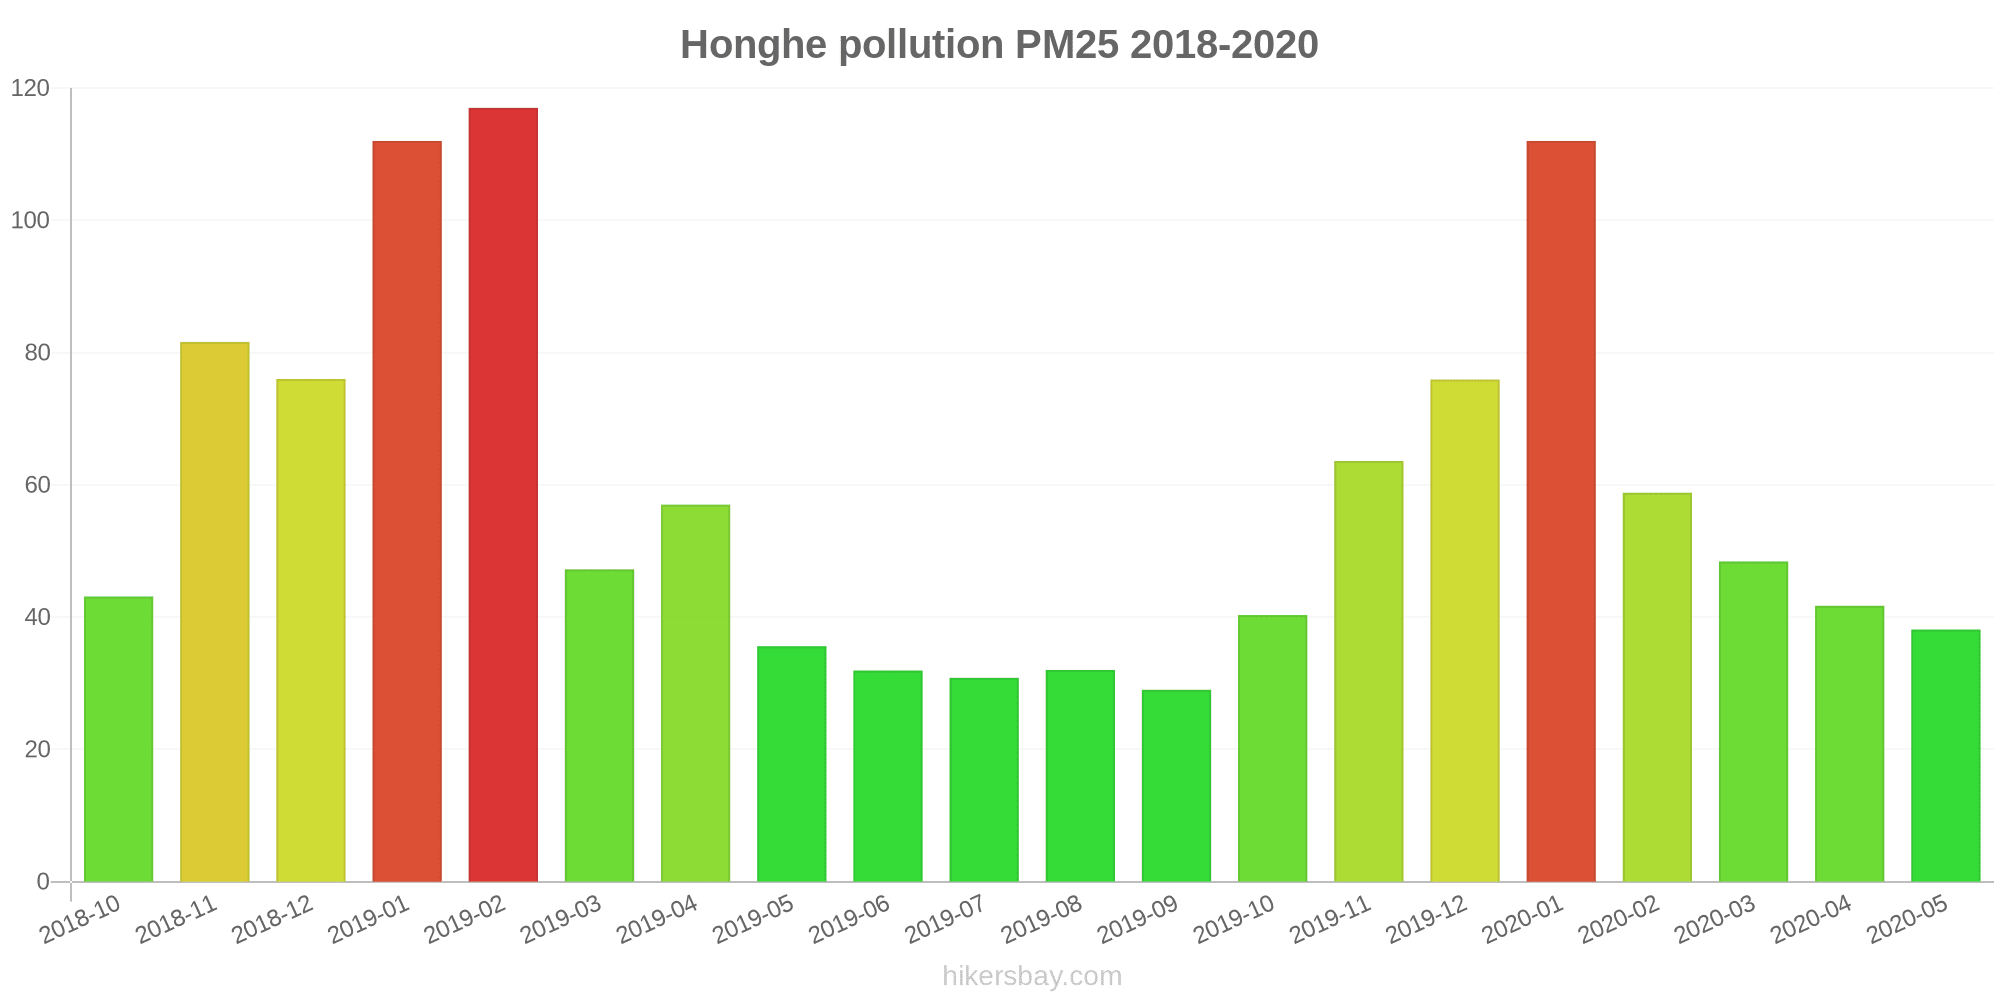
| index | 2020-05 | 2020-04 | 2020-03 | 2020-02 | 2020-01 | 2019-12 | 2019-11 | 2019-10 | 2019-09 | 2019-08 | 2019-07 | 2019-06 | 2019-05 | 2019-04 | 2019-03 | 2019-02 | 2019-01 | 2018-12 | 2018-11 | 2018-10 |
|---|---|---|---|---|---|---|---|---|---|---|---|---|---|---|---|---|---|---|---|---|
| pm25 | 38 (Unhealthy for Sensitive Groups) | 42 (Unhealthy for Sensitive Groups) | 48 (Unhealthy for Sensitive Groups) | 59 (Unhealthy) | 112 (Very bad Hazardous) | 76 (Very Unhealthy) | 64 (Unhealthy) | 40 (Unhealthy for Sensitive Groups) | 29 (Moderate) | 32 (Moderate) | 31 (Moderate) | 32 (Moderate) | 36 (Unhealthy for Sensitive Groups) | 57 (Unhealthy) | 47 (Unhealthy for Sensitive Groups) | 117 (Very bad Hazardous) | 112 (Very bad Hazardous) | 76 (Very Unhealthy) | 82 (Very Unhealthy) | 43 (Unhealthy for Sensitive Groups) |
| co | 892 (Good) | 688 (Good) | 681 (Good) | 987 (Good) | 1 (Good) | 1 (Good) | 866 (Good) | 728 (Good) | 686 (Good) | 646 (Good) | 511 (Good) | 565 (Good) | 442 (Good) | 942 (Good) | 680 (Good) | 1 (Good) | 1 (Good) | 1 (Good) | 1 (Good) | 889 (Good) |
| no2 | 19 (Good) | 20 (Good) | 22 (Good) | 14 (Good) | 35 (Good) | 36 (Good) | 24 (Good) | 18 (Good) | 16 (Good) | 13 (Good) | 14 (Good) | 17 (Good) | 23 (Good) | 20 (Good) | 14 (Good) | 20 (Good) | 45 (Moderate) | 43 (Moderate) | 35 (Good) | 21 (Good) |
| o3 | 155 (Unhealthy) | 135 (Unhealthy for Sensitive Groups) | 103 (Moderate) | 94 (Moderate) | 63 (Good) | 60 (Good) | 86 (Moderate) | 107 (Moderate) | 171 (Unhealthy) | 143 (Unhealthy for Sensitive Groups) | 195 (Very Unhealthy) | 196 (Very Unhealthy) | 164 (Unhealthy) | 130 (Unhealthy for Sensitive Groups) | 113 (Moderate) | 91 (Moderate) | 56 (Good) | 46 (Good) | 79 (Moderate) | 109 (Moderate) |
| pm10 | 74 (Unhealthy for Sensitive Groups) | 85 (Unhealthy) | 97 (Unhealthy) | 85 (Unhealthy) | 146 (Very Unhealthy) | 112 (Very Unhealthy) | 118 (Very Unhealthy) | 75 (Unhealthy for Sensitive Groups) | 56 (Unhealthy for Sensitive Groups) | 59 (Unhealthy for Sensitive Groups) | 61 (Unhealthy for Sensitive Groups) | 70 (Unhealthy for Sensitive Groups) | 104 (Unhealthy) | 109 (Unhealthy) | 98 (Unhealthy) | 166 (Very bad Hazardous) | 172 (Very bad Hazardous) | 141 (Very Unhealthy) | 145 (Very Unhealthy) | 79 (Unhealthy for Sensitive Groups) |
| so2 | 9.8 (Good) | 11 (Good) | 11 (Good) | 10 (Good) | 13 (Good) | 14 (Good) | 13 (Good) | 9.1 (Good) | 7.9 (Good) | 6.8 (Good) | 6.8 (Good) | 12 (Good) | 11 (Good) | 12 (Good) | 13 (Good) | 13 (Good) | 20 (Good) | 19 (Good) | 14 (Good) | 14 (Good) |
PM10 179 (Sehr schlecht Gefährlich)
Feinstaub (PM10) SchwebestaubPM2,5 35 (Ungesund für sensible Gruppen)
Feinstaub (PM2,5)O3 0.04 (gut)
Ozon (O3)NO2 0 (gut)
Stickstoffdioxid (NO2)SO2 0 (gut)
Schwefeldioxid (SO2)影视城(对照点)
| index | 2022-05-27 |
|---|---|
| pm10 | 56 |
| pm25 | 56 |
| o3 | 0.03 |
| no2 | 0 |
| so2 | 0 |
影视城(对照点)
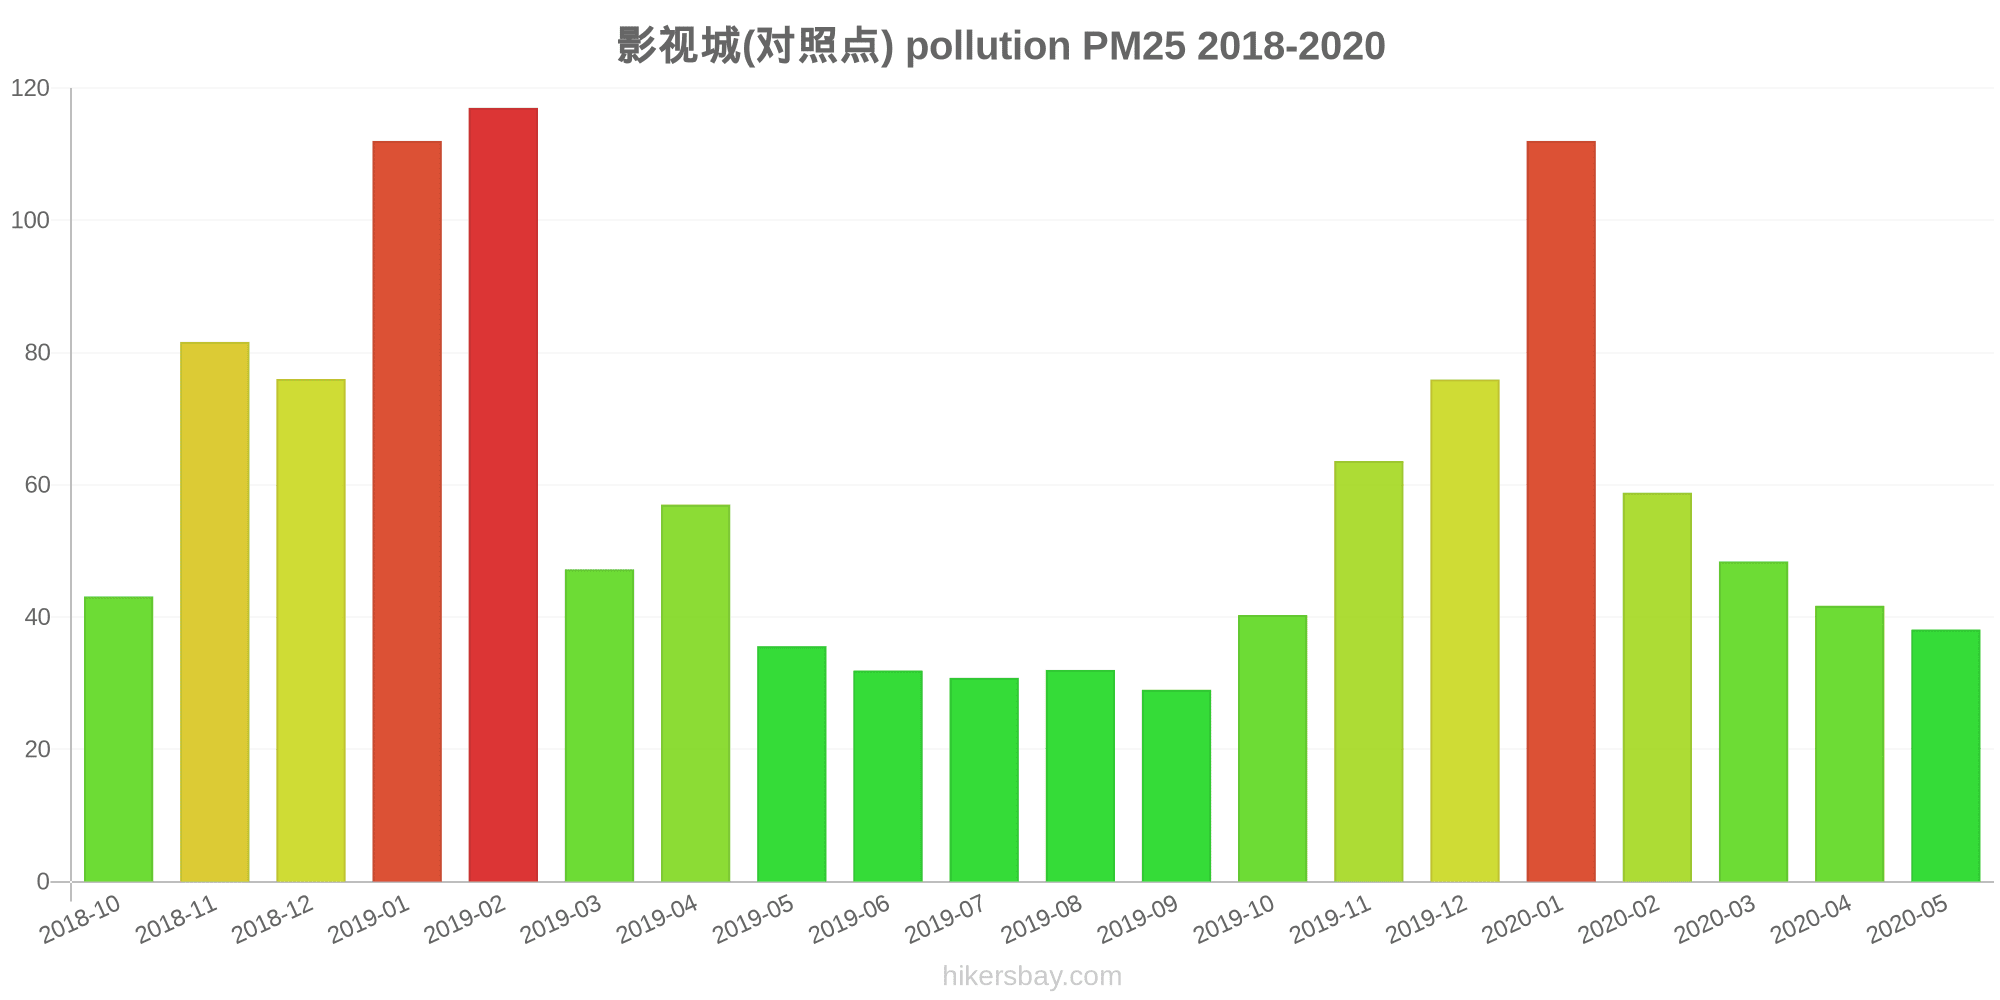
| index | 2020-05 | 2020-04 | 2020-03 | 2020-02 | 2020-01 | 2019-12 | 2019-11 | 2019-10 | 2019-09 | 2019-08 | 2019-07 | 2019-06 | 2019-05 | 2019-04 | 2019-03 | 2019-02 | 2019-01 | 2018-12 | 2018-11 | 2018-10 |
|---|---|---|---|---|---|---|---|---|---|---|---|---|---|---|---|---|---|---|---|---|
| pm25 | 38 | 42 | 48 | 59 | 112 | 76 | 64 | 40 | 29 | 32 | 31 | 32 | 36 | 57 | 47 | 117 | 112 | 76 | 82 | 43 |
| co | 892 | 688 | 681 | 987 | 1 | 1 | 866 | 728 | 686 | 646 | 511 | 565 | 442 | 942 | 680 | 1 | 1 | 1 | 1 | 889 |
| no2 | 19 | 20 | 22 | 14 | 35 | 36 | 24 | 18 | 16 | 13 | 14 | 17 | 23 | 20 | 14 | 20 | 45 | 43 | 35 | 21 |
| o3 | 155 | 135 | 103 | 94 | 63 | 60 | 86 | 107 | 171 | 143 | 195 | 196 | 164 | 130 | 113 | 91 | 56 | 46 | 79 | 109 |
| pm10 | 74 | 85 | 97 | 85 | 146 | 112 | 118 | 75 | 56 | 59 | 61 | 70 | 104 | 109 | 98 | 166 | 172 | 141 | 145 | 79 |
| so2 | 9.8 | 11 | 11 | 10 | 13 | 14 | 13 | 9.1 | 7.9 | 6.8 | 6.8 | 12 | 11 | 12 | 13 | 13 | 20 | 19 | 14 | 14 |