Luftverschmutzung in Balipucun: Echtzeit-Luft-Qualitätsindex und Smog-Alarm.
Für die Balipucun. Heute ist Donnerstag, 4. Juni 2026. Für Balipucun wurden folgende Luftverschmutzungswerte gemessen:- Feinstaub (PM10) Schwebestaub - 7 (gut)
- Feinstaub (PM2,5) - 2 (gut)
- Kohlenmonoxid (CO) - 100 (gut)
- Stickstoffdioxid (NO2) - 8 (gut)
- Ozon (O3) - 0 (gut)
- Schwefeldioxid (SO2) - 9 (gut)

Wie ist die Luftqualität Balipucun heute? Ist die Luft in Balipucun? verschmutzt. Gibt es Smog?
Wie hoch ist der PM10-Stand heute in Balipucun? (Feinstaub (PM10) Schwebestaub)
Der aktuelle Feinstaubgehalt PM10 in Balipucun is:
7 (gut)
Die höchsten PM10-Werte treten in der Regel im Monat auf: 109 (Januar 2019).
Der niedrigste Wert der Feinstaub-PM10-Belastung in Balipucun ist in der Regel in: August (36).
Wie hoch ist der aktuelle PM2,5-Wert in Balipucun? (Feinstaub (PM2,5))
Die heutige PM2.5-Stufe ist:
2 (gut)
Zum Vergleich: Der höchste PM2,5-Wert in Balipucun in den letzten 7 Tagen war: 24 (Freitag, 27. Mai 2022) und der niedrigste: 24 (Freitag, 27. Mai 2022).
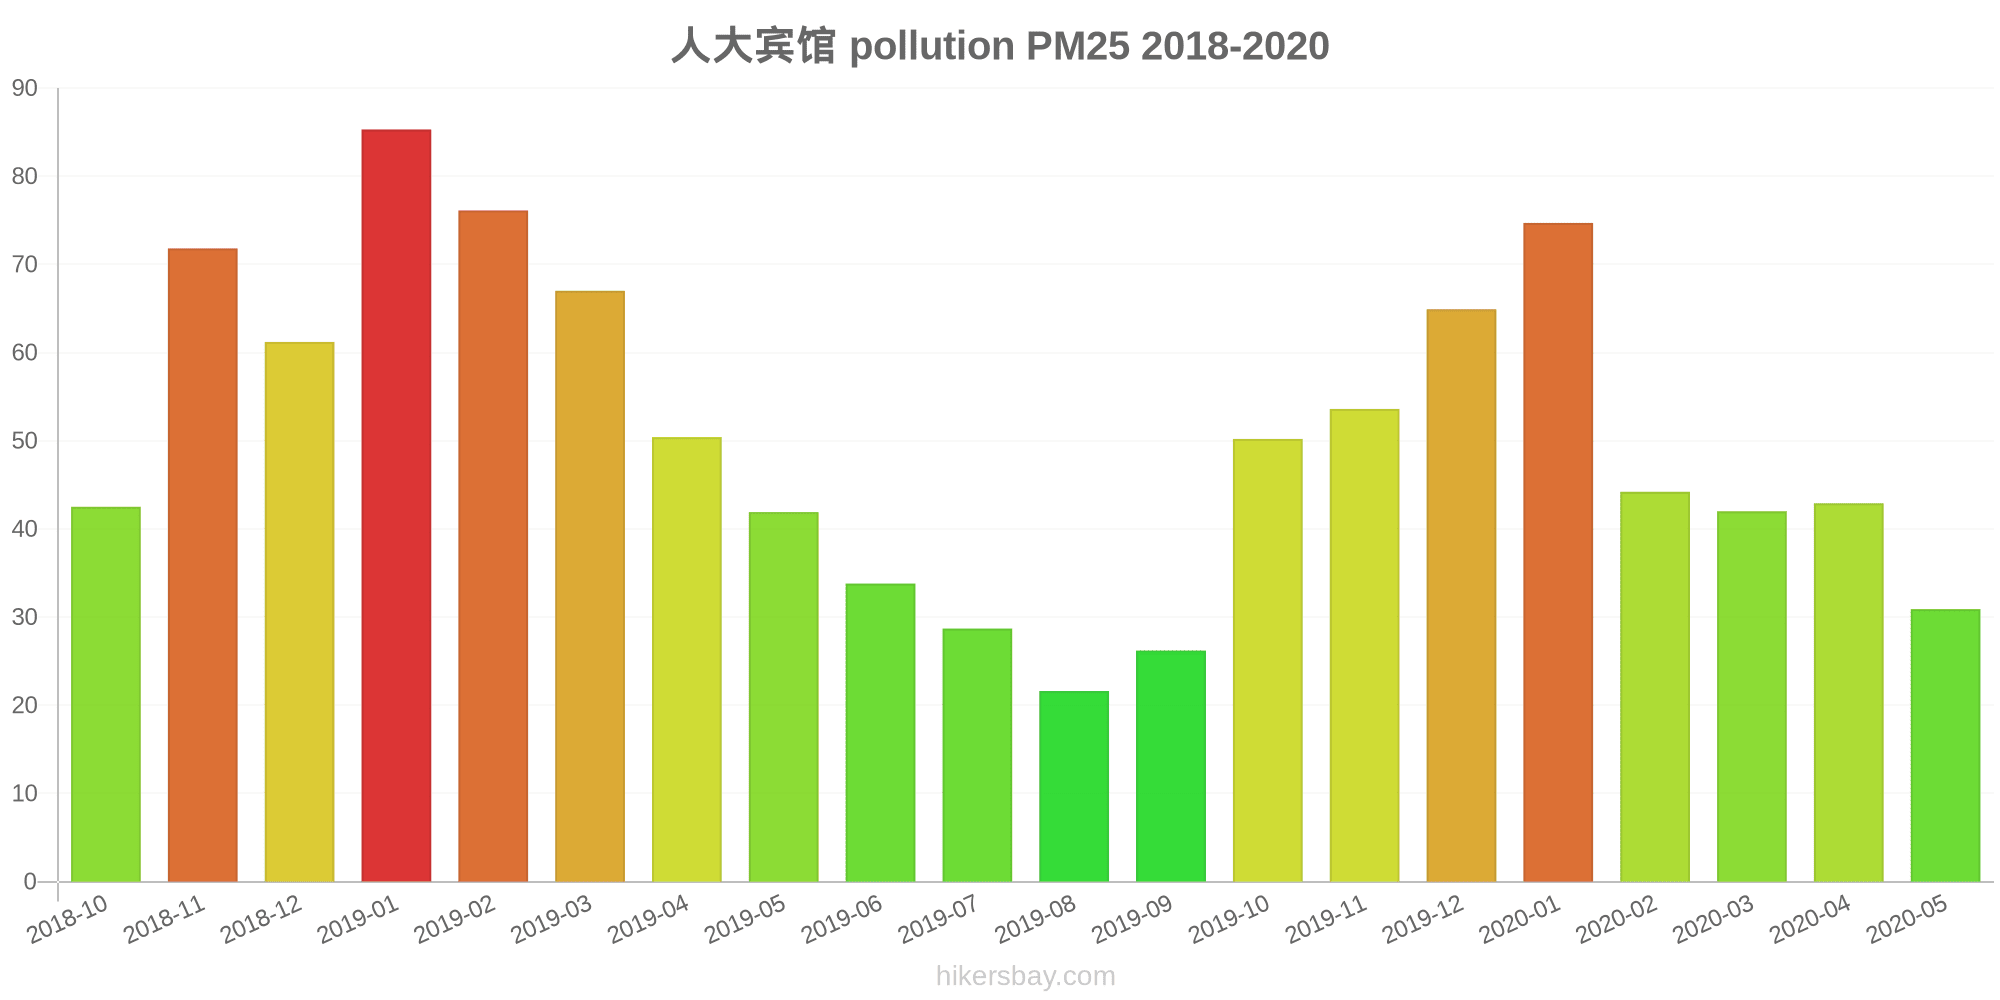
Die höchsten PM2,5-Werte wurden gemessen: 85 (Januar 2019).
Die niedrigste Feinstaubbelastung PM2,5 tritt im Monat auf: August (22).
Wie hoch ist der CO-Gehalt? (Kohlenmonoxid (CO))
100 (gut)
Wie hoch ist das NO2-Niveau? (Stickstoffdioxid (NO2))
8 (gut)
Wie ist das O3-Niveau heute in Balipucun? (Ozon (O3))
0 (gut)
Wie hoch ist die SO2-Belastung? (Schwefeldioxid (SO2))
9 (gut)
Aktuelle Daten Freitag, 27. Mai 2022, 12:00
PM10 7 (gut)
PM2,5 2 (gut)
CO 100 (gut)
NO2 8 (gut)
O3 0 (gut)
SO2 9 (gut)
Daten zur Luftverschmutzung der letzten Tage in Balipucun
index
2022-05-27
pm10
32
Moderate
pm25
24
Moderate
co
468
Good
no2
21
Good
o3
32
Good
so2
5
Good
data source »
Luftverschmutzung in Balipucun von Oktober 2018 bis Mai 2020

index
2020-05
2020-04
2020-03
2020-02
2020-01
2019-12
2019-11
2019-10
2019-09
2019-08
2019-07
2019-06
2019-05
2019-04
2019-03
2019-02
2019-01
2018-12
2018-11
2018-10
pm25
31 (Moderate)
43 (Unhealthy for Sensitive Groups)
42 (Unhealthy for Sensitive Groups)
44 (Unhealthy for Sensitive Groups)
75 (Unhealthy)
65 (Unhealthy)
54 (Unhealthy for Sensitive Groups)
50 (Unhealthy for Sensitive Groups)
26 (Moderate)
22 (Moderate)
29 (Moderate)
34 (Moderate)
42 (Unhealthy for Sensitive Groups)
50 (Unhealthy for Sensitive Groups)
67 (Unhealthy)
76 (Very Unhealthy)
85 (Very Unhealthy)
61 (Unhealthy)
72 (Unhealthy)
43 (Unhealthy for Sensitive Groups)
co
657 (Good)
717 (Good)
813 (Good)
872 (Good)
1 (Good)
1 (Good)
870 (Good)
873 (Good)
793 (Good)
725 (Good)
775 (Good)
743 (Good)
815 (Good)
782 (Good)
742 (Good)
840 (Good)
1 (Good)
731 (Good)
898 (Good)
571 (Good)
no2
21 (Good)
33 (Good)
32 (Good)
24 (Good)
42 (Moderate)
55 (Moderate)
55 (Moderate)
40 (Moderate)
25 (Good)
19 (Good)
18 (Good)
28 (Good)
39 (Good)
45 (Moderate)
54 (Moderate)
38 (Good)
48 (Moderate)
47 (Moderate)
57 (Moderate)
44 (Moderate)
o3
137 (Unhealthy for Sensitive Groups)
142 (Unhealthy for Sensitive Groups)
107 (Moderate)
91 (Moderate)
71 (Moderate)
75 (Moderate)
103 (Moderate)
131 (Unhealthy for Sensitive Groups)
155 (Unhealthy)
156 (Unhealthy)
159 (Unhealthy)
194 (Very Unhealthy)
152 (Unhealthy)
130 (Unhealthy for Sensitive Groups)
112 (Moderate)
84 (Moderate)
66 (Good)
56 (Good)
90 (Moderate)
124 (Unhealthy for Sensitive Groups)
pm10
54 (Unhealthy for Sensitive Groups)
75 (Unhealthy for Sensitive Groups)
67 (Unhealthy for Sensitive Groups)
48 (Moderate)
77 (Unhealthy for Sensitive Groups)
84 (Unhealthy)
89 (Unhealthy)
91 (Unhealthy)
45 (Moderate)
36 (Moderate)
45 (Moderate)
49 (Moderate)
62 (Unhealthy for Sensitive Groups)
74 (Unhealthy for Sensitive Groups)
100 (Unhealthy)
90 (Unhealthy)
109 (Unhealthy)
76 (Unhealthy for Sensitive Groups)
84 (Unhealthy)
65 (Unhealthy for Sensitive Groups)
so2
4.1 (Good)
10 (Good)
6 (Good)
4.6 (Good)
5 (Good)
7.6 (Good)
9.7 (Good)
10 (Good)
9.2 (Good)
8.5 (Good)
8.6 (Good)
10 (Good)
11 (Good)
9.7 (Good)
11 (Good)
6.9 (Good)
10 (Good)
9.4 (Good)
8.8 (Good)
9.7 (Good)
data source »
Chuzhou Ren Da Bin Guan
Freitag, 27. Mai 2022, 12:00
PM10 6.7 (gut)
Feinstaub (PM10) Schwebestaub
PM2,5 1.7 (gut)
Feinstaub (PM2,5)
CO 100 (gut)
Kohlenmonoxid (CO)
NO2 7.6 (gut)
Stickstoffdioxid (NO2)
O3 0.02 (gut)
Ozon (O3)
SO2 8.6 (gut)
Schwefeldioxid (SO2)
市政府原办公楼(190307启用)
Freitag, 27. Mai 2022, 12:00
PM10 6.7 (gut)
Feinstaub (PM10) Schwebestaub
PM2,5 1.7 (gut)
Feinstaub (PM2,5)
CO 100 (gut)
Kohlenmonoxid (CO)
NO2 7.6 (gut)
Stickstoffdioxid (NO2)
O3 0.02 (gut)
Ozon (O3)
SO2 8.6 (gut)
Schwefeldioxid (SO2)
Chuzhou Ren Da Bin Guan
index
2022-05-27
pm10
32
pm25
24
co
468
no2
21
o3
32
so2
4.6
市政府原办公楼(190307启用)
index
2022-05-27
pm10
32
pm25
24
co
468
no2
21
o3
32
so2
4.6
人大宾馆
2018-10 2020-05

index
2020-05
2020-04
2020-03
2020-02
2020-01
2019-12
2019-11
2019-10
2019-09
2019-08
2019-07
2019-06
2019-05
2019-04
2019-03
2019-02
2019-01
2018-12
2018-11
2018-10
pm25
31
43
42
44
75
65
54
50
26
22
29
34
42
50
67
76
85
61
72
43
co
657
717
813
872
1
1
870
873
793
725
775
743
815
782
742
840
1
731
898
571
no2
21
33
32
24
42
55
55
40
25
19
18
28
39
45
54
38
48
47
57
44
o3
137
142
107
91
71
75
103
131
155
156
159
194
152
130
112
84
66
56
90
124
pm10
54
75
67
48
77
84
89
91
45
36
45
49
62
74
100
90
109
76
84
65
so2
4.1
10
6
4.6
5
7.6
9.7
10
9.2
8.5
8.6
10
11
9.7
11
6.9
10
9.4
8.8
9.7
* Pollution data source:
https://openaq.org
(ChinaAQIData)
The data is licensed under CC-By 4.0
PM10 7 (gut)
PM2,5 2 (gut)
CO 100 (gut)
NO2 8 (gut)
O3 0 (gut)
SO2 9 (gut)
Daten zur Luftverschmutzung der letzten Tage in Balipucun
| index | 2022-05-27 |
|---|---|
| pm10 | 32 Moderate |
| pm25 | 24 Moderate |
| co | 468 Good |
| no2 | 21 Good |
| o3 | 32 Good |
| so2 | 5 Good |

| index | 2020-05 | 2020-04 | 2020-03 | 2020-02 | 2020-01 | 2019-12 | 2019-11 | 2019-10 | 2019-09 | 2019-08 | 2019-07 | 2019-06 | 2019-05 | 2019-04 | 2019-03 | 2019-02 | 2019-01 | 2018-12 | 2018-11 | 2018-10 |
|---|---|---|---|---|---|---|---|---|---|---|---|---|---|---|---|---|---|---|---|---|
| pm25 | 31 (Moderate) | 43 (Unhealthy for Sensitive Groups) | 42 (Unhealthy for Sensitive Groups) | 44 (Unhealthy for Sensitive Groups) | 75 (Unhealthy) | 65 (Unhealthy) | 54 (Unhealthy for Sensitive Groups) | 50 (Unhealthy for Sensitive Groups) | 26 (Moderate) | 22 (Moderate) | 29 (Moderate) | 34 (Moderate) | 42 (Unhealthy for Sensitive Groups) | 50 (Unhealthy for Sensitive Groups) | 67 (Unhealthy) | 76 (Very Unhealthy) | 85 (Very Unhealthy) | 61 (Unhealthy) | 72 (Unhealthy) | 43 (Unhealthy for Sensitive Groups) |
| co | 657 (Good) | 717 (Good) | 813 (Good) | 872 (Good) | 1 (Good) | 1 (Good) | 870 (Good) | 873 (Good) | 793 (Good) | 725 (Good) | 775 (Good) | 743 (Good) | 815 (Good) | 782 (Good) | 742 (Good) | 840 (Good) | 1 (Good) | 731 (Good) | 898 (Good) | 571 (Good) |
| no2 | 21 (Good) | 33 (Good) | 32 (Good) | 24 (Good) | 42 (Moderate) | 55 (Moderate) | 55 (Moderate) | 40 (Moderate) | 25 (Good) | 19 (Good) | 18 (Good) | 28 (Good) | 39 (Good) | 45 (Moderate) | 54 (Moderate) | 38 (Good) | 48 (Moderate) | 47 (Moderate) | 57 (Moderate) | 44 (Moderate) |
| o3 | 137 (Unhealthy for Sensitive Groups) | 142 (Unhealthy for Sensitive Groups) | 107 (Moderate) | 91 (Moderate) | 71 (Moderate) | 75 (Moderate) | 103 (Moderate) | 131 (Unhealthy for Sensitive Groups) | 155 (Unhealthy) | 156 (Unhealthy) | 159 (Unhealthy) | 194 (Very Unhealthy) | 152 (Unhealthy) | 130 (Unhealthy for Sensitive Groups) | 112 (Moderate) | 84 (Moderate) | 66 (Good) | 56 (Good) | 90 (Moderate) | 124 (Unhealthy for Sensitive Groups) |
| pm10 | 54 (Unhealthy for Sensitive Groups) | 75 (Unhealthy for Sensitive Groups) | 67 (Unhealthy for Sensitive Groups) | 48 (Moderate) | 77 (Unhealthy for Sensitive Groups) | 84 (Unhealthy) | 89 (Unhealthy) | 91 (Unhealthy) | 45 (Moderate) | 36 (Moderate) | 45 (Moderate) | 49 (Moderate) | 62 (Unhealthy for Sensitive Groups) | 74 (Unhealthy for Sensitive Groups) | 100 (Unhealthy) | 90 (Unhealthy) | 109 (Unhealthy) | 76 (Unhealthy for Sensitive Groups) | 84 (Unhealthy) | 65 (Unhealthy for Sensitive Groups) |
| so2 | 4.1 (Good) | 10 (Good) | 6 (Good) | 4.6 (Good) | 5 (Good) | 7.6 (Good) | 9.7 (Good) | 10 (Good) | 9.2 (Good) | 8.5 (Good) | 8.6 (Good) | 10 (Good) | 11 (Good) | 9.7 (Good) | 11 (Good) | 6.9 (Good) | 10 (Good) | 9.4 (Good) | 8.8 (Good) | 9.7 (Good) |
PM10 6.7 (gut)
Feinstaub (PM10) SchwebestaubPM2,5 1.7 (gut)
Feinstaub (PM2,5)CO 100 (gut)
Kohlenmonoxid (CO)NO2 7.6 (gut)
Stickstoffdioxid (NO2)O3 0.02 (gut)
Ozon (O3)SO2 8.6 (gut)
Schwefeldioxid (SO2)PM10 6.7 (gut)
Feinstaub (PM10) SchwebestaubPM2,5 1.7 (gut)
Feinstaub (PM2,5)CO 100 (gut)
Kohlenmonoxid (CO)NO2 7.6 (gut)
Stickstoffdioxid (NO2)O3 0.02 (gut)
Ozon (O3)SO2 8.6 (gut)
Schwefeldioxid (SO2)Chuzhou Ren Da Bin Guan
| index | 2022-05-27 |
|---|---|
| pm10 | 32 |
| pm25 | 24 |
| co | 468 |
| no2 | 21 |
| o3 | 32 |
| so2 | 4.6 |
市政府原办公楼(190307启用)
| index | 2022-05-27 |
|---|---|
| pm10 | 32 |
| pm25 | 24 |
| co | 468 |
| no2 | 21 |
| o3 | 32 |
| so2 | 4.6 |
人大宾馆
| index | 2020-05 | 2020-04 | 2020-03 | 2020-02 | 2020-01 | 2019-12 | 2019-11 | 2019-10 | 2019-09 | 2019-08 | 2019-07 | 2019-06 | 2019-05 | 2019-04 | 2019-03 | 2019-02 | 2019-01 | 2018-12 | 2018-11 | 2018-10 |
|---|---|---|---|---|---|---|---|---|---|---|---|---|---|---|---|---|---|---|---|---|
| pm25 | 31 | 43 | 42 | 44 | 75 | 65 | 54 | 50 | 26 | 22 | 29 | 34 | 42 | 50 | 67 | 76 | 85 | 61 | 72 | 43 |
| co | 657 | 717 | 813 | 872 | 1 | 1 | 870 | 873 | 793 | 725 | 775 | 743 | 815 | 782 | 742 | 840 | 1 | 731 | 898 | 571 |
| no2 | 21 | 33 | 32 | 24 | 42 | 55 | 55 | 40 | 25 | 19 | 18 | 28 | 39 | 45 | 54 | 38 | 48 | 47 | 57 | 44 |
| o3 | 137 | 142 | 107 | 91 | 71 | 75 | 103 | 131 | 155 | 156 | 159 | 194 | 152 | 130 | 112 | 84 | 66 | 56 | 90 | 124 |
| pm10 | 54 | 75 | 67 | 48 | 77 | 84 | 89 | 91 | 45 | 36 | 45 | 49 | 62 | 74 | 100 | 90 | 109 | 76 | 84 | 65 |
| so2 | 4.1 | 10 | 6 | 4.6 | 5 | 7.6 | 9.7 | 10 | 9.2 | 8.5 | 8.6 | 10 | 11 | 9.7 | 11 | 6.9 | 10 | 9.4 | 8.8 | 9.7 |