Luftverschmutzung in Wulimiao: Echtzeit-Luft-Qualitätsindex und Smog-Alarm.
Für die Wulimiao. Heute ist Samstag, 13. Juni 2026. Für Wulimiao wurden folgende Luftverschmutzungswerte gemessen:- Feinstaub (PM10) Schwebestaub - 179 (Sehr schlecht Gefährlich)
- Feinstaub (PM2,5) - 35 (Ungesund für sensible Gruppen)
- Ozon (O3) - 0 (gut)
- Stickstoffdioxid (NO2) - 0 (gut)
- Schwefeldioxid (SO2) - 0 (gut)

Wie ist die Luftqualität Wulimiao heute? Ist die Luft in Wulimiao? verschmutzt. Gibt es Smog?
Wie hoch ist der PM10-Stand heute in Wulimiao? (Feinstaub (PM10) Schwebestaub)
Der aktuelle Feinstaubgehalt PM10 in Wulimiao is:
179 (Sehr schlecht Gefährlich)
Die höchsten PM10-Werte treten in der Regel im Monat auf: 180 (Dezember 2018).
Der niedrigste Wert der Feinstaub-PM10-Belastung in Wulimiao ist in der Regel in: August (45).
Wie hoch ist der aktuelle PM2,5-Wert in Wulimiao? (Feinstaub (PM2,5))
Die heutige PM2.5-Stufe ist:
35 (Ungesund für sensible Gruppen)
Zum Vergleich: Der höchste PM2,5-Wert in Wulimiao in den letzten 7 Tagen war: 56 (Freitag, 27. Mai 2022) und der niedrigste: 56 (Freitag, 27. Mai 2022).
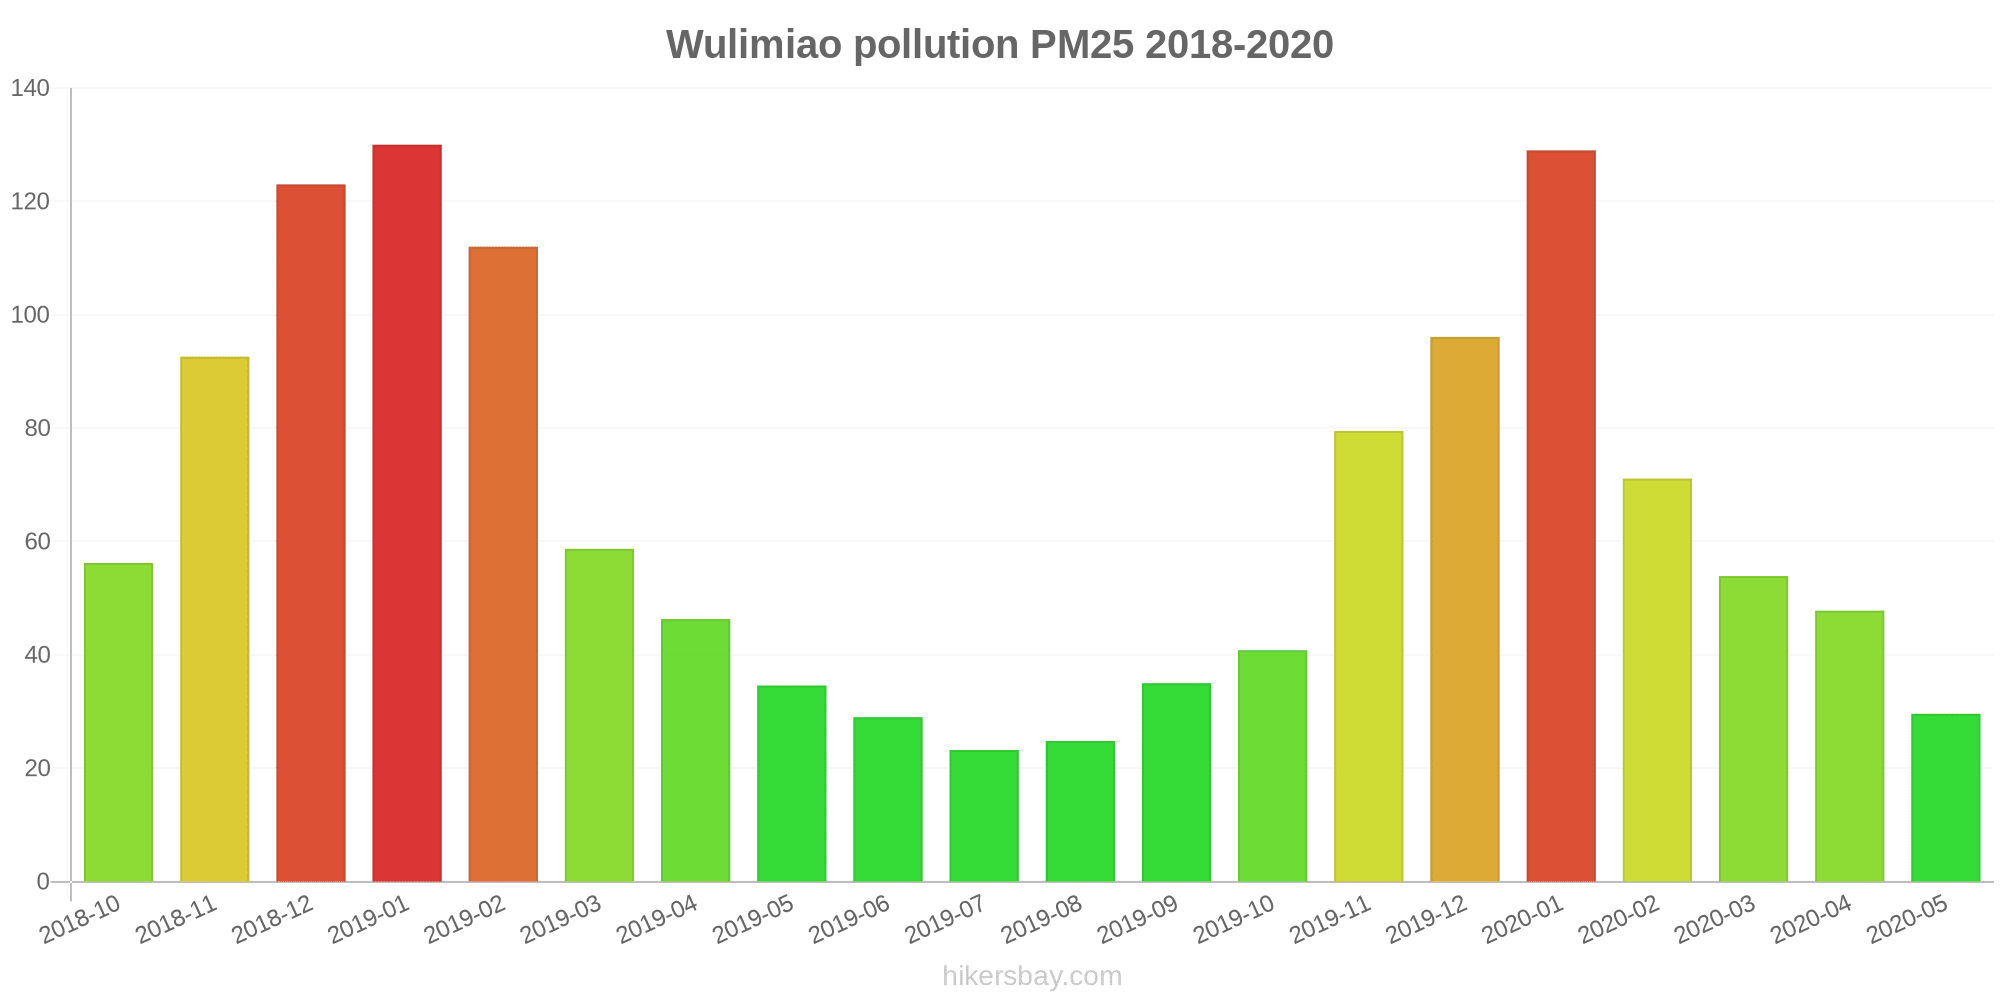
Die höchsten PM2,5-Werte wurden gemessen: 130 (Januar 2019).
Die niedrigste Feinstaubbelastung PM2,5 tritt im Monat auf: Juli (23).
Wie ist das O3-Niveau heute in Wulimiao? (Ozon (O3))
0 (gut)
Wie hoch ist das NO2-Niveau? (Stickstoffdioxid (NO2))
0 (gut)
Wie hoch ist die SO2-Belastung? (Schwefeldioxid (SO2))
0 (gut)
Aktuelle Daten Freitag, 27. Mai 2022, 12:00
PM10 179 (Sehr schlecht Gefährlich)
PM2,5 35 (Ungesund für sensible Gruppen)
O3 0 (gut)
NO2 0 (gut)
SO2 0 (gut)
Daten zur Luftverschmutzung der letzten Tage in Wulimiao
index
2022-05-27
pm10
56
Unhealthy for Sensitive Groups
pm25
56
Unhealthy
o3
0
Good
no2
0
Good
so2
0
Good
data source »
Luftverschmutzung in Wulimiao von Oktober 2018 bis Mai 2020

index
2020-05
2020-04
2020-03
2020-02
2020-01
2019-12
2019-11
2019-10
2019-09
2019-08
2019-07
2019-06
2019-05
2019-04
2019-03
2019-02
2019-01
2018-12
2018-11
2018-10
pm25
30 (Moderate)
48 (Unhealthy for Sensitive Groups)
54 (Unhealthy for Sensitive Groups)
71 (Unhealthy)
129 (Very bad Hazardous)
96 (Very Unhealthy)
80 (Very Unhealthy)
41 (Unhealthy for Sensitive Groups)
35 (Unhealthy for Sensitive Groups)
25 (Moderate)
23 (Moderate)
29 (Moderate)
35 (Moderate)
46 (Unhealthy for Sensitive Groups)
59 (Unhealthy)
112 (Very bad Hazardous)
130 (Very bad Hazardous)
123 (Very bad Hazardous)
93 (Very Unhealthy)
56 (Unhealthy)
co
724 (Good)
654 (Good)
693 (Good)
774 (Good)
1 (Good)
966 (Good)
912 (Good)
656 (Good)
740 (Good)
531 (Good)
486 (Good)
568 (Good)
613 (Good)
685 (Good)
640 (Good)
899 (Good)
1 (Good)
1 (Good)
1 (Good)
507 (Good)
no2
20 (Good)
31 (Good)
24 (Good)
14 (Good)
33 (Good)
44 (Moderate)
46 (Moderate)
32 (Good)
24 (Good)
17 (Good)
20 (Good)
18 (Good)
20 (Good)
20 (Good)
28 (Good)
26 (Good)
41 (Moderate)
51 (Moderate)
46 (Moderate)
43 (Moderate)
o3
136 (Unhealthy for Sensitive Groups)
132 (Unhealthy for Sensitive Groups)
102 (Moderate)
85 (Moderate)
69 (Good)
57 (Good)
94 (Moderate)
115 (Moderate)
159 (Unhealthy)
157 (Unhealthy)
173 (Unhealthy)
188 (Very Unhealthy)
154 (Unhealthy)
128 (Unhealthy for Sensitive Groups)
112 (Moderate)
88 (Moderate)
71 (Moderate)
45 (Good)
89 (Moderate)
115 (Moderate)
pm10
63 (Unhealthy for Sensitive Groups)
85 (Unhealthy)
94 (Unhealthy)
81 (Unhealthy)
142 (Very Unhealthy)
124 (Very Unhealthy)
135 (Very Unhealthy)
93 (Unhealthy)
80 (Unhealthy for Sensitive Groups)
45 (Moderate)
45 (Moderate)
63 (Unhealthy for Sensitive Groups)
92 (Unhealthy)
99 (Unhealthy)
109 (Unhealthy)
138 (Very Unhealthy)
167 (Very bad Hazardous)
180 (Very bad Hazardous)
152 (Very bad Hazardous)
113 (Very Unhealthy)
so2
7.2 (Good)
12 (Good)
9.7 (Good)
6.8 (Good)
8.1 (Good)
8.5 (Good)
10 (Good)
8.9 (Good)
8.1 (Good)
8 (Good)
6.8 (Good)
8.4 (Good)
8.7 (Good)
9.3 (Good)
11 (Good)
9.9 (Good)
13 (Good)
15 (Good)
13 (Good)
17 (Good)
data source »
水利局
Freitag, 27. Mai 2022, 12:00
PM10 179 (Sehr schlecht Gefährlich)
Feinstaub (PM10) Schwebestaub
PM2,5 35 (Ungesund für sensible Gruppen)
Feinstaub (PM2,5)
O3 0.04 (gut)
Ozon (O3)
NO2 0 (gut)
Stickstoffdioxid (NO2)
SO2 0 (gut)
Schwefeldioxid (SO2)
水利局
index
2022-05-27
pm10
56
pm25
56
o3
0.03
no2
0
so2
0
水利局
2018-10 2020-05

index
2020-05
2020-04
2020-03
2020-02
2020-01
2019-12
2019-11
2019-10
2019-09
2019-08
2019-07
2019-06
2019-05
2019-04
2019-03
2019-02
2019-01
2018-12
2018-11
2018-10
pm25
30
48
54
71
129
96
80
41
35
25
23
29
35
46
59
112
130
123
93
56
co
724
654
693
774
1
966
912
656
740
531
486
568
613
685
640
899
1
1
1
507
no2
20
31
24
14
33
44
46
32
24
17
20
18
20
20
28
26
41
51
46
43
o3
136
132
102
85
69
57
94
115
159
157
173
188
154
128
112
88
71
45
89
115
pm10
63
85
94
81
142
124
135
93
80
45
45
63
92
99
109
138
167
180
152
113
so2
7.2
12
9.7
6.8
8.1
8.5
10
8.9
8.1
8
6.8
8.4
8.7
9.3
11
9.9
13
15
13
17
* Pollution data source:
https://openaq.org
(ChinaAQIData)
The data is licensed under CC-By 4.0
PM10 179 (Sehr schlecht Gefährlich)
PM2,5 35 (Ungesund für sensible Gruppen)
O3 0 (gut)
NO2 0 (gut)
SO2 0 (gut)
Daten zur Luftverschmutzung der letzten Tage in Wulimiao
| index | 2022-05-27 |
|---|---|
| pm10 | 56 Unhealthy for Sensitive Groups |
| pm25 | 56 Unhealthy |
| o3 | 0 Good |
| no2 | 0 Good |
| so2 | 0 Good |
| index | 2020-05 | 2020-04 | 2020-03 | 2020-02 | 2020-01 | 2019-12 | 2019-11 | 2019-10 | 2019-09 | 2019-08 | 2019-07 | 2019-06 | 2019-05 | 2019-04 | 2019-03 | 2019-02 | 2019-01 | 2018-12 | 2018-11 | 2018-10 |
|---|---|---|---|---|---|---|---|---|---|---|---|---|---|---|---|---|---|---|---|---|
| pm25 | 30 (Moderate) | 48 (Unhealthy for Sensitive Groups) | 54 (Unhealthy for Sensitive Groups) | 71 (Unhealthy) | 129 (Very bad Hazardous) | 96 (Very Unhealthy) | 80 (Very Unhealthy) | 41 (Unhealthy for Sensitive Groups) | 35 (Unhealthy for Sensitive Groups) | 25 (Moderate) | 23 (Moderate) | 29 (Moderate) | 35 (Moderate) | 46 (Unhealthy for Sensitive Groups) | 59 (Unhealthy) | 112 (Very bad Hazardous) | 130 (Very bad Hazardous) | 123 (Very bad Hazardous) | 93 (Very Unhealthy) | 56 (Unhealthy) |
| co | 724 (Good) | 654 (Good) | 693 (Good) | 774 (Good) | 1 (Good) | 966 (Good) | 912 (Good) | 656 (Good) | 740 (Good) | 531 (Good) | 486 (Good) | 568 (Good) | 613 (Good) | 685 (Good) | 640 (Good) | 899 (Good) | 1 (Good) | 1 (Good) | 1 (Good) | 507 (Good) |
| no2 | 20 (Good) | 31 (Good) | 24 (Good) | 14 (Good) | 33 (Good) | 44 (Moderate) | 46 (Moderate) | 32 (Good) | 24 (Good) | 17 (Good) | 20 (Good) | 18 (Good) | 20 (Good) | 20 (Good) | 28 (Good) | 26 (Good) | 41 (Moderate) | 51 (Moderate) | 46 (Moderate) | 43 (Moderate) |
| o3 | 136 (Unhealthy for Sensitive Groups) | 132 (Unhealthy for Sensitive Groups) | 102 (Moderate) | 85 (Moderate) | 69 (Good) | 57 (Good) | 94 (Moderate) | 115 (Moderate) | 159 (Unhealthy) | 157 (Unhealthy) | 173 (Unhealthy) | 188 (Very Unhealthy) | 154 (Unhealthy) | 128 (Unhealthy for Sensitive Groups) | 112 (Moderate) | 88 (Moderate) | 71 (Moderate) | 45 (Good) | 89 (Moderate) | 115 (Moderate) |
| pm10 | 63 (Unhealthy for Sensitive Groups) | 85 (Unhealthy) | 94 (Unhealthy) | 81 (Unhealthy) | 142 (Very Unhealthy) | 124 (Very Unhealthy) | 135 (Very Unhealthy) | 93 (Unhealthy) | 80 (Unhealthy for Sensitive Groups) | 45 (Moderate) | 45 (Moderate) | 63 (Unhealthy for Sensitive Groups) | 92 (Unhealthy) | 99 (Unhealthy) | 109 (Unhealthy) | 138 (Very Unhealthy) | 167 (Very bad Hazardous) | 180 (Very bad Hazardous) | 152 (Very bad Hazardous) | 113 (Very Unhealthy) |
| so2 | 7.2 (Good) | 12 (Good) | 9.7 (Good) | 6.8 (Good) | 8.1 (Good) | 8.5 (Good) | 10 (Good) | 8.9 (Good) | 8.1 (Good) | 8 (Good) | 6.8 (Good) | 8.4 (Good) | 8.7 (Good) | 9.3 (Good) | 11 (Good) | 9.9 (Good) | 13 (Good) | 15 (Good) | 13 (Good) | 17 (Good) |
PM10 179 (Sehr schlecht Gefährlich)
Feinstaub (PM10) SchwebestaubPM2,5 35 (Ungesund für sensible Gruppen)
Feinstaub (PM2,5)O3 0.04 (gut)
Ozon (O3)NO2 0 (gut)
Stickstoffdioxid (NO2)SO2 0 (gut)
Schwefeldioxid (SO2)水利局
| index | 2022-05-27 |
|---|---|
| pm10 | 56 |
| pm25 | 56 |
| o3 | 0.03 |
| no2 | 0 |
| so2 | 0 |
水利局
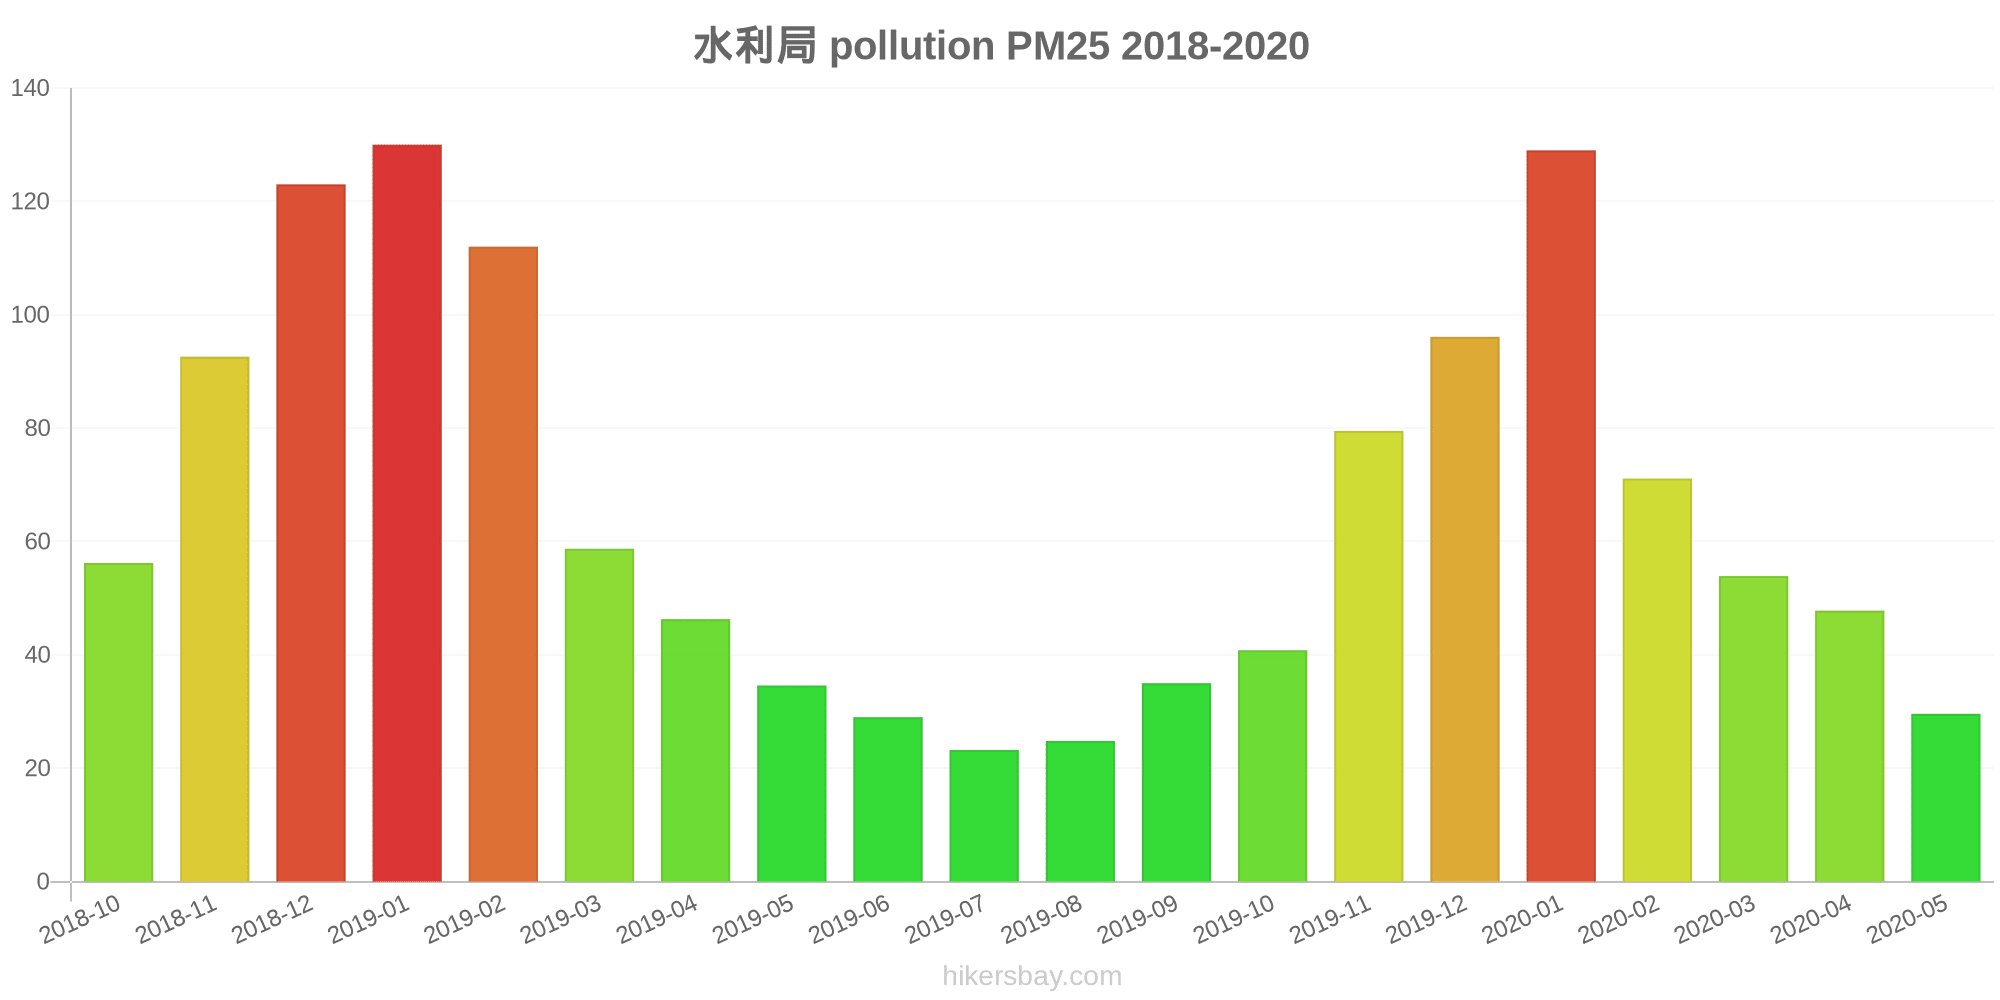
| index | 2020-05 | 2020-04 | 2020-03 | 2020-02 | 2020-01 | 2019-12 | 2019-11 | 2019-10 | 2019-09 | 2019-08 | 2019-07 | 2019-06 | 2019-05 | 2019-04 | 2019-03 | 2019-02 | 2019-01 | 2018-12 | 2018-11 | 2018-10 |
|---|---|---|---|---|---|---|---|---|---|---|---|---|---|---|---|---|---|---|---|---|
| pm25 | 30 | 48 | 54 | 71 | 129 | 96 | 80 | 41 | 35 | 25 | 23 | 29 | 35 | 46 | 59 | 112 | 130 | 123 | 93 | 56 |
| co | 724 | 654 | 693 | 774 | 1 | 966 | 912 | 656 | 740 | 531 | 486 | 568 | 613 | 685 | 640 | 899 | 1 | 1 | 1 | 507 |
| no2 | 20 | 31 | 24 | 14 | 33 | 44 | 46 | 32 | 24 | 17 | 20 | 18 | 20 | 20 | 28 | 26 | 41 | 51 | 46 | 43 |
| o3 | 136 | 132 | 102 | 85 | 69 | 57 | 94 | 115 | 159 | 157 | 173 | 188 | 154 | 128 | 112 | 88 | 71 | 45 | 89 | 115 |
| pm10 | 63 | 85 | 94 | 81 | 142 | 124 | 135 | 93 | 80 | 45 | 45 | 63 | 92 | 99 | 109 | 138 | 167 | 180 | 152 | 113 |
| so2 | 7.2 | 12 | 9.7 | 6.8 | 8.1 | 8.5 | 10 | 8.9 | 8.1 | 8 | 6.8 | 8.4 | 8.7 | 9.3 | 11 | 9.9 | 13 | 15 | 13 | 17 |