Luftverschmutzung in Zhonghutong: Echtzeit-Luft-Qualitätsindex und Smog-Alarm.
Für die Zhonghutong. Heute ist Donnerstag, 4. Juni 2026. Für Zhonghutong wurden folgende Luftverschmutzungswerte gemessen:- Feinstaub (PM10) Schwebestaub - 7 (gut)
- Feinstaub (PM2,5) - 2 (gut)
- Kohlenmonoxid (CO) - 100 (gut)
- Stickstoffdioxid (NO2) - 8 (gut)
- Ozon (O3) - 0 (gut)
- Schwefeldioxid (SO2) - 9 (gut)

Wie ist die Luftqualität Zhonghutong heute? Ist die Luft in Zhonghutong? verschmutzt. Gibt es Smog?
Wie hoch ist der PM10-Stand heute in Zhonghutong? (Feinstaub (PM10) Schwebestaub)
Der aktuelle Feinstaubgehalt PM10 in Zhonghutong is:
7 (gut)
Die höchsten PM10-Werte treten in der Regel im Monat auf: 125 (Dezember 2018).
Der niedrigste Wert der Feinstaub-PM10-Belastung in Zhonghutong ist in der Regel in: August (31).
Wie hoch ist der aktuelle PM2,5-Wert in Zhonghutong? (Feinstaub (PM2,5))
Die heutige PM2.5-Stufe ist:
2 (gut)
Zum Vergleich: Der höchste PM2,5-Wert in Zhonghutong in den letzten 7 Tagen war: 24 (Freitag, 27. Mai 2022) und der niedrigste: 24 (Freitag, 27. Mai 2022).
Die höchsten PM2,5-Werte wurden gemessen: 60 (Januar 2020).
Die niedrigste Feinstaubbelastung PM2,5 tritt im Monat auf: August (13).
Wie hoch ist der CO-Gehalt? (Kohlenmonoxid (CO))
100 (gut)
Wie hoch ist das NO2-Niveau? (Stickstoffdioxid (NO2))
8 (gut)
Wie ist das O3-Niveau heute in Zhonghutong? (Ozon (O3))
0 (gut)
Wie hoch ist die SO2-Belastung? (Schwefeldioxid (SO2))
9 (gut)
Aktuelle Daten Freitag, 27. Mai 2022, 12:00
PM10 7 (gut)
PM2,5 2 (gut)
CO 100 (gut)
NO2 8 (gut)
O3 0 (gut)
SO2 9 (gut)
Daten zur Luftverschmutzung der letzten Tage in Zhonghutong
index
2022-05-27
pm10
32
Moderate
pm25
24
Moderate
co
468
Good
no2
21
Good
o3
32
Good
so2
5
Good
data source »
Luftverschmutzung in Zhonghutong von Oktober 2018 bis Mai 2020
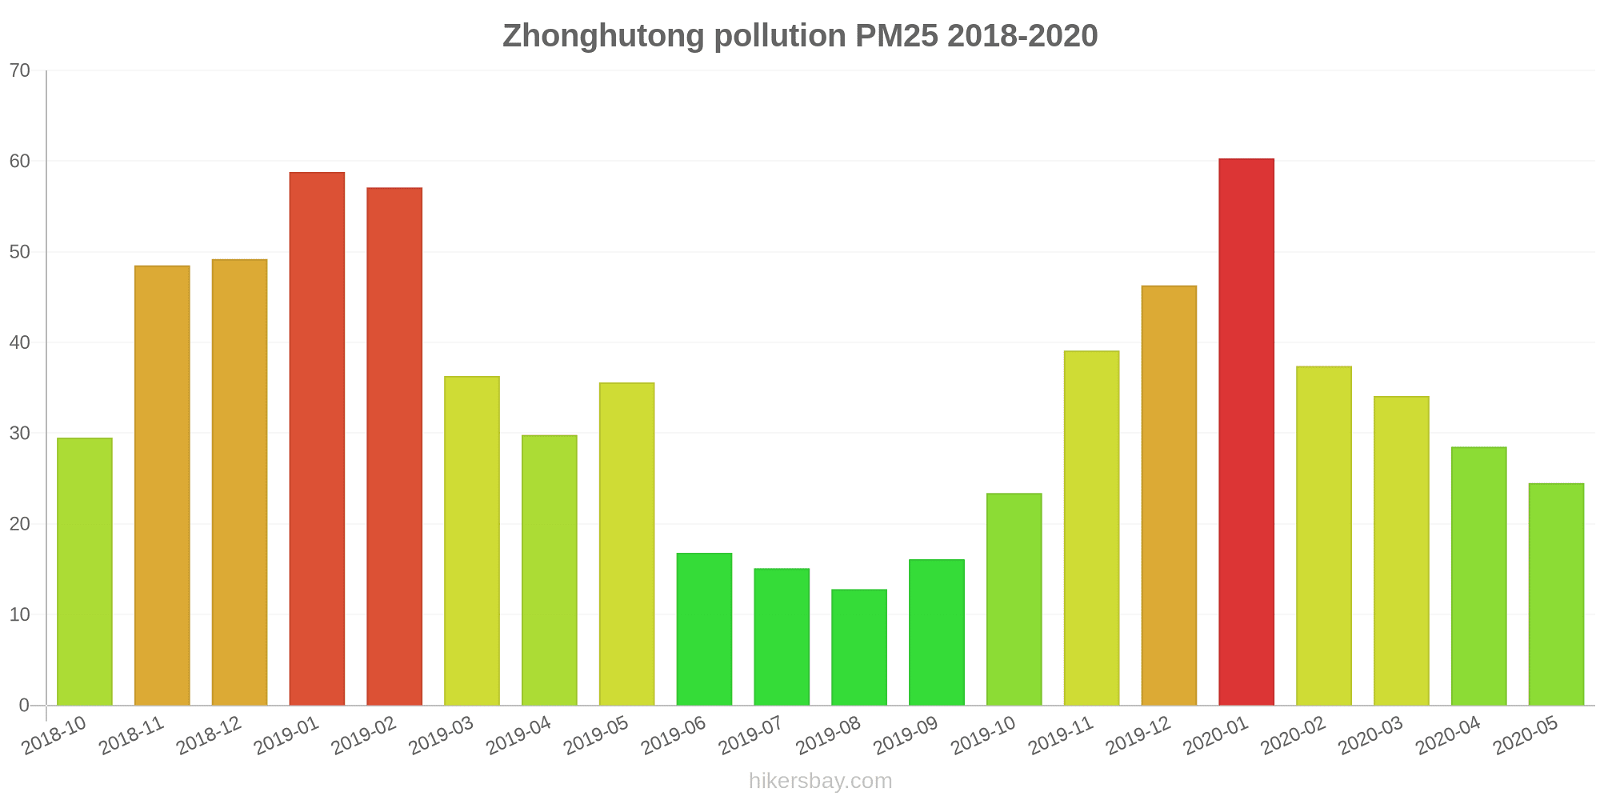
index
2020-05
2020-04
2020-03
2020-02
2020-01
2019-12
2019-11
2019-10
2019-09
2019-08
2019-07
2019-06
2019-05
2019-04
2019-03
2019-02
2019-01
2018-12
2018-11
2018-10
pm25
25 (Moderate)
29 (Moderate)
34 (Moderate)
37 (Unhealthy for Sensitive Groups)
60 (Unhealthy)
46 (Unhealthy for Sensitive Groups)
39 (Unhealthy for Sensitive Groups)
23 (Moderate)
16 (Moderate)
13 (Good)
15 (Moderate)
17 (Moderate)
36 (Unhealthy for Sensitive Groups)
30 (Moderate)
36 (Unhealthy for Sensitive Groups)
57 (Unhealthy)
59 (Unhealthy)
49 (Unhealthy for Sensitive Groups)
49 (Unhealthy for Sensitive Groups)
30 (Moderate)
co
707 (Good)
763 (Good)
772 (Good)
964 (Good)
1 (Good)
1 (Good)
1 (Good)
849 (Good)
728 (Good)
599 (Good)
604 (Good)
679 (Good)
661 (Good)
678 (Good)
699 (Good)
966 (Good)
1 (Good)
971 (Good)
951 (Good)
589 (Good)
no2
17 (Good)
17 (Good)
16 (Good)
13 (Good)
26 (Good)
33 (Good)
29 (Good)
21 (Good)
14 (Good)
12 (Good)
13 (Good)
15 (Good)
18 (Good)
18 (Good)
22 (Good)
22 (Good)
35 (Good)
33 (Good)
31 (Good)
23 (Good)
o3
130 (Unhealthy for Sensitive Groups)
130 (Unhealthy for Sensitive Groups)
107 (Moderate)
96 (Moderate)
86 (Moderate)
80 (Moderate)
78 (Moderate)
96 (Moderate)
123 (Unhealthy for Sensitive Groups)
126 (Unhealthy for Sensitive Groups)
142 (Unhealthy for Sensitive Groups)
140 (Unhealthy for Sensitive Groups)
128 (Unhealthy for Sensitive Groups)
130 (Unhealthy for Sensitive Groups)
107 (Moderate)
94 (Moderate)
88 (Moderate)
69 (Good)
86 (Moderate)
94 (Moderate)
pm10
66 (Unhealthy for Sensitive Groups)
62 (Unhealthy for Sensitive Groups)
97 (Unhealthy)
70 (Unhealthy for Sensitive Groups)
80 (Unhealthy for Sensitive Groups)
75 (Unhealthy for Sensitive Groups)
69 (Unhealthy for Sensitive Groups)
62 (Unhealthy for Sensitive Groups)
34 (Moderate)
31 (Moderate)
38 (Moderate)
41 (Moderate)
104 (Unhealthy)
79 (Unhealthy for Sensitive Groups)
84 (Unhealthy)
91 (Unhealthy)
94 (Unhealthy)
125 (Very Unhealthy)
118 (Very Unhealthy)
63 (Unhealthy for Sensitive Groups)
so2
9.7 (Good)
10 (Good)
12 (Good)
14 (Good)
22 (Good)
23 (Good)
18 (Good)
8.8 (Good)
8 (Good)
7.8 (Good)
6.5 (Good)
6.2 (Good)
6 (Good)
5.9 (Good)
13 (Good)
17 (Good)
33 (Good)
29 (Good)
26 (Good)
6.7 (Good)
data source »
粮贸总公司
Freitag, 27. Mai 2022, 12:00
PM10 6.7 (gut)
Feinstaub (PM10) Schwebestaub
PM2,5 1.7 (gut)
Feinstaub (PM2,5)
CO 100 (gut)
Kohlenmonoxid (CO)
NO2 7.6 (gut)
Stickstoffdioxid (NO2)
O3 0.02 (gut)
Ozon (O3)
SO2 8.6 (gut)
Schwefeldioxid (SO2)
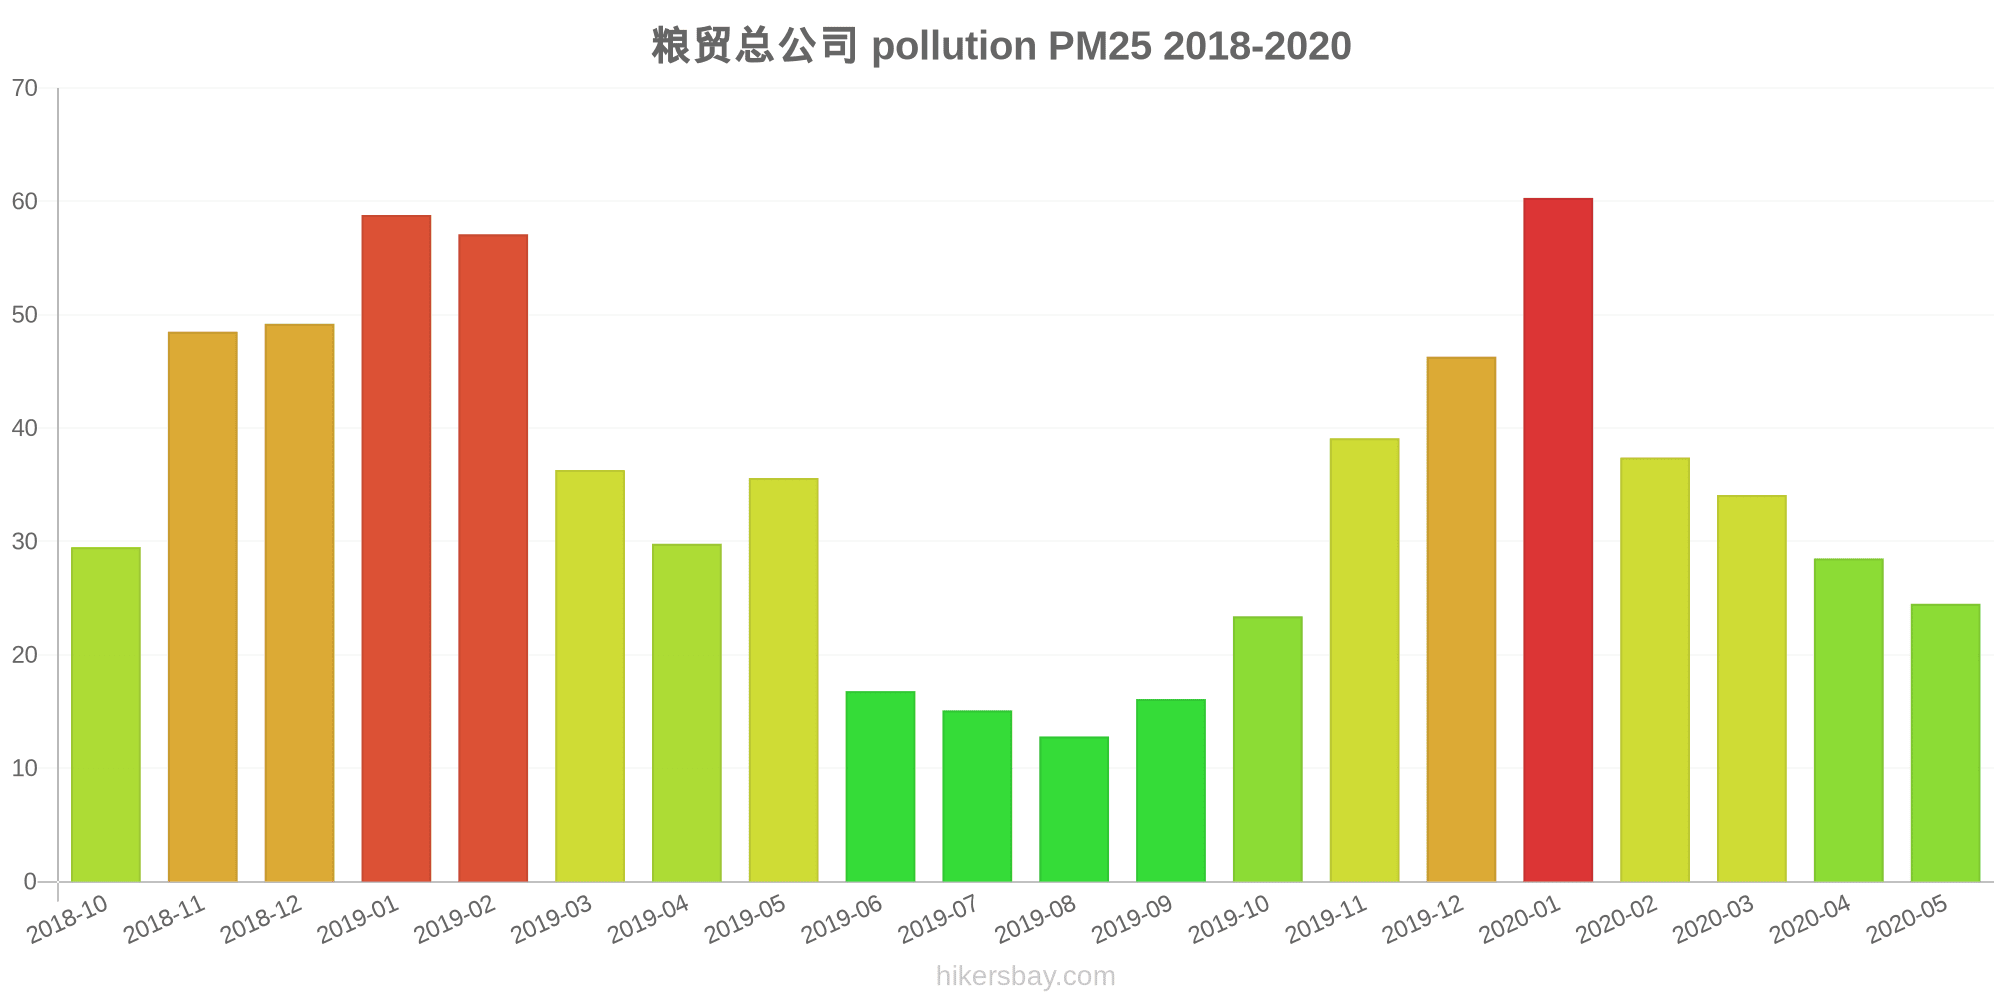
粮贸总公司
index
2022-05-27
pm10
32
pm25
24
co
468
no2
21
o3
32
so2
4.6
粮贸总公司
2018-10 2020-05

index
2020-05
2020-04
2020-03
2020-02
2020-01
2019-12
2019-11
2019-10
2019-09
2019-08
2019-07
2019-06
2019-05
2019-04
2019-03
2019-02
2019-01
2018-12
2018-11
2018-10
pm25
25
29
34
37
60
46
39
23
16
13
15
17
36
30
36
57
59
49
49
30
co
707
763
772
964
1
1
1
849
728
599
604
679
661
678
699
966
1
971
951
589
no2
17
17
16
13
26
33
29
21
14
12
13
15
18
18
22
22
35
33
31
23
o3
130
130
107
96
86
80
78
96
123
126
142
140
128
130
107
94
88
69
86
94
pm10
66
62
97
70
80
75
69
62
34
31
38
41
104
79
84
91
94
125
118
63
so2
9.7
10
12
14
22
23
18
8.8
8
7.8
6.5
6.2
6
5.9
13
17
33
29
26
6.7
* Pollution data source:
https://openaq.org
(ChinaAQIData)
The data is licensed under CC-By 4.0
PM10 7 (gut)
PM2,5 2 (gut)
CO 100 (gut)
NO2 8 (gut)
O3 0 (gut)
SO2 9 (gut)
Daten zur Luftverschmutzung der letzten Tage in Zhonghutong
| index | 2022-05-27 |
|---|---|
| pm10 | 32 Moderate |
| pm25 | 24 Moderate |
| co | 468 Good |
| no2 | 21 Good |
| o3 | 32 Good |
| so2 | 5 Good |

| index | 2020-05 | 2020-04 | 2020-03 | 2020-02 | 2020-01 | 2019-12 | 2019-11 | 2019-10 | 2019-09 | 2019-08 | 2019-07 | 2019-06 | 2019-05 | 2019-04 | 2019-03 | 2019-02 | 2019-01 | 2018-12 | 2018-11 | 2018-10 |
|---|---|---|---|---|---|---|---|---|---|---|---|---|---|---|---|---|---|---|---|---|
| pm25 | 25 (Moderate) | 29 (Moderate) | 34 (Moderate) | 37 (Unhealthy for Sensitive Groups) | 60 (Unhealthy) | 46 (Unhealthy for Sensitive Groups) | 39 (Unhealthy for Sensitive Groups) | 23 (Moderate) | 16 (Moderate) | 13 (Good) | 15 (Moderate) | 17 (Moderate) | 36 (Unhealthy for Sensitive Groups) | 30 (Moderate) | 36 (Unhealthy for Sensitive Groups) | 57 (Unhealthy) | 59 (Unhealthy) | 49 (Unhealthy for Sensitive Groups) | 49 (Unhealthy for Sensitive Groups) | 30 (Moderate) |
| co | 707 (Good) | 763 (Good) | 772 (Good) | 964 (Good) | 1 (Good) | 1 (Good) | 1 (Good) | 849 (Good) | 728 (Good) | 599 (Good) | 604 (Good) | 679 (Good) | 661 (Good) | 678 (Good) | 699 (Good) | 966 (Good) | 1 (Good) | 971 (Good) | 951 (Good) | 589 (Good) |
| no2 | 17 (Good) | 17 (Good) | 16 (Good) | 13 (Good) | 26 (Good) | 33 (Good) | 29 (Good) | 21 (Good) | 14 (Good) | 12 (Good) | 13 (Good) | 15 (Good) | 18 (Good) | 18 (Good) | 22 (Good) | 22 (Good) | 35 (Good) | 33 (Good) | 31 (Good) | 23 (Good) |
| o3 | 130 (Unhealthy for Sensitive Groups) | 130 (Unhealthy for Sensitive Groups) | 107 (Moderate) | 96 (Moderate) | 86 (Moderate) | 80 (Moderate) | 78 (Moderate) | 96 (Moderate) | 123 (Unhealthy for Sensitive Groups) | 126 (Unhealthy for Sensitive Groups) | 142 (Unhealthy for Sensitive Groups) | 140 (Unhealthy for Sensitive Groups) | 128 (Unhealthy for Sensitive Groups) | 130 (Unhealthy for Sensitive Groups) | 107 (Moderate) | 94 (Moderate) | 88 (Moderate) | 69 (Good) | 86 (Moderate) | 94 (Moderate) |
| pm10 | 66 (Unhealthy for Sensitive Groups) | 62 (Unhealthy for Sensitive Groups) | 97 (Unhealthy) | 70 (Unhealthy for Sensitive Groups) | 80 (Unhealthy for Sensitive Groups) | 75 (Unhealthy for Sensitive Groups) | 69 (Unhealthy for Sensitive Groups) | 62 (Unhealthy for Sensitive Groups) | 34 (Moderate) | 31 (Moderate) | 38 (Moderate) | 41 (Moderate) | 104 (Unhealthy) | 79 (Unhealthy for Sensitive Groups) | 84 (Unhealthy) | 91 (Unhealthy) | 94 (Unhealthy) | 125 (Very Unhealthy) | 118 (Very Unhealthy) | 63 (Unhealthy for Sensitive Groups) |
| so2 | 9.7 (Good) | 10 (Good) | 12 (Good) | 14 (Good) | 22 (Good) | 23 (Good) | 18 (Good) | 8.8 (Good) | 8 (Good) | 7.8 (Good) | 6.5 (Good) | 6.2 (Good) | 6 (Good) | 5.9 (Good) | 13 (Good) | 17 (Good) | 33 (Good) | 29 (Good) | 26 (Good) | 6.7 (Good) |
PM10 6.7 (gut)
Feinstaub (PM10) SchwebestaubPM2,5 1.7 (gut)
Feinstaub (PM2,5)CO 100 (gut)
Kohlenmonoxid (CO)NO2 7.6 (gut)
Stickstoffdioxid (NO2)O3 0.02 (gut)
Ozon (O3)SO2 8.6 (gut)
Schwefeldioxid (SO2)粮贸总公司
| index | 2022-05-27 |
|---|---|
| pm10 | 32 |
| pm25 | 24 |
| co | 468 |
| no2 | 21 |
| o3 | 32 |
| so2 | 4.6 |
粮贸总公司
| index | 2020-05 | 2020-04 | 2020-03 | 2020-02 | 2020-01 | 2019-12 | 2019-11 | 2019-10 | 2019-09 | 2019-08 | 2019-07 | 2019-06 | 2019-05 | 2019-04 | 2019-03 | 2019-02 | 2019-01 | 2018-12 | 2018-11 | 2018-10 |
|---|---|---|---|---|---|---|---|---|---|---|---|---|---|---|---|---|---|---|---|---|
| pm25 | 25 | 29 | 34 | 37 | 60 | 46 | 39 | 23 | 16 | 13 | 15 | 17 | 36 | 30 | 36 | 57 | 59 | 49 | 49 | 30 |
| co | 707 | 763 | 772 | 964 | 1 | 1 | 1 | 849 | 728 | 599 | 604 | 679 | 661 | 678 | 699 | 966 | 1 | 971 | 951 | 589 |
| no2 | 17 | 17 | 16 | 13 | 26 | 33 | 29 | 21 | 14 | 12 | 13 | 15 | 18 | 18 | 22 | 22 | 35 | 33 | 31 | 23 |
| o3 | 130 | 130 | 107 | 96 | 86 | 80 | 78 | 96 | 123 | 126 | 142 | 140 | 128 | 130 | 107 | 94 | 88 | 69 | 86 | 94 |
| pm10 | 66 | 62 | 97 | 70 | 80 | 75 | 69 | 62 | 34 | 31 | 38 | 41 | 104 | 79 | 84 | 91 | 94 | 125 | 118 | 63 |
| so2 | 9.7 | 10 | 12 | 14 | 22 | 23 | 18 | 8.8 | 8 | 7.8 | 6.5 | 6.2 | 6 | 5.9 | 13 | 17 | 33 | 29 | 26 | 6.7 |