Luftverschmutzung in Baofeng: Echtzeit-Luft-Qualitätsindex und Smog-Alarm.
Für die Baofeng. Heute ist Donnerstag, 4. Juni 2026. Für Baofeng wurden folgende Luftverschmutzungswerte gemessen:- Feinstaub (PM10) Schwebestaub - 7 (gut)
- Feinstaub (PM2,5) - 2 (gut)
- Kohlenmonoxid (CO) - 100 (gut)
- Stickstoffdioxid (NO2) - 8 (gut)
- Ozon (O3) - 0 (gut)
- Schwefeldioxid (SO2) - 9 (gut)

Wie ist die Luftqualität Baofeng heute? Ist die Luft in Baofeng? verschmutzt. Gibt es Smog?
Wie hoch ist der PM10-Stand heute in Baofeng? (Feinstaub (PM10) Schwebestaub)
Der aktuelle Feinstaubgehalt PM10 in Baofeng is:
7 (gut)
Die höchsten PM10-Werte treten in der Regel im Monat auf: 127 (Dezember 2018).
Der niedrigste Wert der Feinstaub-PM10-Belastung in Baofeng ist in der Regel in: August (27).
Wie hoch ist der aktuelle PM2,5-Wert in Baofeng? (Feinstaub (PM2,5))
Die heutige PM2.5-Stufe ist:
2 (gut)
Zum Vergleich: Der höchste PM2,5-Wert in Baofeng in den letzten 7 Tagen war: 24 (Freitag, 27. Mai 2022) und der niedrigste: 24 (Freitag, 27. Mai 2022).
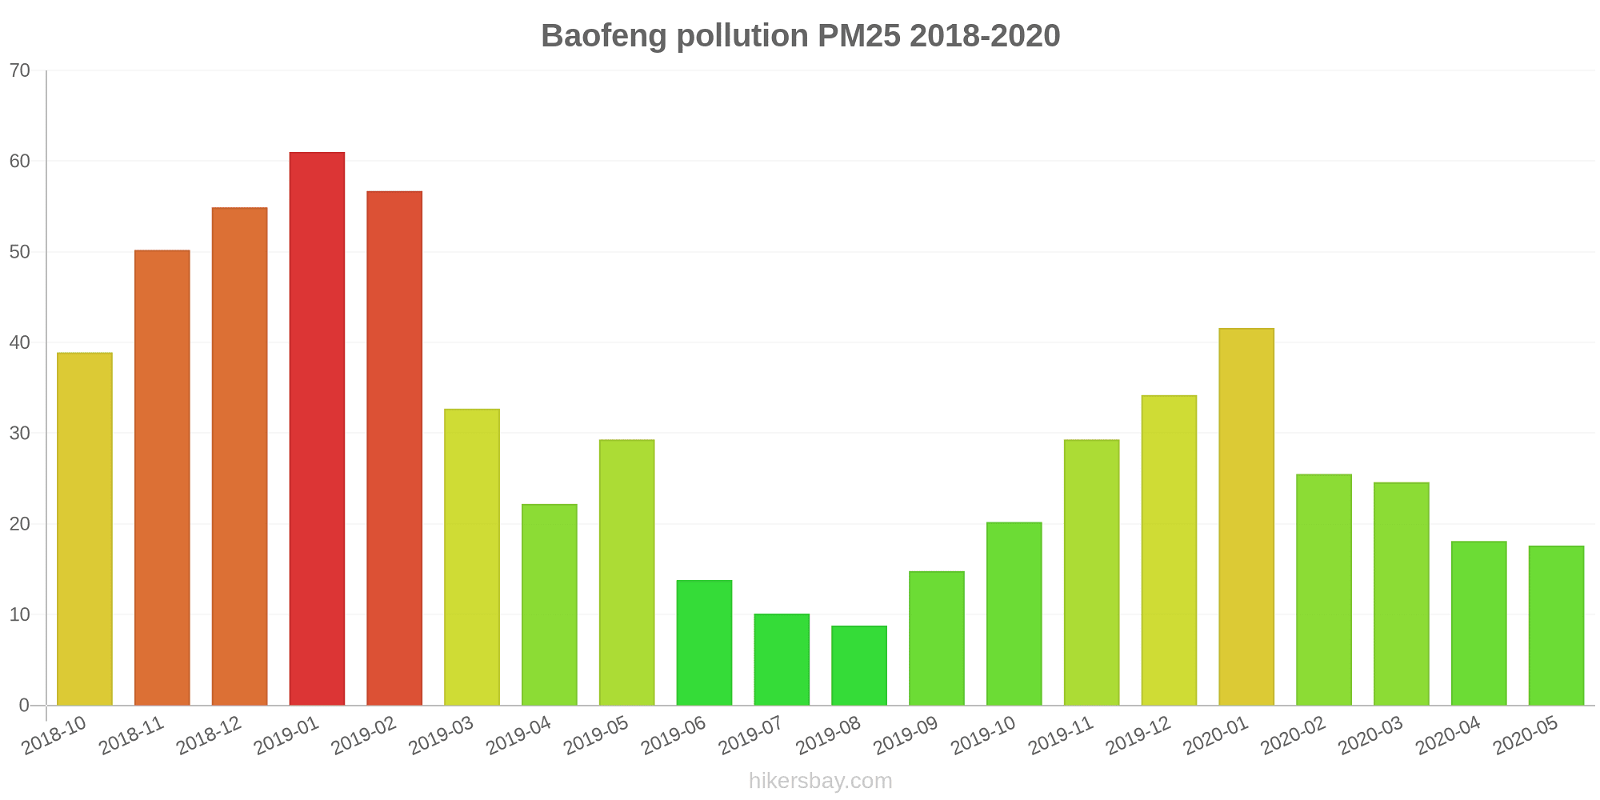
Die höchsten PM2,5-Werte wurden gemessen: 61 (Januar 2019).
Die niedrigste Feinstaubbelastung PM2,5 tritt im Monat auf: August (8.8).
Wie hoch ist der CO-Gehalt? (Kohlenmonoxid (CO))
100 (gut)
Wie hoch ist das NO2-Niveau? (Stickstoffdioxid (NO2))
8 (gut)
Wie ist das O3-Niveau heute in Baofeng? (Ozon (O3))
0 (gut)
Wie hoch ist die SO2-Belastung? (Schwefeldioxid (SO2))
9 (gut)
Aktuelle Daten Freitag, 27. Mai 2022, 12:00
PM10 7 (gut)
PM2,5 2 (gut)
CO 100 (gut)
NO2 8 (gut)
O3 0 (gut)
SO2 9 (gut)
Daten zur Luftverschmutzung der letzten Tage in Baofeng
index
2022-05-27
pm10
32
Moderate
pm25
24
Moderate
co
468
Good
no2
21
Good
o3
32
Good
so2
5
Good
data source »
Luftverschmutzung in Baofeng von Oktober 2018 bis Mai 2020
index
2020-05
2020-04
2020-03
2020-02
2020-01
2019-12
2019-11
2019-10
2019-09
2019-08
2019-07
2019-06
2019-05
2019-04
2019-03
2019-02
2019-01
2018-12
2018-11
2018-10
pm25
18 (Moderate)
18 (Moderate)
25 (Moderate)
26 (Moderate)
42 (Unhealthy for Sensitive Groups)
34 (Moderate)
29 (Moderate)
20 (Moderate)
15 (Moderate)
8.8 (Good)
10 (Good)
14 (Moderate)
29 (Moderate)
22 (Moderate)
33 (Moderate)
57 (Unhealthy)
61 (Unhealthy)
55 (Unhealthy for Sensitive Groups)
50 (Unhealthy for Sensitive Groups)
39 (Unhealthy for Sensitive Groups)
co
349 (Good)
423 (Good)
483 (Good)
694 (Good)
869 (Good)
983 (Good)
771 (Good)
531 (Good)
464 (Good)
422 (Good)
410 (Good)
417 (Good)
568 (Good)
584 (Good)
621 (Good)
992 (Good)
936 (Good)
681 (Good)
650 (Good)
517 (Good)
no2
26 (Good)
36 (Good)
34 (Good)
20 (Good)
36 (Good)
50 (Moderate)
44 (Moderate)
36 (Good)
35 (Good)
31 (Good)
31 (Good)
32 (Good)
28 (Good)
33 (Good)
39 (Good)
32 (Good)
47 (Moderate)
34 (Good)
39 (Good)
41 (Moderate)
o3
132 (Unhealthy for Sensitive Groups)
125 (Unhealthy for Sensitive Groups)
107 (Moderate)
96 (Moderate)
85 (Moderate)
70 (Moderate)
70 (Moderate)
104 (Moderate)
110 (Moderate)
125 (Unhealthy for Sensitive Groups)
133 (Unhealthy for Sensitive Groups)
128 (Unhealthy for Sensitive Groups)
122 (Unhealthy for Sensitive Groups)
126 (Unhealthy for Sensitive Groups)
108 (Moderate)
100 (Moderate)
87 (Moderate)
69 (Good)
78 (Moderate)
96 (Moderate)
pm10
61 (Unhealthy for Sensitive Groups)
63 (Unhealthy for Sensitive Groups)
97 (Unhealthy)
71 (Unhealthy for Sensitive Groups)
75 (Unhealthy for Sensitive Groups)
75 (Unhealthy for Sensitive Groups)
70 (Unhealthy for Sensitive Groups)
47 (Moderate)
34 (Moderate)
27 (Moderate)
37 (Moderate)
47 (Moderate)
121 (Very Unhealthy)
79 (Unhealthy for Sensitive Groups)
87 (Unhealthy)
97 (Unhealthy)
102 (Unhealthy)
127 (Very Unhealthy)
112 (Very Unhealthy)
82 (Unhealthy)
so2
5 (Good)
7.7 (Good)
8 (Good)
9.7 (Good)
14 (Good)
19 (Good)
13 (Good)
7.7 (Good)
6.5 (Good)
6.1 (Good)
6.6 (Good)
7.5 (Good)
9.9 (Good)
11 (Good)
11 (Good)
8 (Good)
14 (Good)
17 (Good)
16 (Good)
10 (Good)
data source »
博物馆
Freitag, 27. Mai 2022, 12:00
PM10 6.7 (gut)
Feinstaub (PM10) Schwebestaub
PM2,5 1.7 (gut)
Feinstaub (PM2,5)
CO 100 (gut)
Kohlenmonoxid (CO)
NO2 7.6 (gut)
Stickstoffdioxid (NO2)
O3 0.02 (gut)
Ozon (O3)
SO2 8.6 (gut)
Schwefeldioxid (SO2)
博物馆
index
2022-05-27
pm10
32
pm25
24
co
468
no2
21
o3
32
so2
4.6
博物馆
2018-10 2020-05

index
2020-05
2020-04
2020-03
2020-02
2020-01
2019-12
2019-11
2019-10
2019-09
2019-08
2019-07
2019-06
2019-05
2019-04
2019-03
2019-02
2019-01
2018-12
2018-11
2018-10
pm25
18
18
25
26
42
34
29
20
15
8.8
10
14
29
22
33
57
61
55
50
39
co
349
423
483
694
869
983
771
531
464
422
410
417
568
584
621
992
936
681
650
517
no2
26
36
34
20
36
50
44
36
35
31
31
32
28
33
39
32
47
34
39
41
o3
132
125
107
96
85
70
70
104
110
125
133
128
122
126
108
100
87
69
78
96
pm10
61
63
97
71
75
75
70
47
34
27
37
47
121
79
87
97
102
127
112
82
so2
5
7.7
8
9.7
14
19
13
7.7
6.5
6.1
6.6
7.5
9.9
11
11
8
14
17
16
10
* Pollution data source:
https://openaq.org
(ChinaAQIData)
The data is licensed under CC-By 4.0
PM10 7 (gut)
PM2,5 2 (gut)
CO 100 (gut)
NO2 8 (gut)
O3 0 (gut)
SO2 9 (gut)
Daten zur Luftverschmutzung der letzten Tage in Baofeng
| index | 2022-05-27 |
|---|---|
| pm10 | 32 Moderate |
| pm25 | 24 Moderate |
| co | 468 Good |
| no2 | 21 Good |
| o3 | 32 Good |
| so2 | 5 Good |

| index | 2020-05 | 2020-04 | 2020-03 | 2020-02 | 2020-01 | 2019-12 | 2019-11 | 2019-10 | 2019-09 | 2019-08 | 2019-07 | 2019-06 | 2019-05 | 2019-04 | 2019-03 | 2019-02 | 2019-01 | 2018-12 | 2018-11 | 2018-10 |
|---|---|---|---|---|---|---|---|---|---|---|---|---|---|---|---|---|---|---|---|---|
| pm25 | 18 (Moderate) | 18 (Moderate) | 25 (Moderate) | 26 (Moderate) | 42 (Unhealthy for Sensitive Groups) | 34 (Moderate) | 29 (Moderate) | 20 (Moderate) | 15 (Moderate) | 8.8 (Good) | 10 (Good) | 14 (Moderate) | 29 (Moderate) | 22 (Moderate) | 33 (Moderate) | 57 (Unhealthy) | 61 (Unhealthy) | 55 (Unhealthy for Sensitive Groups) | 50 (Unhealthy for Sensitive Groups) | 39 (Unhealthy for Sensitive Groups) |
| co | 349 (Good) | 423 (Good) | 483 (Good) | 694 (Good) | 869 (Good) | 983 (Good) | 771 (Good) | 531 (Good) | 464 (Good) | 422 (Good) | 410 (Good) | 417 (Good) | 568 (Good) | 584 (Good) | 621 (Good) | 992 (Good) | 936 (Good) | 681 (Good) | 650 (Good) | 517 (Good) |
| no2 | 26 (Good) | 36 (Good) | 34 (Good) | 20 (Good) | 36 (Good) | 50 (Moderate) | 44 (Moderate) | 36 (Good) | 35 (Good) | 31 (Good) | 31 (Good) | 32 (Good) | 28 (Good) | 33 (Good) | 39 (Good) | 32 (Good) | 47 (Moderate) | 34 (Good) | 39 (Good) | 41 (Moderate) |
| o3 | 132 (Unhealthy for Sensitive Groups) | 125 (Unhealthy for Sensitive Groups) | 107 (Moderate) | 96 (Moderate) | 85 (Moderate) | 70 (Moderate) | 70 (Moderate) | 104 (Moderate) | 110 (Moderate) | 125 (Unhealthy for Sensitive Groups) | 133 (Unhealthy for Sensitive Groups) | 128 (Unhealthy for Sensitive Groups) | 122 (Unhealthy for Sensitive Groups) | 126 (Unhealthy for Sensitive Groups) | 108 (Moderate) | 100 (Moderate) | 87 (Moderate) | 69 (Good) | 78 (Moderate) | 96 (Moderate) |
| pm10 | 61 (Unhealthy for Sensitive Groups) | 63 (Unhealthy for Sensitive Groups) | 97 (Unhealthy) | 71 (Unhealthy for Sensitive Groups) | 75 (Unhealthy for Sensitive Groups) | 75 (Unhealthy for Sensitive Groups) | 70 (Unhealthy for Sensitive Groups) | 47 (Moderate) | 34 (Moderate) | 27 (Moderate) | 37 (Moderate) | 47 (Moderate) | 121 (Very Unhealthy) | 79 (Unhealthy for Sensitive Groups) | 87 (Unhealthy) | 97 (Unhealthy) | 102 (Unhealthy) | 127 (Very Unhealthy) | 112 (Very Unhealthy) | 82 (Unhealthy) |
| so2 | 5 (Good) | 7.7 (Good) | 8 (Good) | 9.7 (Good) | 14 (Good) | 19 (Good) | 13 (Good) | 7.7 (Good) | 6.5 (Good) | 6.1 (Good) | 6.6 (Good) | 7.5 (Good) | 9.9 (Good) | 11 (Good) | 11 (Good) | 8 (Good) | 14 (Good) | 17 (Good) | 16 (Good) | 10 (Good) |
PM10 6.7 (gut)
Feinstaub (PM10) SchwebestaubPM2,5 1.7 (gut)
Feinstaub (PM2,5)CO 100 (gut)
Kohlenmonoxid (CO)NO2 7.6 (gut)
Stickstoffdioxid (NO2)O3 0.02 (gut)
Ozon (O3)SO2 8.6 (gut)
Schwefeldioxid (SO2)博物馆
| index | 2022-05-27 |
|---|---|
| pm10 | 32 |
| pm25 | 24 |
| co | 468 |
| no2 | 21 |
| o3 | 32 |
| so2 | 4.6 |
博物馆

| index | 2020-05 | 2020-04 | 2020-03 | 2020-02 | 2020-01 | 2019-12 | 2019-11 | 2019-10 | 2019-09 | 2019-08 | 2019-07 | 2019-06 | 2019-05 | 2019-04 | 2019-03 | 2019-02 | 2019-01 | 2018-12 | 2018-11 | 2018-10 |
|---|---|---|---|---|---|---|---|---|---|---|---|---|---|---|---|---|---|---|---|---|
| pm25 | 18 | 18 | 25 | 26 | 42 | 34 | 29 | 20 | 15 | 8.8 | 10 | 14 | 29 | 22 | 33 | 57 | 61 | 55 | 50 | 39 |
| co | 349 | 423 | 483 | 694 | 869 | 983 | 771 | 531 | 464 | 422 | 410 | 417 | 568 | 584 | 621 | 992 | 936 | 681 | 650 | 517 |
| no2 | 26 | 36 | 34 | 20 | 36 | 50 | 44 | 36 | 35 | 31 | 31 | 32 | 28 | 33 | 39 | 32 | 47 | 34 | 39 | 41 |
| o3 | 132 | 125 | 107 | 96 | 85 | 70 | 70 | 104 | 110 | 125 | 133 | 128 | 122 | 126 | 108 | 100 | 87 | 69 | 78 | 96 |
| pm10 | 61 | 63 | 97 | 71 | 75 | 75 | 70 | 47 | 34 | 27 | 37 | 47 | 121 | 79 | 87 | 97 | 102 | 127 | 112 | 82 |
| so2 | 5 | 7.7 | 8 | 9.7 | 14 | 19 | 13 | 7.7 | 6.5 | 6.1 | 6.6 | 7.5 | 9.9 | 11 | 11 | 8 | 14 | 17 | 16 | 10 |