Luftverschmutzung in Yuguangcun: Echtzeit-Luft-Qualitätsindex und Smog-Alarm.
Für die Yuguangcun. Heute ist Donnerstag, 4. Juni 2026. Für Yuguangcun wurden folgende Luftverschmutzungswerte gemessen:- Feinstaub (PM10) Schwebestaub - 7 (gut)
- Feinstaub (PM2,5) - 2 (gut)
- Kohlenmonoxid (CO) - 100 (gut)
- Stickstoffdioxid (NO2) - 8 (gut)
- Ozon (O3) - 0 (gut)
- Schwefeldioxid (SO2) - 9 (gut)

Wie ist die Luftqualität Yuguangcun heute? Ist die Luft in Yuguangcun? verschmutzt. Gibt es Smog?
Wie hoch ist der PM10-Stand heute in Yuguangcun? (Feinstaub (PM10) Schwebestaub)
Der aktuelle Feinstaubgehalt PM10 in Yuguangcun is:
7 (gut)
Die höchsten PM10-Werte treten in der Regel im Monat auf: 79 (November 2019).
Der niedrigste Wert der Feinstaub-PM10-Belastung in Yuguangcun ist in der Regel in: Juni (32).
Wie hoch ist der aktuelle PM2,5-Wert in Yuguangcun? (Feinstaub (PM2,5))
Die heutige PM2.5-Stufe ist:
2 (gut)
Zum Vergleich: Der höchste PM2,5-Wert in Yuguangcun in den letzten 7 Tagen war: 24 (Freitag, 27. Mai 2022) und der niedrigste: 24 (Freitag, 27. Mai 2022).
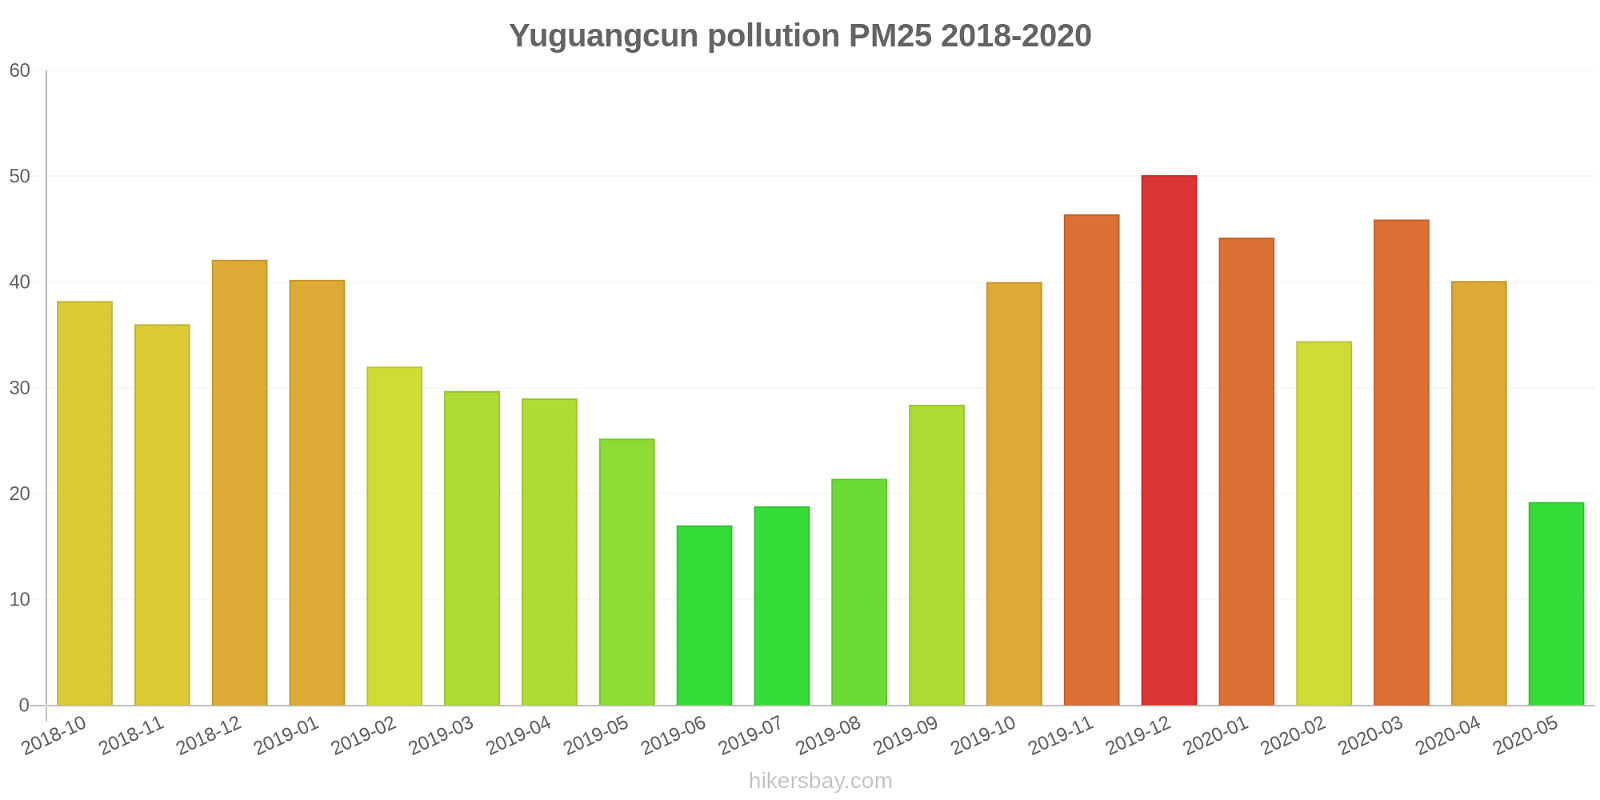
Die höchsten PM2,5-Werte wurden gemessen: 50 (Dezember 2019).
Die niedrigste Feinstaubbelastung PM2,5 tritt im Monat auf: Juni (17).
Wie hoch ist der CO-Gehalt? (Kohlenmonoxid (CO))
100 (gut)
Wie hoch ist das NO2-Niveau? (Stickstoffdioxid (NO2))
8 (gut)
Wie ist das O3-Niveau heute in Yuguangcun? (Ozon (O3))
0 (gut)
Wie hoch ist die SO2-Belastung? (Schwefeldioxid (SO2))
9 (gut)
Aktuelle Daten Freitag, 27. Mai 2022, 12:00
PM10 7 (gut)
PM2,5 2 (gut)
CO 100 (gut)
NO2 8 (gut)
O3 0 (gut)
SO2 9 (gut)
Daten zur Luftverschmutzung der letzten Tage in Yuguangcun
index
2022-05-27
pm10
32
Moderate
pm25
24
Moderate
co
468
Good
no2
21
Good
o3
32
Good
so2
5
Good
data source »
Luftverschmutzung in Yuguangcun von Oktober 2018 bis Mai 2020
index
2020-05
2020-04
2020-03
2020-02
2020-01
2019-12
2019-11
2019-10
2019-09
2019-08
2019-07
2019-06
2019-05
2019-04
2019-03
2019-02
2019-01
2018-12
2018-11
2018-10
pm25
19 (Moderate)
40 (Unhealthy for Sensitive Groups)
46 (Unhealthy for Sensitive Groups)
34 (Moderate)
44 (Unhealthy for Sensitive Groups)
50 (Unhealthy for Sensitive Groups)
46 (Unhealthy for Sensitive Groups)
40 (Unhealthy for Sensitive Groups)
28 (Moderate)
21 (Moderate)
19 (Moderate)
17 (Moderate)
25 (Moderate)
29 (Moderate)
30 (Moderate)
32 (Moderate)
40 (Unhealthy for Sensitive Groups)
42 (Unhealthy for Sensitive Groups)
36 (Unhealthy for Sensitive Groups)
38 (Unhealthy for Sensitive Groups)
co
632 (Good)
683 (Good)
784 (Good)
666 (Good)
882 (Good)
826 (Good)
765 (Good)
841 (Good)
763 (Good)
652 (Good)
634 (Good)
663 (Good)
730 (Good)
860 (Good)
881 (Good)
919 (Good)
1 (Good)
934 (Good)
823 (Good)
863 (Good)
no2
13 (Good)
24 (Good)
23 (Good)
12 (Good)
20 (Good)
33 (Good)
27 (Good)
20 (Good)
20 (Good)
18 (Good)
19 (Good)
20 (Good)
18 (Good)
24 (Good)
29 (Good)
18 (Good)
36 (Good)
32 (Good)
28 (Good)
27 (Good)
o3
116 (Moderate)
132 (Unhealthy for Sensitive Groups)
107 (Moderate)
110 (Moderate)
116 (Moderate)
118 (Moderate)
148 (Unhealthy for Sensitive Groups)
147 (Unhealthy for Sensitive Groups)
151 (Unhealthy)
116 (Moderate)
100 (Moderate)
95 (Moderate)
120 (Unhealthy for Sensitive Groups)
119 (Moderate)
118 (Moderate)
101 (Moderate)
111 (Moderate)
85 (Moderate)
113 (Moderate)
142 (Unhealthy for Sensitive Groups)
pm10
41 (Moderate)
55 (Unhealthy for Sensitive Groups)
54 (Unhealthy for Sensitive Groups)
41 (Moderate)
51 (Unhealthy for Sensitive Groups)
70 (Unhealthy for Sensitive Groups)
79 (Unhealthy for Sensitive Groups)
64 (Unhealthy for Sensitive Groups)
50 (Unhealthy for Sensitive Groups)
37 (Moderate)
36 (Moderate)
32 (Moderate)
45 (Moderate)
51 (Unhealthy for Sensitive Groups)
53 (Unhealthy for Sensitive Groups)
49 (Moderate)
66 (Unhealthy for Sensitive Groups)
63 (Unhealthy for Sensitive Groups)
56 (Unhealthy for Sensitive Groups)
61 (Unhealthy for Sensitive Groups)
so2
6.8 (Good)
9.2 (Good)
8.7 (Good)
9.8 (Good)
11 (Good)
16 (Good)
16 (Good)
15 (Good)
13 (Good)
10 (Good)
9 (Good)
8.7 (Good)
10 (Good)
11 (Good)
12 (Good)
8.4 (Good)
12 (Good)
13 (Good)
13 (Good)
15 (Good)
data source »
渔湖
Freitag, 27. Mai 2022, 12:00
PM10 6.7 (gut)
Feinstaub (PM10) Schwebestaub
PM2,5 1.7 (gut)
Feinstaub (PM2,5)
CO 100 (gut)
Kohlenmonoxid (CO)
NO2 7.6 (gut)
Stickstoffdioxid (NO2)
O3 0.02 (gut)
Ozon (O3)
SO2 8.6 (gut)
Schwefeldioxid (SO2)
渔湖
index
2022-05-27
pm10
32
pm25
24
co
468
no2
21
o3
32
so2
4.6
渔湖
2018-10 2020-05
index
2020-05
2020-04
2020-03
2020-02
2020-01
2019-12
2019-11
2019-10
2019-09
2019-08
2019-07
2019-06
2019-05
2019-04
2019-03
2019-02
2019-01
2018-12
2018-11
2018-10
pm25
19
40
46
34
44
50
46
40
28
21
19
17
25
29
30
32
40
42
36
38
co
632
683
784
666
882
826
765
841
763
652
634
663
730
860
881
919
1
934
823
863
no2
13
24
23
12
20
33
27
20
20
18
19
20
18
24
29
18
36
32
28
27
o3
116
132
107
110
116
118
148
147
151
116
100
95
120
119
118
101
111
85
113
142
pm10
41
55
54
41
51
70
79
64
50
37
36
32
45
51
53
49
66
63
56
61
so2
6.8
9.2
8.7
9.8
11
16
16
15
13
10
9
8.7
10
11
12
8.4
12
13
13
15
* Pollution data source:
https://openaq.org
(ChinaAQIData)
The data is licensed under CC-By 4.0
PM10 7 (gut)
PM2,5 2 (gut)
CO 100 (gut)
NO2 8 (gut)
O3 0 (gut)
SO2 9 (gut)
Daten zur Luftverschmutzung der letzten Tage in Yuguangcun
| index | 2022-05-27 |
|---|---|
| pm10 | 32 Moderate |
| pm25 | 24 Moderate |
| co | 468 Good |
| no2 | 21 Good |
| o3 | 32 Good |
| so2 | 5 Good |

| index | 2020-05 | 2020-04 | 2020-03 | 2020-02 | 2020-01 | 2019-12 | 2019-11 | 2019-10 | 2019-09 | 2019-08 | 2019-07 | 2019-06 | 2019-05 | 2019-04 | 2019-03 | 2019-02 | 2019-01 | 2018-12 | 2018-11 | 2018-10 |
|---|---|---|---|---|---|---|---|---|---|---|---|---|---|---|---|---|---|---|---|---|
| pm25 | 19 (Moderate) | 40 (Unhealthy for Sensitive Groups) | 46 (Unhealthy for Sensitive Groups) | 34 (Moderate) | 44 (Unhealthy for Sensitive Groups) | 50 (Unhealthy for Sensitive Groups) | 46 (Unhealthy for Sensitive Groups) | 40 (Unhealthy for Sensitive Groups) | 28 (Moderate) | 21 (Moderate) | 19 (Moderate) | 17 (Moderate) | 25 (Moderate) | 29 (Moderate) | 30 (Moderate) | 32 (Moderate) | 40 (Unhealthy for Sensitive Groups) | 42 (Unhealthy for Sensitive Groups) | 36 (Unhealthy for Sensitive Groups) | 38 (Unhealthy for Sensitive Groups) |
| co | 632 (Good) | 683 (Good) | 784 (Good) | 666 (Good) | 882 (Good) | 826 (Good) | 765 (Good) | 841 (Good) | 763 (Good) | 652 (Good) | 634 (Good) | 663 (Good) | 730 (Good) | 860 (Good) | 881 (Good) | 919 (Good) | 1 (Good) | 934 (Good) | 823 (Good) | 863 (Good) |
| no2 | 13 (Good) | 24 (Good) | 23 (Good) | 12 (Good) | 20 (Good) | 33 (Good) | 27 (Good) | 20 (Good) | 20 (Good) | 18 (Good) | 19 (Good) | 20 (Good) | 18 (Good) | 24 (Good) | 29 (Good) | 18 (Good) | 36 (Good) | 32 (Good) | 28 (Good) | 27 (Good) |
| o3 | 116 (Moderate) | 132 (Unhealthy for Sensitive Groups) | 107 (Moderate) | 110 (Moderate) | 116 (Moderate) | 118 (Moderate) | 148 (Unhealthy for Sensitive Groups) | 147 (Unhealthy for Sensitive Groups) | 151 (Unhealthy) | 116 (Moderate) | 100 (Moderate) | 95 (Moderate) | 120 (Unhealthy for Sensitive Groups) | 119 (Moderate) | 118 (Moderate) | 101 (Moderate) | 111 (Moderate) | 85 (Moderate) | 113 (Moderate) | 142 (Unhealthy for Sensitive Groups) |
| pm10 | 41 (Moderate) | 55 (Unhealthy for Sensitive Groups) | 54 (Unhealthy for Sensitive Groups) | 41 (Moderate) | 51 (Unhealthy for Sensitive Groups) | 70 (Unhealthy for Sensitive Groups) | 79 (Unhealthy for Sensitive Groups) | 64 (Unhealthy for Sensitive Groups) | 50 (Unhealthy for Sensitive Groups) | 37 (Moderate) | 36 (Moderate) | 32 (Moderate) | 45 (Moderate) | 51 (Unhealthy for Sensitive Groups) | 53 (Unhealthy for Sensitive Groups) | 49 (Moderate) | 66 (Unhealthy for Sensitive Groups) | 63 (Unhealthy for Sensitive Groups) | 56 (Unhealthy for Sensitive Groups) | 61 (Unhealthy for Sensitive Groups) |
| so2 | 6.8 (Good) | 9.2 (Good) | 8.7 (Good) | 9.8 (Good) | 11 (Good) | 16 (Good) | 16 (Good) | 15 (Good) | 13 (Good) | 10 (Good) | 9 (Good) | 8.7 (Good) | 10 (Good) | 11 (Good) | 12 (Good) | 8.4 (Good) | 12 (Good) | 13 (Good) | 13 (Good) | 15 (Good) |
PM10 6.7 (gut)
Feinstaub (PM10) SchwebestaubPM2,5 1.7 (gut)
Feinstaub (PM2,5)CO 100 (gut)
Kohlenmonoxid (CO)NO2 7.6 (gut)
Stickstoffdioxid (NO2)O3 0.02 (gut)
Ozon (O3)SO2 8.6 (gut)
Schwefeldioxid (SO2)渔湖
| index | 2022-05-27 |
|---|---|
| pm10 | 32 |
| pm25 | 24 |
| co | 468 |
| no2 | 21 |
| o3 | 32 |
| so2 | 4.6 |
渔湖

| index | 2020-05 | 2020-04 | 2020-03 | 2020-02 | 2020-01 | 2019-12 | 2019-11 | 2019-10 | 2019-09 | 2019-08 | 2019-07 | 2019-06 | 2019-05 | 2019-04 | 2019-03 | 2019-02 | 2019-01 | 2018-12 | 2018-11 | 2018-10 |
|---|---|---|---|---|---|---|---|---|---|---|---|---|---|---|---|---|---|---|---|---|
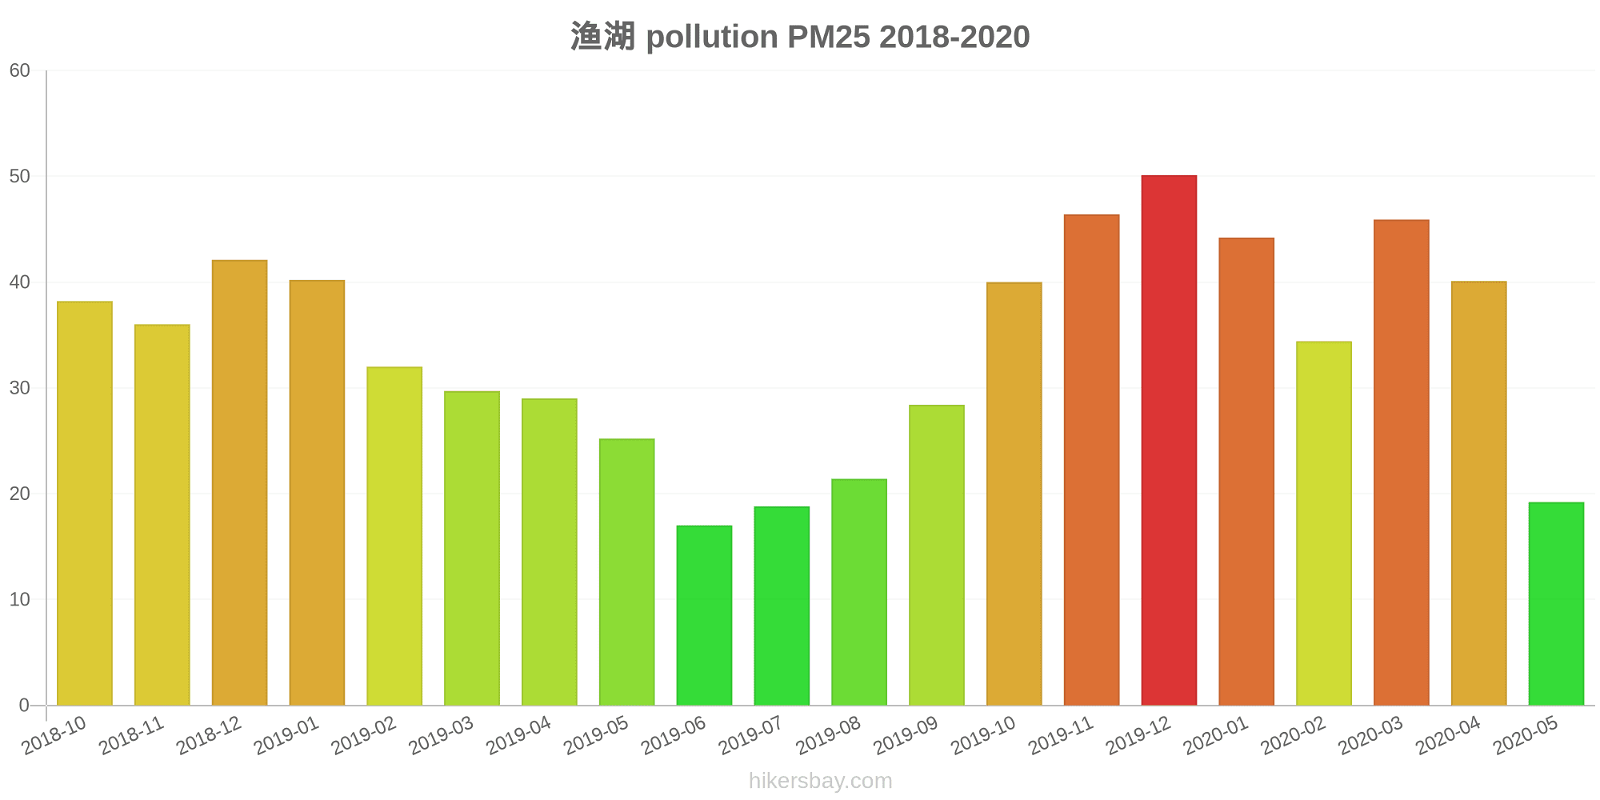
| pm25 | 19 | 40 | 46 | 34 | 44 | 50 | 46 | 40 | 28 | 21 | 19 | 17 | 25 | 29 | 30 | 32 | 40 | 42 | 36 | 38 |
| co | 632 | 683 | 784 | 666 | 882 | 826 | 765 | 841 | 763 | 652 | 634 | 663 | 730 | 860 | 881 | 919 | 1 | 934 | 823 | 863 |
| no2 | 13 | 24 | 23 | 12 | 20 | 33 | 27 | 20 | 20 | 18 | 19 | 20 | 18 | 24 | 29 | 18 | 36 | 32 | 28 | 27 |
| o3 | 116 | 132 | 107 | 110 | 116 | 118 | 148 | 147 | 151 | 116 | 100 | 95 | 120 | 119 | 118 | 101 | 111 | 85 | 113 | 142 |
| pm10 | 41 | 55 | 54 | 41 | 51 | 70 | 79 | 64 | 50 | 37 | 36 | 32 | 45 | 51 | 53 | 49 | 66 | 63 | 56 | 61 |
| so2 | 6.8 | 9.2 | 8.7 | 9.8 | 11 | 16 | 16 | 15 | 13 | 10 | 9 | 8.7 | 10 | 11 | 12 | 8.4 | 12 | 13 | 13 | 15 |