Luftverschmutzung in Pingshancun: Echtzeit-Luft-Qualitätsindex und Smog-Alarm.
Für die Pingshancun. Heute ist Donnerstag, 4. Juni 2026. Für Pingshancun wurden folgende Luftverschmutzungswerte gemessen:- Feinstaub (PM10) Schwebestaub - 7 (gut)
- Feinstaub (PM2,5) - 2 (gut)
- Kohlenmonoxid (CO) - 100 (gut)
- Stickstoffdioxid (NO2) - 8 (gut)
- Ozon (O3) - 0 (gut)
- Schwefeldioxid (SO2) - 9 (gut)

Wie ist die Luftqualität Pingshancun heute? Ist die Luft in Pingshancun? verschmutzt. Gibt es Smog?
Wie hoch ist der PM10-Stand heute in Pingshancun? (Feinstaub (PM10) Schwebestaub)
Der aktuelle Feinstaubgehalt PM10 in Pingshancun is:
7 (gut)
Die höchsten PM10-Werte treten in der Regel im Monat auf: 95 (Dezember 2019).
Der niedrigste Wert der Feinstaub-PM10-Belastung in Pingshancun ist in der Regel in: Juni (25).
Wie hoch ist der aktuelle PM2,5-Wert in Pingshancun? (Feinstaub (PM2,5))
Die heutige PM2.5-Stufe ist:
2 (gut)
Zum Vergleich: Der höchste PM2,5-Wert in Pingshancun in den letzten 7 Tagen war: 24 (Freitag, 27. Mai 2022) und der niedrigste: 24 (Freitag, 27. Mai 2022).
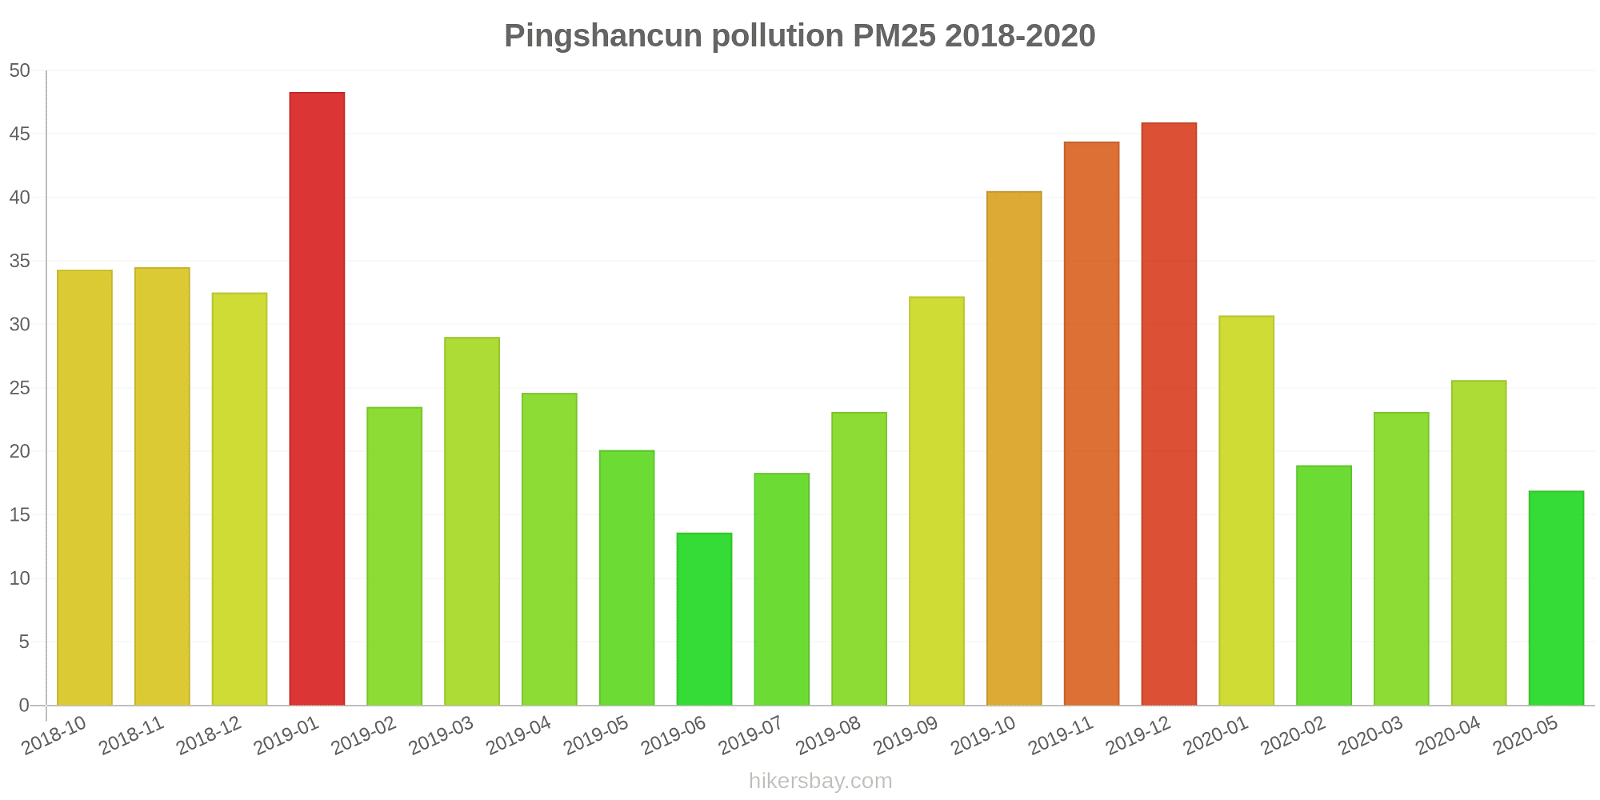
Die höchsten PM2,5-Werte wurden gemessen: 48 (Januar 2019).
Die niedrigste Feinstaubbelastung PM2,5 tritt im Monat auf: Juni (14).
Wie hoch ist der CO-Gehalt? (Kohlenmonoxid (CO))
100 (gut)
Wie hoch ist das NO2-Niveau? (Stickstoffdioxid (NO2))
8 (gut)
Wie ist das O3-Niveau heute in Pingshancun? (Ozon (O3))
0 (gut)
Wie hoch ist die SO2-Belastung? (Schwefeldioxid (SO2))
9 (gut)
Aktuelle Daten Freitag, 27. Mai 2022, 12:00
PM10 7 (gut)
PM2,5 2 (gut)
CO 100 (gut)
NO2 8 (gut)
O3 0 (gut)
SO2 9 (gut)
Daten zur Luftverschmutzung der letzten Tage in Pingshancun
index
2022-05-27
pm10
32
Moderate
pm25
24
Moderate
co
468
Good
no2
21
Good
o3
32
Good
so2
5
Good
data source »
Luftverschmutzung in Pingshancun von Oktober 2018 bis Mai 2020
index
2020-05
2020-04
2020-03
2020-02
2020-01
2019-12
2019-11
2019-10
2019-09
2019-08
2019-07
2019-06
2019-05
2019-04
2019-03
2019-02
2019-01
2018-12
2018-11
2018-10
pm25
17 (Moderate)
26 (Moderate)
23 (Moderate)
19 (Moderate)
31 (Moderate)
46 (Unhealthy for Sensitive Groups)
44 (Unhealthy for Sensitive Groups)
41 (Unhealthy for Sensitive Groups)
32 (Moderate)
23 (Moderate)
18 (Moderate)
14 (Moderate)
20 (Moderate)
25 (Moderate)
29 (Moderate)
24 (Moderate)
48 (Unhealthy for Sensitive Groups)
33 (Moderate)
35 (Moderate)
34 (Moderate)
co
488 (Good)
607 (Good)
714 (Good)
640 (Good)
742 (Good)
629 (Good)
681 (Good)
789 (Good)
663 (Good)
590 (Good)
583 (Good)
540 (Good)
617 (Good)
670 (Good)
710 (Good)
703 (Good)
945 (Good)
739 (Good)
765 (Good)
647 (Good)
no2
20 (Good)
33 (Good)
29 (Good)
19 (Good)
17 (Good)
36 (Good)
34 (Good)
22 (Good)
21 (Good)
22 (Good)
27 (Good)
20 (Good)
14 (Good)
21 (Good)
23 (Good)
12 (Good)
28 (Good)
38 (Good)
41 (Moderate)
37 (Good)
o3
98 (Moderate)
118 (Moderate)
82 (Moderate)
94 (Moderate)
98 (Moderate)
128 (Unhealthy for Sensitive Groups)
186 (Very Unhealthy)
185 (Very Unhealthy)
181 (Very Unhealthy)
154 (Unhealthy)
93 (Moderate)
87 (Moderate)
109 (Moderate)
103 (Moderate)
61 (Good)
64 (Good)
91 (Moderate)
78 (Moderate)
111 (Moderate)
131 (Unhealthy for Sensitive Groups)
pm10
33 (Moderate)
52 (Unhealthy for Sensitive Groups)
42 (Moderate)
30 (Moderate)
54 (Unhealthy for Sensitive Groups)
95 (Unhealthy)
93 (Unhealthy)
69 (Unhealthy for Sensitive Groups)
57 (Unhealthy for Sensitive Groups)
39 (Moderate)
34 (Moderate)
25 (Moderate)
37 (Moderate)
44 (Moderate)
50 (Unhealthy for Sensitive Groups)
37 (Moderate)
84 (Unhealthy)
63 (Unhealthy for Sensitive Groups)
75 (Unhealthy for Sensitive Groups)
69 (Unhealthy for Sensitive Groups)
so2
4.2 (Good)
4.5 (Good)
4.3 (Good)
4.5 (Good)
4.9 (Good)
7.2 (Good)
9.6 (Good)
9.1 (Good)
9.2 (Good)
6.5 (Good)
5.5 (Good)
6.2 (Good)
4.3 (Good)
4.3 (Good)
3.9 (Good)
3.2 (Good)
5.5 (Good)
7.3 (Good)
8 (Good)
10 (Good)
data source »
观澜
Freitag, 27. Mai 2022, 12:00
PM10 6.7 (gut)
Feinstaub (PM10) Schwebestaub
PM2,5 1.7 (gut)
Feinstaub (PM2,5)
CO 100 (gut)
Kohlenmonoxid (CO)
NO2 7.6 (gut)
Stickstoffdioxid (NO2)
O3 0.02 (gut)
Ozon (O3)
SO2 8.6 (gut)
Schwefeldioxid (SO2)
观澜
index
2022-05-27
pm10
32
pm25
24
co
468
no2
21
o3
32
so2
4.6
观澜
2018-10 2020-05

index
2020-05
2020-04
2020-03
2020-02
2020-01
2019-12
2019-11
2019-10
2019-09
2019-08
2019-07
2019-06
2019-05
2019-04
2019-03
2019-02
2019-01
2018-12
2018-11
2018-10
o3
98
118
82
94
98
128
186
185
181
154
93
87
109
103
61
64
91
78
111
131
pm25
17
26
23
19
31
46
44
41
32
23
18
14
20
25
29
24
48
33
35
34
co
488
607
714
640
742
629
681
789
663
590
583
540
617
670
710
703
945
739
765
647
no2
20
33
29
19
17
36
34
22
21
22
27
20
14
21
23
12
28
38
41
37
pm10
33
52
42
30
54
95
93
69
57
39
34
25
37
44
50
37
84
63
75
69
so2
4.2
4.5
4.3
4.5
4.9
7.2
9.6
9.1
9.2
6.5
5.5
6.2
4.3
4.3
3.9
3.2
5.5
7.3
8
10
* Pollution data source:
https://openaq.org
(ChinaAQIData)
The data is licensed under CC-By 4.0
PM10 7 (gut)
PM2,5 2 (gut)
CO 100 (gut)
NO2 8 (gut)
O3 0 (gut)
SO2 9 (gut)
Daten zur Luftverschmutzung der letzten Tage in Pingshancun
| index | 2022-05-27 |
|---|---|
| pm10 | 32 Moderate |
| pm25 | 24 Moderate |
| co | 468 Good |
| no2 | 21 Good |
| o3 | 32 Good |
| so2 | 5 Good |

| index | 2020-05 | 2020-04 | 2020-03 | 2020-02 | 2020-01 | 2019-12 | 2019-11 | 2019-10 | 2019-09 | 2019-08 | 2019-07 | 2019-06 | 2019-05 | 2019-04 | 2019-03 | 2019-02 | 2019-01 | 2018-12 | 2018-11 | 2018-10 |
|---|---|---|---|---|---|---|---|---|---|---|---|---|---|---|---|---|---|---|---|---|
| pm25 | 17 (Moderate) | 26 (Moderate) | 23 (Moderate) | 19 (Moderate) | 31 (Moderate) | 46 (Unhealthy for Sensitive Groups) | 44 (Unhealthy for Sensitive Groups) | 41 (Unhealthy for Sensitive Groups) | 32 (Moderate) | 23 (Moderate) | 18 (Moderate) | 14 (Moderate) | 20 (Moderate) | 25 (Moderate) | 29 (Moderate) | 24 (Moderate) | 48 (Unhealthy for Sensitive Groups) | 33 (Moderate) | 35 (Moderate) | 34 (Moderate) |
| co | 488 (Good) | 607 (Good) | 714 (Good) | 640 (Good) | 742 (Good) | 629 (Good) | 681 (Good) | 789 (Good) | 663 (Good) | 590 (Good) | 583 (Good) | 540 (Good) | 617 (Good) | 670 (Good) | 710 (Good) | 703 (Good) | 945 (Good) | 739 (Good) | 765 (Good) | 647 (Good) |
| no2 | 20 (Good) | 33 (Good) | 29 (Good) | 19 (Good) | 17 (Good) | 36 (Good) | 34 (Good) | 22 (Good) | 21 (Good) | 22 (Good) | 27 (Good) | 20 (Good) | 14 (Good) | 21 (Good) | 23 (Good) | 12 (Good) | 28 (Good) | 38 (Good) | 41 (Moderate) | 37 (Good) |
| o3 | 98 (Moderate) | 118 (Moderate) | 82 (Moderate) | 94 (Moderate) | 98 (Moderate) | 128 (Unhealthy for Sensitive Groups) | 186 (Very Unhealthy) | 185 (Very Unhealthy) | 181 (Very Unhealthy) | 154 (Unhealthy) | 93 (Moderate) | 87 (Moderate) | 109 (Moderate) | 103 (Moderate) | 61 (Good) | 64 (Good) | 91 (Moderate) | 78 (Moderate) | 111 (Moderate) | 131 (Unhealthy for Sensitive Groups) |
| pm10 | 33 (Moderate) | 52 (Unhealthy for Sensitive Groups) | 42 (Moderate) | 30 (Moderate) | 54 (Unhealthy for Sensitive Groups) | 95 (Unhealthy) | 93 (Unhealthy) | 69 (Unhealthy for Sensitive Groups) | 57 (Unhealthy for Sensitive Groups) | 39 (Moderate) | 34 (Moderate) | 25 (Moderate) | 37 (Moderate) | 44 (Moderate) | 50 (Unhealthy for Sensitive Groups) | 37 (Moderate) | 84 (Unhealthy) | 63 (Unhealthy for Sensitive Groups) | 75 (Unhealthy for Sensitive Groups) | 69 (Unhealthy for Sensitive Groups) |
| so2 | 4.2 (Good) | 4.5 (Good) | 4.3 (Good) | 4.5 (Good) | 4.9 (Good) | 7.2 (Good) | 9.6 (Good) | 9.1 (Good) | 9.2 (Good) | 6.5 (Good) | 5.5 (Good) | 6.2 (Good) | 4.3 (Good) | 4.3 (Good) | 3.9 (Good) | 3.2 (Good) | 5.5 (Good) | 7.3 (Good) | 8 (Good) | 10 (Good) |
PM10 6.7 (gut)
Feinstaub (PM10) SchwebestaubPM2,5 1.7 (gut)
Feinstaub (PM2,5)CO 100 (gut)
Kohlenmonoxid (CO)NO2 7.6 (gut)
Stickstoffdioxid (NO2)O3 0.02 (gut)
Ozon (O3)SO2 8.6 (gut)
Schwefeldioxid (SO2)观澜
| index | 2022-05-27 |
|---|---|
| pm10 | 32 |
| pm25 | 24 |
| co | 468 |
| no2 | 21 |
| o3 | 32 |
| so2 | 4.6 |
观澜
| index | 2020-05 | 2020-04 | 2020-03 | 2020-02 | 2020-01 | 2019-12 | 2019-11 | 2019-10 | 2019-09 | 2019-08 | 2019-07 | 2019-06 | 2019-05 | 2019-04 | 2019-03 | 2019-02 | 2019-01 | 2018-12 | 2018-11 | 2018-10 |
|---|---|---|---|---|---|---|---|---|---|---|---|---|---|---|---|---|---|---|---|---|
| o3 | 98 | 118 | 82 | 94 | 98 | 128 | 186 | 185 | 181 | 154 | 93 | 87 | 109 | 103 | 61 | 64 | 91 | 78 | 111 | 131 |
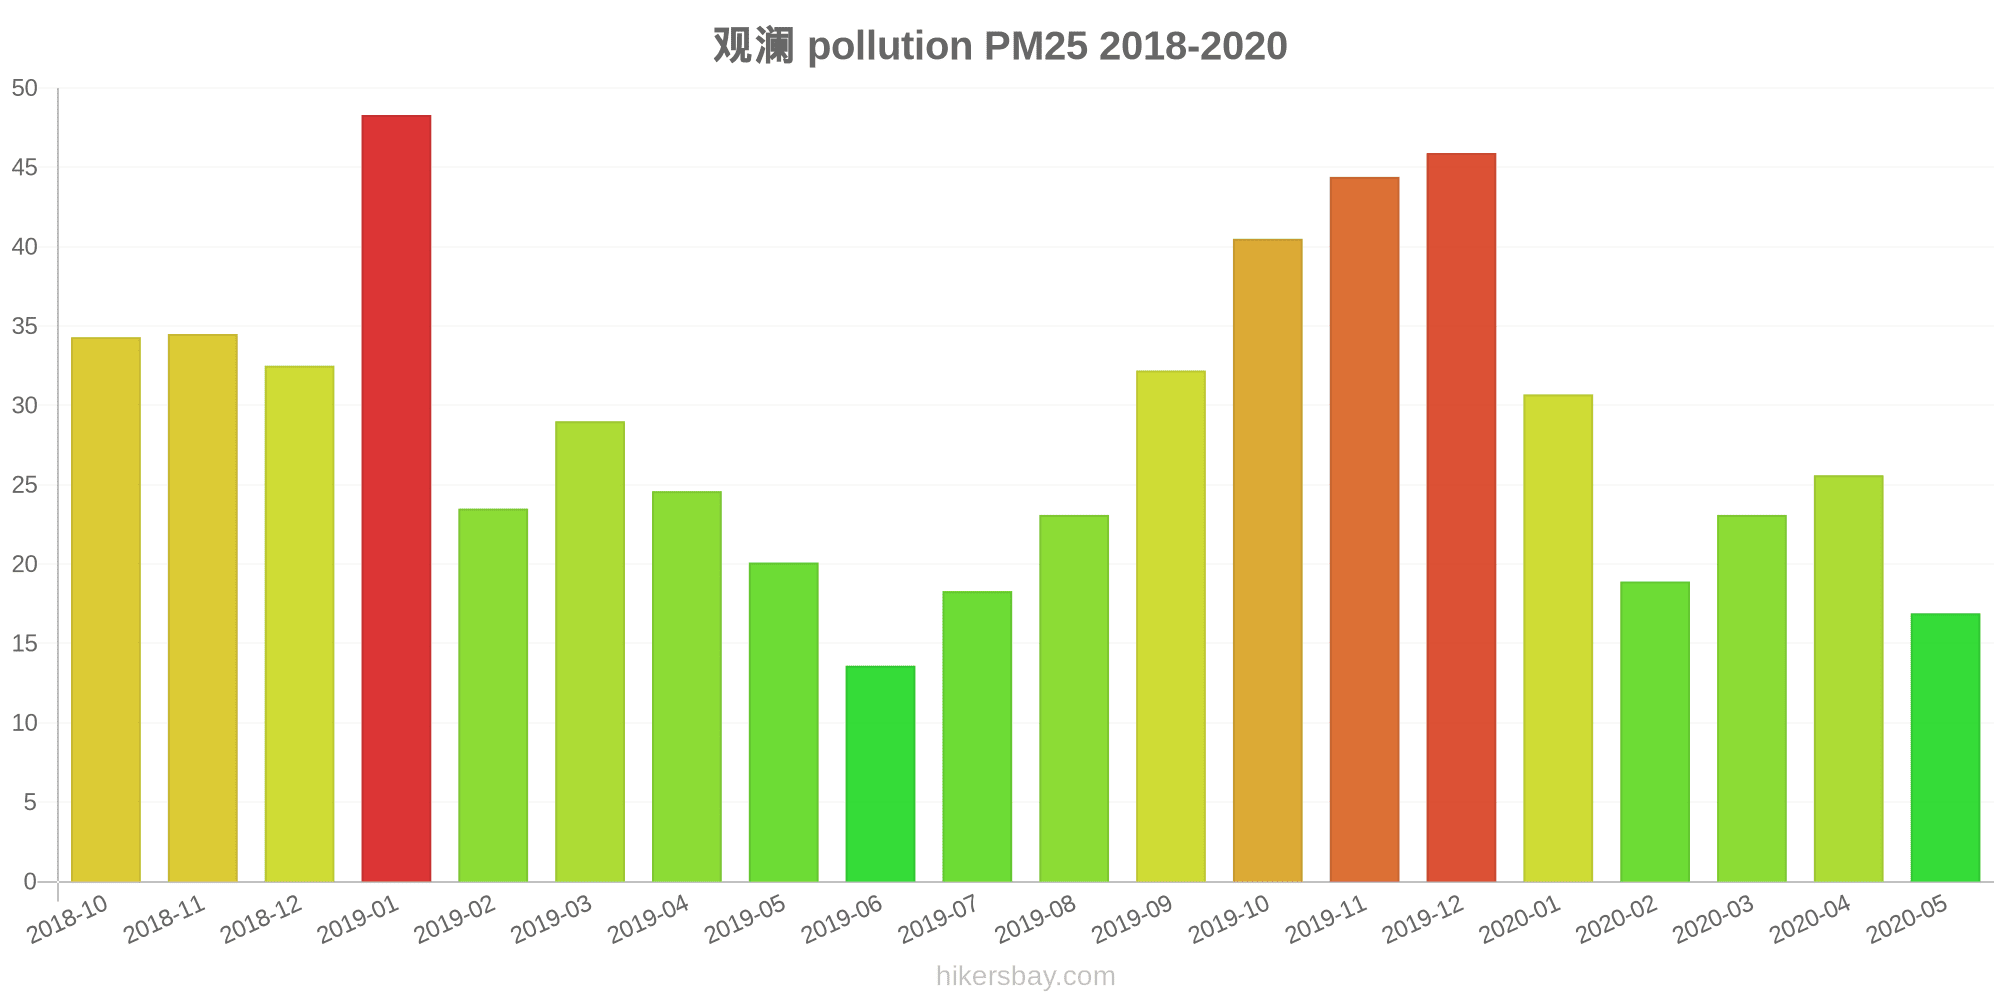
| pm25 | 17 | 26 | 23 | 19 | 31 | 46 | 44 | 41 | 32 | 23 | 18 | 14 | 20 | 25 | 29 | 24 | 48 | 33 | 35 | 34 |
| co | 488 | 607 | 714 | 640 | 742 | 629 | 681 | 789 | 663 | 590 | 583 | 540 | 617 | 670 | 710 | 703 | 945 | 739 | 765 | 647 |
| no2 | 20 | 33 | 29 | 19 | 17 | 36 | 34 | 22 | 21 | 22 | 27 | 20 | 14 | 21 | 23 | 12 | 28 | 38 | 41 | 37 |
| pm10 | 33 | 52 | 42 | 30 | 54 | 95 | 93 | 69 | 57 | 39 | 34 | 25 | 37 | 44 | 50 | 37 | 84 | 63 | 75 | 69 |
| so2 | 4.2 | 4.5 | 4.3 | 4.5 | 4.9 | 7.2 | 9.6 | 9.1 | 9.2 | 6.5 | 5.5 | 6.2 | 4.3 | 4.3 | 3.9 | 3.2 | 5.5 | 7.3 | 8 | 10 |