Luftverschmutzung in Yingchengzicun: Echtzeit-Luft-Qualitätsindex und Smog-Alarm.
Für die Yingchengzicun. Heute ist Donnerstag, 4. Juni 2026. Für Yingchengzicun wurden folgende Luftverschmutzungswerte gemessen:- Feinstaub (PM10) Schwebestaub - 7 (gut)
- Feinstaub (PM2,5) - 2 (gut)
- Kohlenmonoxid (CO) - 100 (gut)
- Stickstoffdioxid (NO2) - 8 (gut)
- Ozon (O3) - 0 (gut)
- Schwefeldioxid (SO2) - 9 (gut)

Wie ist die Luftqualität Yingchengzicun heute? Ist die Luft in Yingchengzicun? verschmutzt. Gibt es Smog?
Wie hoch ist der PM10-Stand heute in Yingchengzicun? (Feinstaub (PM10) Schwebestaub)
Der aktuelle Feinstaubgehalt PM10 in Yingchengzicun is:
7 (gut)
Die höchsten PM10-Werte treten in der Regel im Monat auf: 134 (Januar 2020).
Der niedrigste Wert der Feinstaub-PM10-Belastung in Yingchengzicun ist in der Regel in: August (33).
Wie hoch ist der aktuelle PM2,5-Wert in Yingchengzicun? (Feinstaub (PM2,5))
Die heutige PM2.5-Stufe ist:
2 (gut)
Zum Vergleich: Der höchste PM2,5-Wert in Yingchengzicun in den letzten 7 Tagen war: 24 (Freitag, 27. Mai 2022) und der niedrigste: 24 (Freitag, 27. Mai 2022).
Die höchsten PM2,5-Werte wurden gemessen: 102 (Januar 2020).
Die niedrigste Feinstaubbelastung PM2,5 tritt im Monat auf: August (19).
Wie hoch ist der CO-Gehalt? (Kohlenmonoxid (CO))
100 (gut)
Wie hoch ist das NO2-Niveau? (Stickstoffdioxid (NO2))
8 (gut)
Wie ist das O3-Niveau heute in Yingchengzicun? (Ozon (O3))
0 (gut)
Wie hoch ist die SO2-Belastung? (Schwefeldioxid (SO2))
9 (gut)
Aktuelle Daten Freitag, 27. Mai 2022, 12:00
PM10 7 (gut)
PM2,5 2 (gut)
CO 100 (gut)
NO2 8 (gut)
O3 0 (gut)
SO2 9 (gut)
Daten zur Luftverschmutzung der letzten Tage in Yingchengzicun
index
2022-05-27
pm10
32
Moderate
pm25
24
Moderate
co
468
Good
no2
21
Good
o3
32
Good
so2
5
Good
data source »
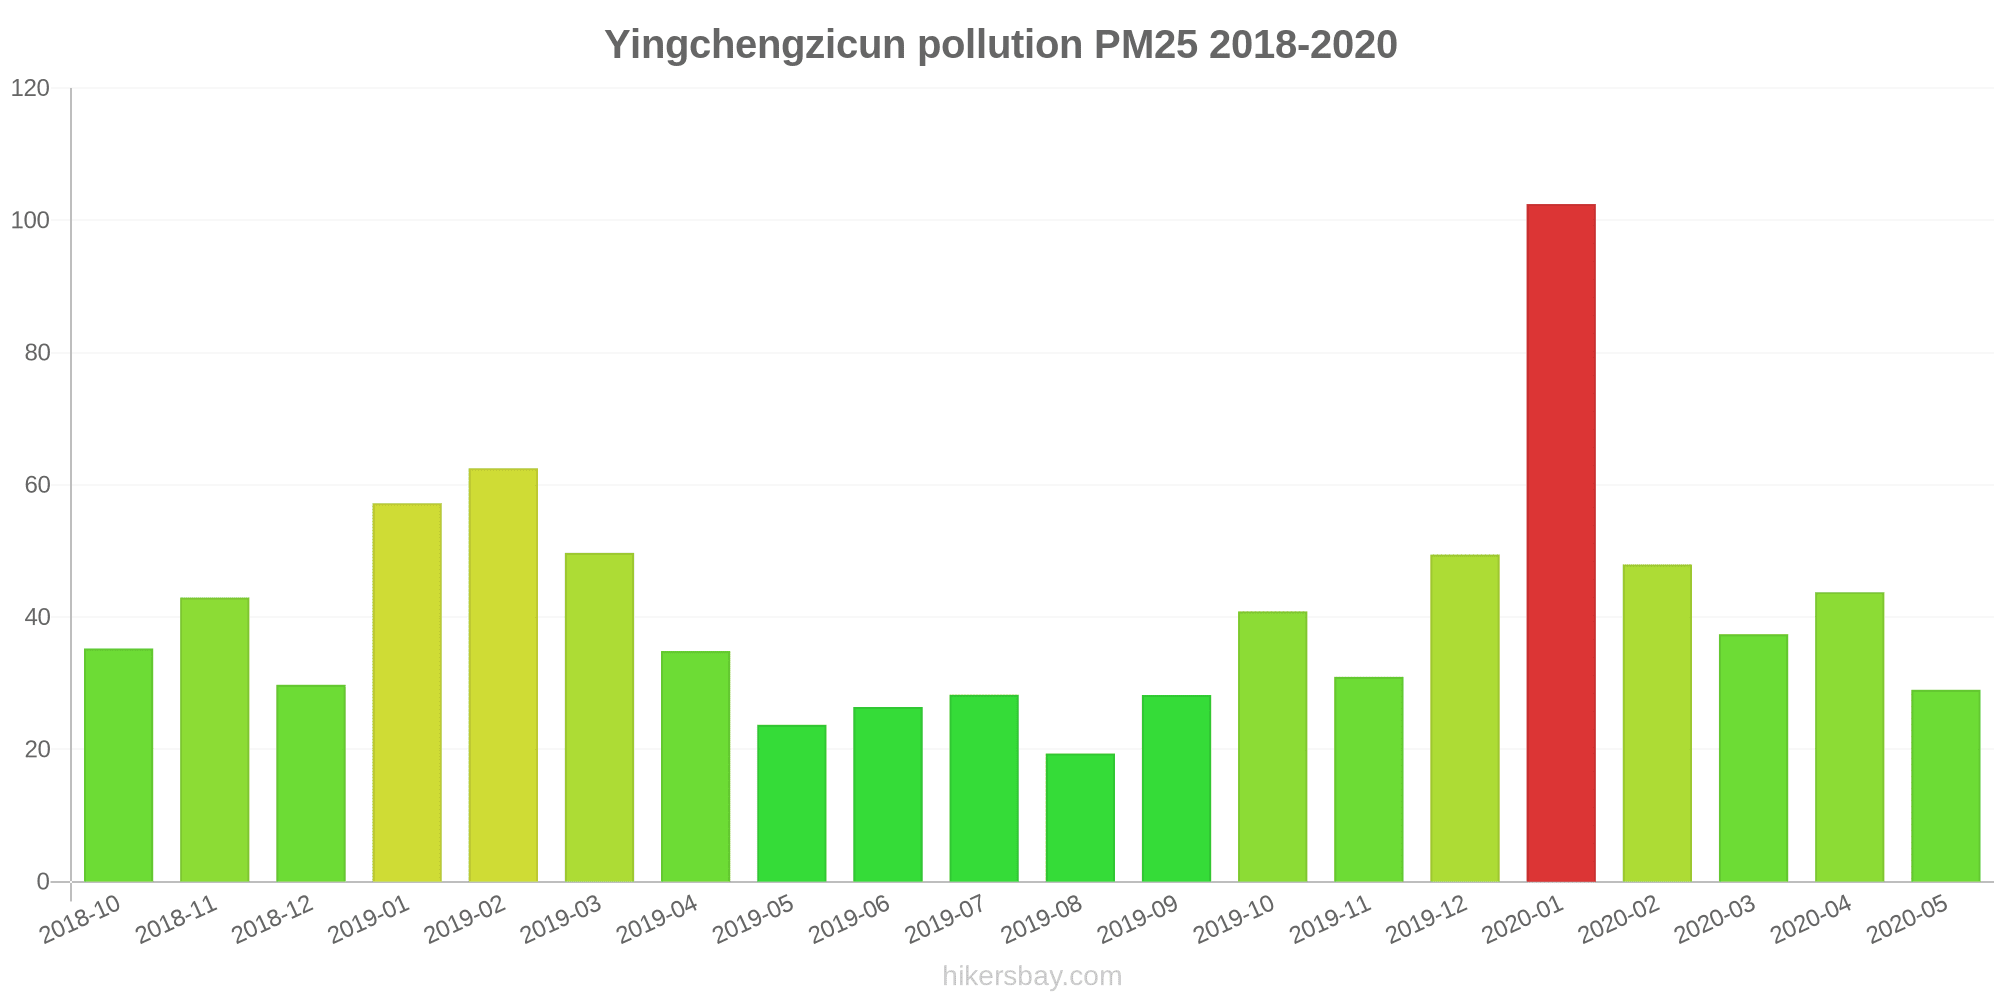
Luftverschmutzung in Yingchengzicun von Oktober 2018 bis Mai 2020

index
2020-05
2020-04
2020-03
2020-02
2020-01
2019-12
2019-11
2019-10
2019-09
2019-08
2019-07
2019-06
2019-05
2019-04
2019-03
2019-02
2019-01
2018-12
2018-11
2018-10
pm25
29 (Moderate)
44 (Unhealthy for Sensitive Groups)
37 (Unhealthy for Sensitive Groups)
48 (Unhealthy for Sensitive Groups)
102 (Very Unhealthy)
49 (Unhealthy for Sensitive Groups)
31 (Moderate)
41 (Unhealthy for Sensitive Groups)
28 (Moderate)
19 (Moderate)
28 (Moderate)
26 (Moderate)
24 (Moderate)
35 (Moderate)
50 (Unhealthy for Sensitive Groups)
63 (Unhealthy)
57 (Unhealthy)
30 (Moderate)
43 (Unhealthy for Sensitive Groups)
35 (Unhealthy for Sensitive Groups)
co
459 (Good)
469 (Good)
449 (Good)
1 (Good)
1 (Good)
1 (Good)
500 (Good)
489 (Good)
980 (Good)
911 (Good)
936 (Good)
765 (Good)
850 (Good)
929 (Good)
1 (Good)
1 (Good)
1 (Good)
440 (Good)
1 (Good)
491 (Good)
no2
24 (Good)
26 (Good)
26 (Good)
26 (Good)
50 (Moderate)
37 (Good)
38 (Good)
32 (Good)
26 (Good)
20 (Good)
19 (Good)
23 (Good)
22 (Good)
28 (Good)
35 (Good)
39 (Good)
47 (Moderate)
33 (Good)
41 (Moderate)
35 (Good)
o3
130 (Unhealthy for Sensitive Groups)
133 (Unhealthy for Sensitive Groups)
106 (Moderate)
86 (Moderate)
69 (Good)
63 (Good)
63 (Good)
102 (Moderate)
127 (Unhealthy for Sensitive Groups)
112 (Moderate)
174 (Unhealthy)
155 (Unhealthy)
151 (Unhealthy)
122 (Unhealthy for Sensitive Groups)
108 (Moderate)
84 (Moderate)
63 (Good)
52 (Good)
63 (Good)
79 (Moderate)
pm10
59 (Unhealthy for Sensitive Groups)
93 (Unhealthy)
67 (Unhealthy for Sensitive Groups)
75 (Unhealthy for Sensitive Groups)
134 (Very Unhealthy)
75 (Unhealthy for Sensitive Groups)
58 (Unhealthy for Sensitive Groups)
72 (Unhealthy for Sensitive Groups)
52 (Unhealthy for Sensitive Groups)
33 (Moderate)
46 (Moderate)
44 (Moderate)
59 (Unhealthy for Sensitive Groups)
83 (Unhealthy)
89 (Unhealthy)
96 (Unhealthy)
99 (Unhealthy)
55 (Unhealthy for Sensitive Groups)
70 (Unhealthy for Sensitive Groups)
63 (Unhealthy for Sensitive Groups)
so2
11 (Good)
17 (Good)
15 (Good)
14 (Good)
25 (Good)
17 (Good)
20 (Good)
14 (Good)
11 (Good)
6 (Good)
7.3 (Good)
8.7 (Good)
12 (Good)
15 (Good)
21 (Good)
28 (Good)
29 (Good)
23 (Good)
21 (Good)
18 (Good)
data source »
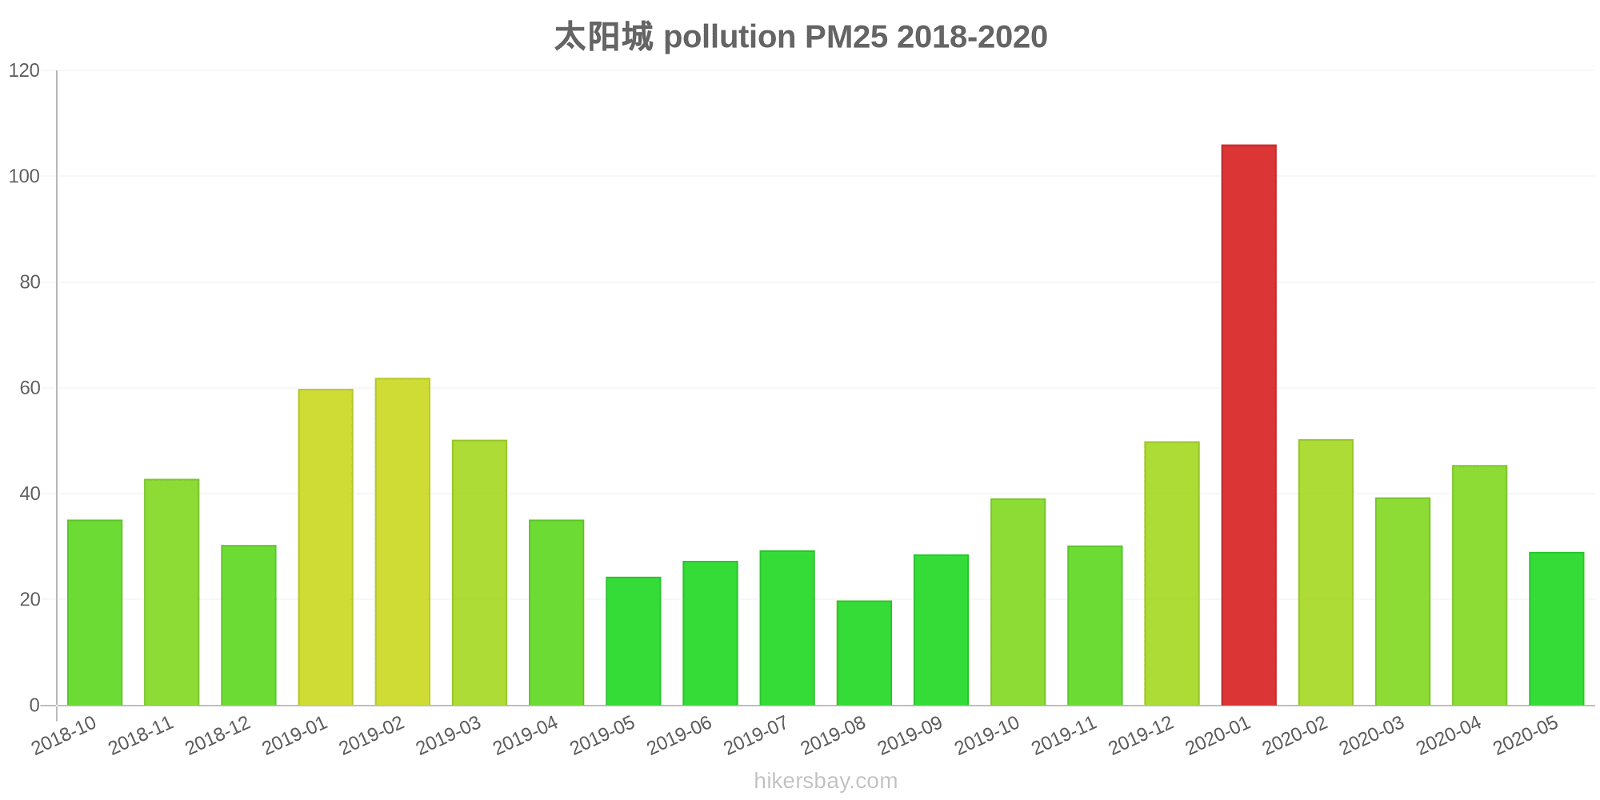
太阳城
Freitag, 27. Mai 2022, 12:00
PM10 6.7 (gut)
Feinstaub (PM10) Schwebestaub
PM2,5 1.7 (gut)
Feinstaub (PM2,5)
CO 100 (gut)
Kohlenmonoxid (CO)
NO2 7.6 (gut)
Stickstoffdioxid (NO2)
O3 0.02 (gut)
Ozon (O3)
SO2 8.6 (gut)
Schwefeldioxid (SO2)
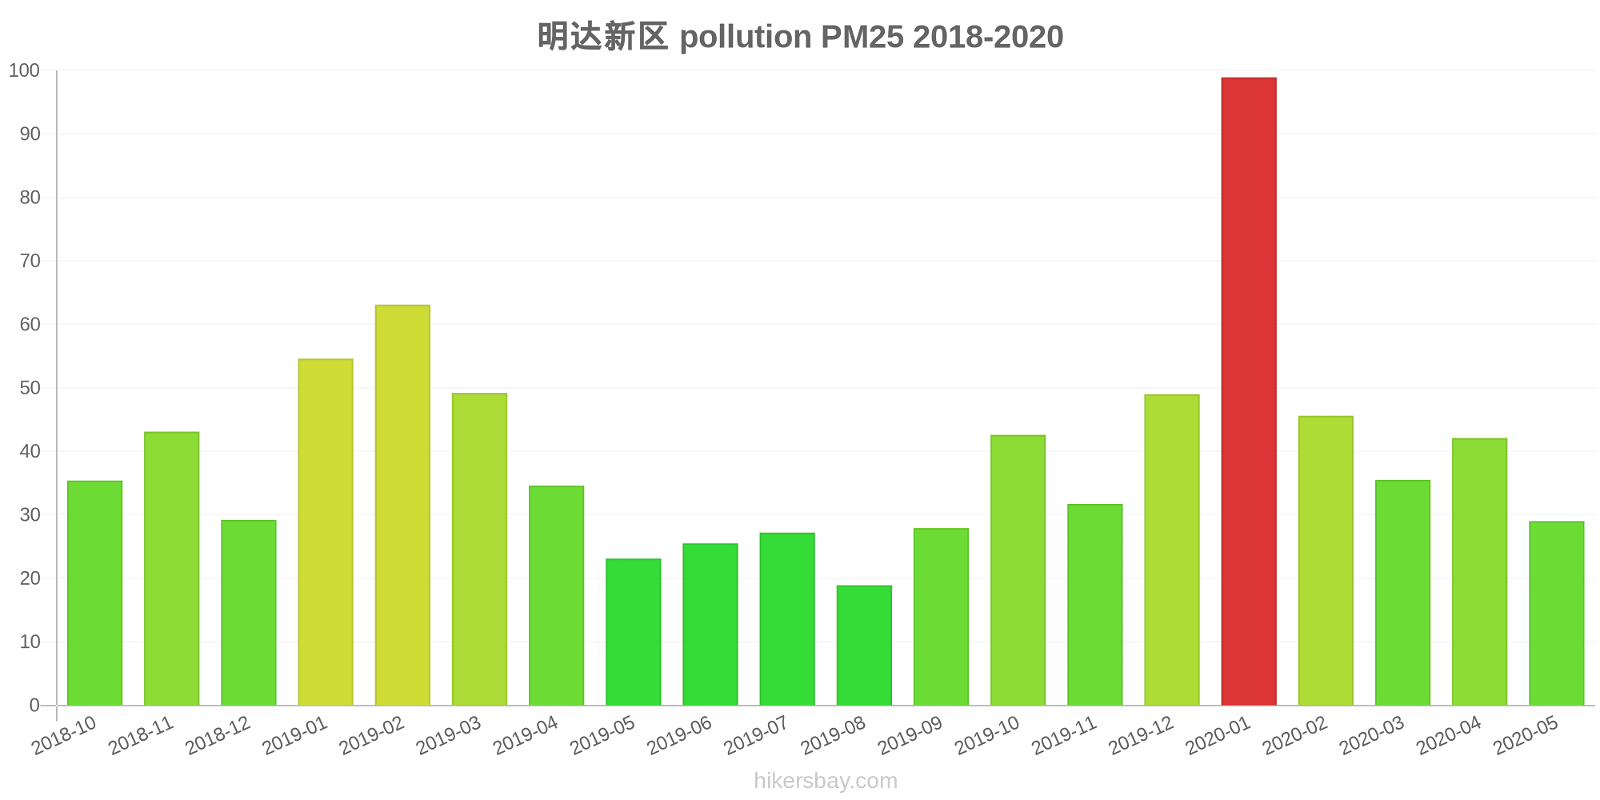
明达新区
Freitag, 27. Mai 2022, 12:00
PM10 6.7 (gut)
Feinstaub (PM10) Schwebestaub
PM2,5 1.7 (gut)
Feinstaub (PM2,5)
CO 100 (gut)
Kohlenmonoxid (CO)
NO2 7.6 (gut)
Stickstoffdioxid (NO2)
O3 0.02 (gut)
Ozon (O3)
SO2 8.6 (gut)
Schwefeldioxid (SO2)
太阳城
index
2022-05-27
pm10
32
pm25
24
co
468
no2
21
o3
32
so2
4.6
明达新区
index
2022-05-27
pm10
32
pm25
24
co
468
no2
21
o3
32
so2
4.6
太阳城
2018-10 2020-05
index
2020-05
2020-04
2020-03
2020-02
2020-01
2019-12
2019-11
2019-10
2019-09
2019-08
2019-07
2019-06
2019-05
2019-04
2019-03
2019-02
2019-01
2018-12
2018-11
2018-10
pm25
29
45
39
50
106
50
30
39
29
20
29
27
24
35
50
62
60
30
43
35
co
1
1
1
1
1
1
999
977
962
985
992
822
865
984
1
1
1
879
1
1
no2
25
28
29
29
51
38
39
34
27
21
22
26
25
29
36
40
48
34
42
36
o3
131
132
103
86
70
65
63
102
127
110
176
154
150
123
105
84
55
55
66
82
pm10
58
98
71
79
138
79
58
73
52
33
47
44
59
84
90
97
101
55
67
59
so2
11
18
15
14
26
17
20
14
11
6.3
6.5
7.6
11
12
18
26
28
22
19
15
明达新区
2018-10 2020-05
index
2020-05
2020-04
2020-03
2020-02
2020-01
2019-12
2019-11
2019-10
2019-09
2019-08
2019-07
2019-06
2019-05
2019-04
2019-03
2019-02
2019-01
2018-12
2018-11
2018-10
pm25
29
42
36
46
99
49
32
43
28
19
27
26
23
35
49
63
55
29
43
35
co
916
936
897
1
1
1
1
1
998
836
880
708
835
873
1
1
1
1
1
981
no2
24
25
23
24
50
35
38
31
25
18
16
20
20
26
35
38
46
32
41
34
o3
129
133
108
86
68
62
63
101
127
114
172
155
152
121
110
83
71
49
60
75
pm10
60
87
63
71
129
72
59
72
51
33
45
43
59
81
88
95
98
55
72
67
so2
11
16
14
14
24
17
21
15
9.9
5.8
8
9.9
14
17
23
30
30
24
22
21
* Pollution data source:
https://openaq.org
(ChinaAQIData)
The data is licensed under CC-By 4.0
PM10 7 (gut)
PM2,5 2 (gut)
CO 100 (gut)
NO2 8 (gut)
O3 0 (gut)
SO2 9 (gut)
Daten zur Luftverschmutzung der letzten Tage in Yingchengzicun
| index | 2022-05-27 |
|---|---|
| pm10 | 32 Moderate |
| pm25 | 24 Moderate |
| co | 468 Good |
| no2 | 21 Good |
| o3 | 32 Good |
| so2 | 5 Good |
| index | 2020-05 | 2020-04 | 2020-03 | 2020-02 | 2020-01 | 2019-12 | 2019-11 | 2019-10 | 2019-09 | 2019-08 | 2019-07 | 2019-06 | 2019-05 | 2019-04 | 2019-03 | 2019-02 | 2019-01 | 2018-12 | 2018-11 | 2018-10 |
|---|---|---|---|---|---|---|---|---|---|---|---|---|---|---|---|---|---|---|---|---|
| pm25 | 29 (Moderate) | 44 (Unhealthy for Sensitive Groups) | 37 (Unhealthy for Sensitive Groups) | 48 (Unhealthy for Sensitive Groups) | 102 (Very Unhealthy) | 49 (Unhealthy for Sensitive Groups) | 31 (Moderate) | 41 (Unhealthy for Sensitive Groups) | 28 (Moderate) | 19 (Moderate) | 28 (Moderate) | 26 (Moderate) | 24 (Moderate) | 35 (Moderate) | 50 (Unhealthy for Sensitive Groups) | 63 (Unhealthy) | 57 (Unhealthy) | 30 (Moderate) | 43 (Unhealthy for Sensitive Groups) | 35 (Unhealthy for Sensitive Groups) |
| co | 459 (Good) | 469 (Good) | 449 (Good) | 1 (Good) | 1 (Good) | 1 (Good) | 500 (Good) | 489 (Good) | 980 (Good) | 911 (Good) | 936 (Good) | 765 (Good) | 850 (Good) | 929 (Good) | 1 (Good) | 1 (Good) | 1 (Good) | 440 (Good) | 1 (Good) | 491 (Good) |
| no2 | 24 (Good) | 26 (Good) | 26 (Good) | 26 (Good) | 50 (Moderate) | 37 (Good) | 38 (Good) | 32 (Good) | 26 (Good) | 20 (Good) | 19 (Good) | 23 (Good) | 22 (Good) | 28 (Good) | 35 (Good) | 39 (Good) | 47 (Moderate) | 33 (Good) | 41 (Moderate) | 35 (Good) |
| o3 | 130 (Unhealthy for Sensitive Groups) | 133 (Unhealthy for Sensitive Groups) | 106 (Moderate) | 86 (Moderate) | 69 (Good) | 63 (Good) | 63 (Good) | 102 (Moderate) | 127 (Unhealthy for Sensitive Groups) | 112 (Moderate) | 174 (Unhealthy) | 155 (Unhealthy) | 151 (Unhealthy) | 122 (Unhealthy for Sensitive Groups) | 108 (Moderate) | 84 (Moderate) | 63 (Good) | 52 (Good) | 63 (Good) | 79 (Moderate) |
| pm10 | 59 (Unhealthy for Sensitive Groups) | 93 (Unhealthy) | 67 (Unhealthy for Sensitive Groups) | 75 (Unhealthy for Sensitive Groups) | 134 (Very Unhealthy) | 75 (Unhealthy for Sensitive Groups) | 58 (Unhealthy for Sensitive Groups) | 72 (Unhealthy for Sensitive Groups) | 52 (Unhealthy for Sensitive Groups) | 33 (Moderate) | 46 (Moderate) | 44 (Moderate) | 59 (Unhealthy for Sensitive Groups) | 83 (Unhealthy) | 89 (Unhealthy) | 96 (Unhealthy) | 99 (Unhealthy) | 55 (Unhealthy for Sensitive Groups) | 70 (Unhealthy for Sensitive Groups) | 63 (Unhealthy for Sensitive Groups) |
| so2 | 11 (Good) | 17 (Good) | 15 (Good) | 14 (Good) | 25 (Good) | 17 (Good) | 20 (Good) | 14 (Good) | 11 (Good) | 6 (Good) | 7.3 (Good) | 8.7 (Good) | 12 (Good) | 15 (Good) | 21 (Good) | 28 (Good) | 29 (Good) | 23 (Good) | 21 (Good) | 18 (Good) |
PM10 6.7 (gut)
Feinstaub (PM10) SchwebestaubPM2,5 1.7 (gut)
Feinstaub (PM2,5)CO 100 (gut)
Kohlenmonoxid (CO)NO2 7.6 (gut)
Stickstoffdioxid (NO2)O3 0.02 (gut)
Ozon (O3)SO2 8.6 (gut)
Schwefeldioxid (SO2)PM10 6.7 (gut)
Feinstaub (PM10) SchwebestaubPM2,5 1.7 (gut)
Feinstaub (PM2,5)CO 100 (gut)
Kohlenmonoxid (CO)NO2 7.6 (gut)
Stickstoffdioxid (NO2)O3 0.02 (gut)
Ozon (O3)SO2 8.6 (gut)
Schwefeldioxid (SO2)太阳城
| index | 2022-05-27 |
|---|---|
| pm10 | 32 |
| pm25 | 24 |
| co | 468 |
| no2 | 21 |
| o3 | 32 |
| so2 | 4.6 |
明达新区
| index | 2022-05-27 |
|---|---|
| pm10 | 32 |
| pm25 | 24 |
| co | 468 |
| no2 | 21 |
| o3 | 32 |
| so2 | 4.6 |
太阳城

| index | 2020-05 | 2020-04 | 2020-03 | 2020-02 | 2020-01 | 2019-12 | 2019-11 | 2019-10 | 2019-09 | 2019-08 | 2019-07 | 2019-06 | 2019-05 | 2019-04 | 2019-03 | 2019-02 | 2019-01 | 2018-12 | 2018-11 | 2018-10 |
|---|---|---|---|---|---|---|---|---|---|---|---|---|---|---|---|---|---|---|---|---|
| pm25 | 29 | 45 | 39 | 50 | 106 | 50 | 30 | 39 | 29 | 20 | 29 | 27 | 24 | 35 | 50 | 62 | 60 | 30 | 43 | 35 |
| co | 1 | 1 | 1 | 1 | 1 | 1 | 999 | 977 | 962 | 985 | 992 | 822 | 865 | 984 | 1 | 1 | 1 | 879 | 1 | 1 |
| no2 | 25 | 28 | 29 | 29 | 51 | 38 | 39 | 34 | 27 | 21 | 22 | 26 | 25 | 29 | 36 | 40 | 48 | 34 | 42 | 36 |
| o3 | 131 | 132 | 103 | 86 | 70 | 65 | 63 | 102 | 127 | 110 | 176 | 154 | 150 | 123 | 105 | 84 | 55 | 55 | 66 | 82 |
| pm10 | 58 | 98 | 71 | 79 | 138 | 79 | 58 | 73 | 52 | 33 | 47 | 44 | 59 | 84 | 90 | 97 | 101 | 55 | 67 | 59 |
| so2 | 11 | 18 | 15 | 14 | 26 | 17 | 20 | 14 | 11 | 6.3 | 6.5 | 7.6 | 11 | 12 | 18 | 26 | 28 | 22 | 19 | 15 |
明达新区

| index | 2020-05 | 2020-04 | 2020-03 | 2020-02 | 2020-01 | 2019-12 | 2019-11 | 2019-10 | 2019-09 | 2019-08 | 2019-07 | 2019-06 | 2019-05 | 2019-04 | 2019-03 | 2019-02 | 2019-01 | 2018-12 | 2018-11 | 2018-10 |
|---|---|---|---|---|---|---|---|---|---|---|---|---|---|---|---|---|---|---|---|---|
| pm25 | 29 | 42 | 36 | 46 | 99 | 49 | 32 | 43 | 28 | 19 | 27 | 26 | 23 | 35 | 49 | 63 | 55 | 29 | 43 | 35 |
| co | 916 | 936 | 897 | 1 | 1 | 1 | 1 | 1 | 998 | 836 | 880 | 708 | 835 | 873 | 1 | 1 | 1 | 1 | 1 | 981 |
| no2 | 24 | 25 | 23 | 24 | 50 | 35 | 38 | 31 | 25 | 18 | 16 | 20 | 20 | 26 | 35 | 38 | 46 | 32 | 41 | 34 |
| o3 | 129 | 133 | 108 | 86 | 68 | 62 | 63 | 101 | 127 | 114 | 172 | 155 | 152 | 121 | 110 | 83 | 71 | 49 | 60 | 75 |
| pm10 | 60 | 87 | 63 | 71 | 129 | 72 | 59 | 72 | 51 | 33 | 45 | 43 | 59 | 81 | 88 | 95 | 98 | 55 | 72 | 67 |
| so2 | 11 | 16 | 14 | 14 | 24 | 17 | 21 | 15 | 9.9 | 5.8 | 8 | 9.9 | 14 | 17 | 23 | 30 | 30 | 24 | 22 | 21 |