Luftverschmutzung in Guanjiatun: Echtzeit-Luft-Qualitätsindex und Smog-Alarm.
Für die Guanjiatun. Heute ist Donnerstag, 4. Juni 2026. Für Guanjiatun wurden folgende Luftverschmutzungswerte gemessen:- Feinstaub (PM10) Schwebestaub - 7 (gut)
- Feinstaub (PM2,5) - 2 (gut)
- Kohlenmonoxid (CO) - 100 (gut)
- Stickstoffdioxid (NO2) - 8 (gut)
- Ozon (O3) - 0 (gut)
- Schwefeldioxid (SO2) - 9 (gut)

Wie ist die Luftqualität Guanjiatun heute? Ist die Luft in Guanjiatun? verschmutzt. Gibt es Smog?
Wie hoch ist der PM10-Stand heute in Guanjiatun? (Feinstaub (PM10) Schwebestaub)
Der aktuelle Feinstaubgehalt PM10 in Guanjiatun is:
7 (gut)
Die höchsten PM10-Werte treten in der Regel im Monat auf: 120 (Januar 2020).
Der niedrigste Wert der Feinstaub-PM10-Belastung in Guanjiatun ist in der Regel in: August (31).
Wie hoch ist der aktuelle PM2,5-Wert in Guanjiatun? (Feinstaub (PM2,5))
Die heutige PM2.5-Stufe ist:
2 (gut)
Zum Vergleich: Der höchste PM2,5-Wert in Guanjiatun in den letzten 7 Tagen war: 24 (Freitag, 27. Mai 2022) und der niedrigste: 24 (Freitag, 27. Mai 2022).
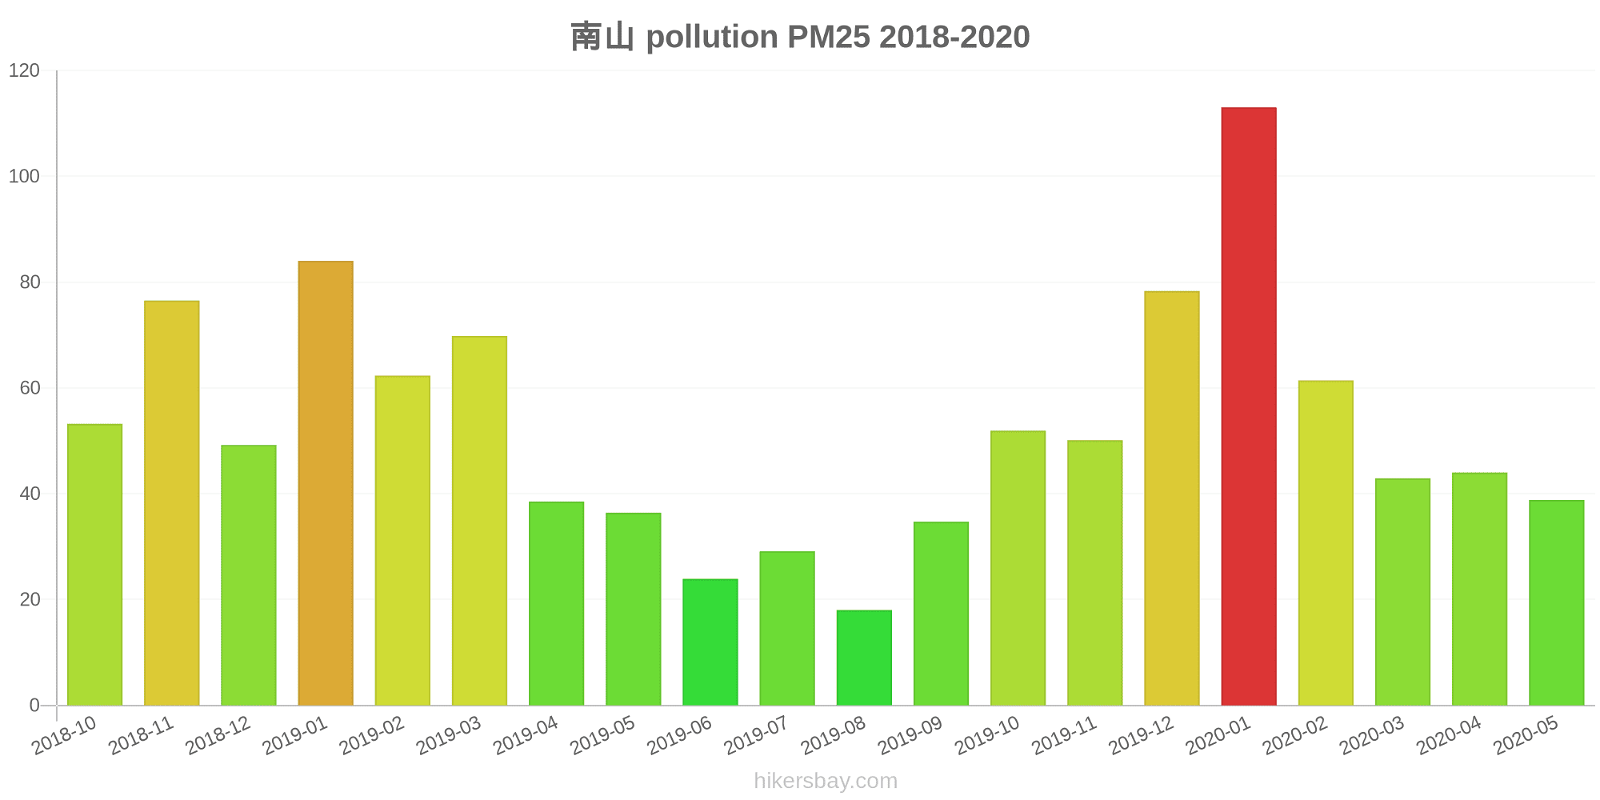
Die höchsten PM2,5-Werte wurden gemessen: 113 (Januar 2020).
Die niedrigste Feinstaubbelastung PM2,5 tritt im Monat auf: August (18).
Wie hoch ist der CO-Gehalt? (Kohlenmonoxid (CO))
100 (gut)
Wie hoch ist das NO2-Niveau? (Stickstoffdioxid (NO2))
8 (gut)
Wie ist das O3-Niveau heute in Guanjiatun? (Ozon (O3))
0 (gut)
Wie hoch ist die SO2-Belastung? (Schwefeldioxid (SO2))
9 (gut)
Aktuelle Daten Freitag, 27. Mai 2022, 12:00
PM10 7 (gut)
PM2,5 2 (gut)
CO 100 (gut)
NO2 8 (gut)
O3 0 (gut)
SO2 9 (gut)
Daten zur Luftverschmutzung der letzten Tage in Guanjiatun
index
2022-05-27
pm10
32
Moderate
pm25
24
Moderate
co
468
Good
no2
21
Good
o3
32
Good
so2
5
Good
data source »
Luftverschmutzung in Guanjiatun von Oktober 2018 bis Mai 2020

index
2020-05
2020-04
2020-03
2020-02
2020-01
2019-12
2019-11
2019-10
2019-09
2019-08
2019-07
2019-06
2019-05
2019-04
2019-03
2019-02
2019-01
2018-12
2018-11
2018-10
pm25
39 (Unhealthy for Sensitive Groups)
44 (Unhealthy for Sensitive Groups)
43 (Unhealthy for Sensitive Groups)
61 (Unhealthy)
113 (Very bad Hazardous)
78 (Very Unhealthy)
50 (Unhealthy for Sensitive Groups)
52 (Unhealthy for Sensitive Groups)
35 (Moderate)
18 (Moderate)
29 (Moderate)
24 (Moderate)
36 (Unhealthy for Sensitive Groups)
39 (Unhealthy for Sensitive Groups)
70 (Unhealthy)
62 (Unhealthy)
84 (Very Unhealthy)
49 (Unhealthy for Sensitive Groups)
77 (Very Unhealthy)
53 (Unhealthy for Sensitive Groups)
co
705 (Good)
684 (Good)
616 (Good)
922 (Good)
1 (Good)
1 (Good)
999 (Good)
956 (Good)
866 (Good)
760 (Good)
822 (Good)
669 (Good)
641 (Good)
802 (Good)
991 (Good)
1 (Good)
1 (Good)
1 (Good)
1 (Good)
979 (Good)
no2
22 (Good)
26 (Good)
25 (Good)
22 (Good)
42 (Moderate)
41 (Moderate)
35 (Good)
32 (Good)
29 (Good)
17 (Good)
16 (Good)
19 (Good)
24 (Good)
26 (Good)
40 (Good)
37 (Good)
46 (Moderate)
33 (Good)
41 (Moderate)
27 (Good)
o3
143 (Unhealthy for Sensitive Groups)
132 (Unhealthy for Sensitive Groups)
100 (Moderate)
85 (Moderate)
75 (Moderate)
58 (Good)
56 (Good)
96 (Moderate)
143 (Unhealthy for Sensitive Groups)
118 (Moderate)
163 (Unhealthy)
154 (Unhealthy)
159 (Unhealthy)
121 (Unhealthy for Sensitive Groups)
104 (Moderate)
83 (Moderate)
67 (Good)
66 (Good)
72 (Moderate)
90 (Moderate)
pm10
57 (Unhealthy for Sensitive Groups)
76 (Unhealthy for Sensitive Groups)
61 (Unhealthy for Sensitive Groups)
67 (Unhealthy for Sensitive Groups)
120 (Very Unhealthy)
86 (Unhealthy)
68 (Unhealthy for Sensitive Groups)
67 (Unhealthy for Sensitive Groups)
53 (Unhealthy for Sensitive Groups)
31 (Moderate)
45 (Moderate)
40 (Moderate)
71 (Unhealthy for Sensitive Groups)
87 (Unhealthy)
104 (Unhealthy)
79 (Unhealthy for Sensitive Groups)
119 (Very Unhealthy)
78 (Unhealthy for Sensitive Groups)
113 (Very Unhealthy)
74 (Unhealthy for Sensitive Groups)
so2
22 (Good)
18 (Good)
24 (Good)
25 (Good)
41 (Good)
46 (Good)
30 (Good)
16 (Good)
16 (Good)
13 (Good)
11 (Good)
15 (Good)
22 (Good)
20 (Good)
31 (Good)
39 (Good)
48 (Good)
39 (Good)
35 (Good)
18 (Good)
data source »
南山
Freitag, 27. Mai 2022, 12:00
PM10 6.7 (gut)
Feinstaub (PM10) Schwebestaub
PM2,5 1.7 (gut)
Feinstaub (PM2,5)
CO 100 (gut)
Kohlenmonoxid (CO)
NO2 7.6 (gut)
Stickstoffdioxid (NO2)
O3 0.02 (gut)
Ozon (O3)
SO2 8.6 (gut)
Schwefeldioxid (SO2)
南山
index
2022-05-27
pm10
32
pm25
24
co
468
no2
21
o3
32
so2
4.6
南山
2018-10 2020-05
index
2020-05
2020-04
2020-03
2020-02
2020-01
2019-12
2019-11
2019-10
2019-09
2019-08
2019-07
2019-06
2019-05
2019-04
2019-03
2019-02
2019-01
2018-12
2018-11
2018-10
pm25
39
44
43
61
113
78
50
52
35
18
29
24
36
39
70
62
84
49
77
53
co
705
684
616
922
1
1
999
956
866
760
822
669
641
802
991
1
1
1
1
979
no2
22
26
25
22
42
41
35
32
29
17
16
19
24
26
40
37
46
33
41
27
o3
143
132
100
85
75
58
56
96
143
118
163
154
159
121
104
83
67
66
72
90
pm10
57
76
61
67
120
86
68
67
53
31
45
40
71
87
104
79
119
78
113
74
so2
22
18
24
25
41
46
30
16
16
13
11
15
22
20
31
39
48
39
35
18
* Pollution data source:
https://openaq.org
(ChinaAQIData)
The data is licensed under CC-By 4.0
PM10 7 (gut)
PM2,5 2 (gut)
CO 100 (gut)
NO2 8 (gut)
O3 0 (gut)
SO2 9 (gut)
Daten zur Luftverschmutzung der letzten Tage in Guanjiatun
| index | 2022-05-27 |
|---|---|
| pm10 | 32 Moderate |
| pm25 | 24 Moderate |
| co | 468 Good |
| no2 | 21 Good |
| o3 | 32 Good |
| so2 | 5 Good |

| index | 2020-05 | 2020-04 | 2020-03 | 2020-02 | 2020-01 | 2019-12 | 2019-11 | 2019-10 | 2019-09 | 2019-08 | 2019-07 | 2019-06 | 2019-05 | 2019-04 | 2019-03 | 2019-02 | 2019-01 | 2018-12 | 2018-11 | 2018-10 |
|---|---|---|---|---|---|---|---|---|---|---|---|---|---|---|---|---|---|---|---|---|
| pm25 | 39 (Unhealthy for Sensitive Groups) | 44 (Unhealthy for Sensitive Groups) | 43 (Unhealthy for Sensitive Groups) | 61 (Unhealthy) | 113 (Very bad Hazardous) | 78 (Very Unhealthy) | 50 (Unhealthy for Sensitive Groups) | 52 (Unhealthy for Sensitive Groups) | 35 (Moderate) | 18 (Moderate) | 29 (Moderate) | 24 (Moderate) | 36 (Unhealthy for Sensitive Groups) | 39 (Unhealthy for Sensitive Groups) | 70 (Unhealthy) | 62 (Unhealthy) | 84 (Very Unhealthy) | 49 (Unhealthy for Sensitive Groups) | 77 (Very Unhealthy) | 53 (Unhealthy for Sensitive Groups) |
| co | 705 (Good) | 684 (Good) | 616 (Good) | 922 (Good) | 1 (Good) | 1 (Good) | 999 (Good) | 956 (Good) | 866 (Good) | 760 (Good) | 822 (Good) | 669 (Good) | 641 (Good) | 802 (Good) | 991 (Good) | 1 (Good) | 1 (Good) | 1 (Good) | 1 (Good) | 979 (Good) |
| no2 | 22 (Good) | 26 (Good) | 25 (Good) | 22 (Good) | 42 (Moderate) | 41 (Moderate) | 35 (Good) | 32 (Good) | 29 (Good) | 17 (Good) | 16 (Good) | 19 (Good) | 24 (Good) | 26 (Good) | 40 (Good) | 37 (Good) | 46 (Moderate) | 33 (Good) | 41 (Moderate) | 27 (Good) |
| o3 | 143 (Unhealthy for Sensitive Groups) | 132 (Unhealthy for Sensitive Groups) | 100 (Moderate) | 85 (Moderate) | 75 (Moderate) | 58 (Good) | 56 (Good) | 96 (Moderate) | 143 (Unhealthy for Sensitive Groups) | 118 (Moderate) | 163 (Unhealthy) | 154 (Unhealthy) | 159 (Unhealthy) | 121 (Unhealthy for Sensitive Groups) | 104 (Moderate) | 83 (Moderate) | 67 (Good) | 66 (Good) | 72 (Moderate) | 90 (Moderate) |
| pm10 | 57 (Unhealthy for Sensitive Groups) | 76 (Unhealthy for Sensitive Groups) | 61 (Unhealthy for Sensitive Groups) | 67 (Unhealthy for Sensitive Groups) | 120 (Very Unhealthy) | 86 (Unhealthy) | 68 (Unhealthy for Sensitive Groups) | 67 (Unhealthy for Sensitive Groups) | 53 (Unhealthy for Sensitive Groups) | 31 (Moderate) | 45 (Moderate) | 40 (Moderate) | 71 (Unhealthy for Sensitive Groups) | 87 (Unhealthy) | 104 (Unhealthy) | 79 (Unhealthy for Sensitive Groups) | 119 (Very Unhealthy) | 78 (Unhealthy for Sensitive Groups) | 113 (Very Unhealthy) | 74 (Unhealthy for Sensitive Groups) |
| so2 | 22 (Good) | 18 (Good) | 24 (Good) | 25 (Good) | 41 (Good) | 46 (Good) | 30 (Good) | 16 (Good) | 16 (Good) | 13 (Good) | 11 (Good) | 15 (Good) | 22 (Good) | 20 (Good) | 31 (Good) | 39 (Good) | 48 (Good) | 39 (Good) | 35 (Good) | 18 (Good) |
PM10 6.7 (gut)
Feinstaub (PM10) SchwebestaubPM2,5 1.7 (gut)
Feinstaub (PM2,5)CO 100 (gut)
Kohlenmonoxid (CO)NO2 7.6 (gut)
Stickstoffdioxid (NO2)O3 0.02 (gut)
Ozon (O3)SO2 8.6 (gut)
Schwefeldioxid (SO2)南山
| index | 2022-05-27 |
|---|---|
| pm10 | 32 |
| pm25 | 24 |
| co | 468 |
| no2 | 21 |
| o3 | 32 |
| so2 | 4.6 |
南山

| index | 2020-05 | 2020-04 | 2020-03 | 2020-02 | 2020-01 | 2019-12 | 2019-11 | 2019-10 | 2019-09 | 2019-08 | 2019-07 | 2019-06 | 2019-05 | 2019-04 | 2019-03 | 2019-02 | 2019-01 | 2018-12 | 2018-11 | 2018-10 |
|---|---|---|---|---|---|---|---|---|---|---|---|---|---|---|---|---|---|---|---|---|
| pm25 | 39 | 44 | 43 | 61 | 113 | 78 | 50 | 52 | 35 | 18 | 29 | 24 | 36 | 39 | 70 | 62 | 84 | 49 | 77 | 53 |
| co | 705 | 684 | 616 | 922 | 1 | 1 | 999 | 956 | 866 | 760 | 822 | 669 | 641 | 802 | 991 | 1 | 1 | 1 | 1 | 979 |
| no2 | 22 | 26 | 25 | 22 | 42 | 41 | 35 | 32 | 29 | 17 | 16 | 19 | 24 | 26 | 40 | 37 | 46 | 33 | 41 | 27 |
| o3 | 143 | 132 | 100 | 85 | 75 | 58 | 56 | 96 | 143 | 118 | 163 | 154 | 159 | 121 | 104 | 83 | 67 | 66 | 72 | 90 |
| pm10 | 57 | 76 | 61 | 67 | 120 | 86 | 68 | 67 | 53 | 31 | 45 | 40 | 71 | 87 | 104 | 79 | 119 | 78 | 113 | 74 |
| so2 | 22 | 18 | 24 | 25 | 41 | 46 | 30 | 16 | 16 | 13 | 11 | 15 | 22 | 20 | 31 | 39 | 48 | 39 | 35 | 18 |