Luftverschmutzung in Zhaomingcun: Echtzeit-Luft-Qualitätsindex und Smog-Alarm.
Für die Zhaomingcun. Heute ist Donnerstag, 4. Juni 2026. Für Zhaomingcun wurden folgende Luftverschmutzungswerte gemessen:- Feinstaub (PM10) Schwebestaub - 7 (gut)
- Feinstaub (PM2,5) - 2 (gut)
- Kohlenmonoxid (CO) - 100 (gut)
- Stickstoffdioxid (NO2) - 8 (gut)
- Ozon (O3) - 0 (gut)
- Schwefeldioxid (SO2) - 9 (gut)

Wie ist die Luftqualität Zhaomingcun heute? Ist die Luft in Zhaomingcun? verschmutzt. Gibt es Smog?
Wie hoch ist der PM10-Stand heute in Zhaomingcun? (Feinstaub (PM10) Schwebestaub)
Der aktuelle Feinstaubgehalt PM10 in Zhaomingcun is:
7 (gut)
Die höchsten PM10-Werte treten in der Regel im Monat auf: 106 (Januar 2019).
Der niedrigste Wert der Feinstaub-PM10-Belastung in Zhaomingcun ist in der Regel in: August (48).
Wie hoch ist der aktuelle PM2,5-Wert in Zhaomingcun? (Feinstaub (PM2,5))
Die heutige PM2.5-Stufe ist:
2 (gut)
Zum Vergleich: Der höchste PM2,5-Wert in Zhaomingcun in den letzten 7 Tagen war: 24 (Freitag, 27. Mai 2022) und der niedrigste: 24 (Freitag, 27. Mai 2022).
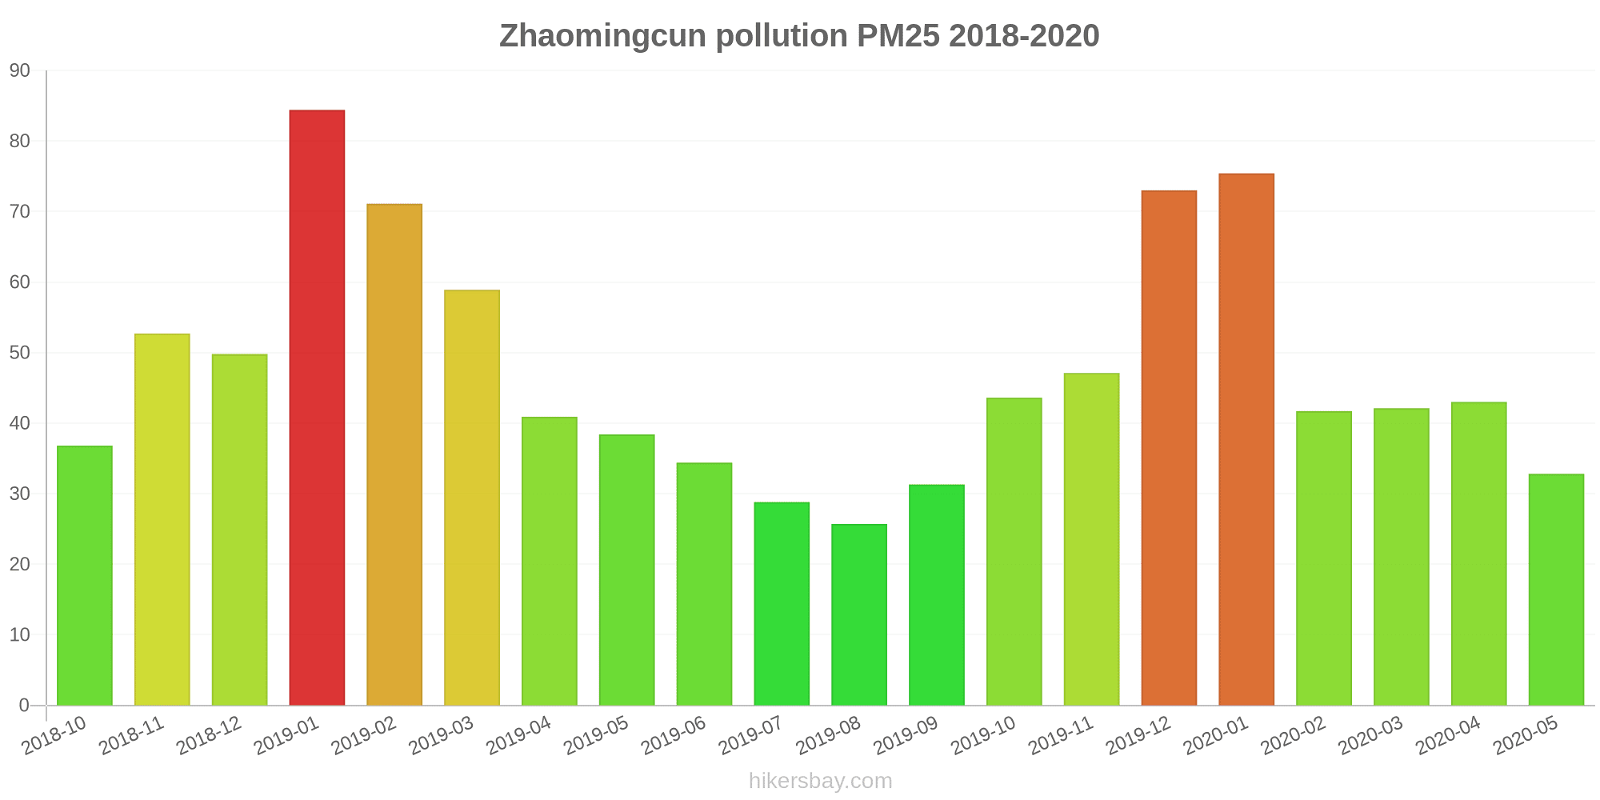
Die höchsten PM2,5-Werte wurden gemessen: 84 (Januar 2019).
Die niedrigste Feinstaubbelastung PM2,5 tritt im Monat auf: August (26).
Wie hoch ist der CO-Gehalt? (Kohlenmonoxid (CO))
100 (gut)
Wie hoch ist das NO2-Niveau? (Stickstoffdioxid (NO2))
8 (gut)
Wie ist das O3-Niveau heute in Zhaomingcun? (Ozon (O3))
0 (gut)
Wie hoch ist die SO2-Belastung? (Schwefeldioxid (SO2))
9 (gut)
Aktuelle Daten Freitag, 27. Mai 2022, 12:00
PM10 7 (gut)
PM2,5 2 (gut)
CO 100 (gut)
NO2 8 (gut)
O3 0 (gut)
SO2 9 (gut)
Daten zur Luftverschmutzung der letzten Tage in Zhaomingcun
index
2022-05-27
pm10
32
Moderate
pm25
24
Moderate
co
468
Good
no2
21
Good
o3
32
Good
so2
5
Good
data source »
Luftverschmutzung in Zhaomingcun von Oktober 2018 bis Mai 2020
index
2020-05
2020-04
2020-03
2020-02
2020-01
2019-12
2019-11
2019-10
2019-09
2019-08
2019-07
2019-06
2019-05
2019-04
2019-03
2019-02
2019-01
2018-12
2018-11
2018-10
pm25
33 (Moderate)
43 (Unhealthy for Sensitive Groups)
42 (Unhealthy for Sensitive Groups)
42 (Unhealthy for Sensitive Groups)
75 (Very Unhealthy)
73 (Unhealthy)
47 (Unhealthy for Sensitive Groups)
44 (Unhealthy for Sensitive Groups)
31 (Moderate)
26 (Moderate)
29 (Moderate)
34 (Moderate)
38 (Unhealthy for Sensitive Groups)
41 (Unhealthy for Sensitive Groups)
59 (Unhealthy)
71 (Unhealthy)
84 (Very Unhealthy)
50 (Unhealthy for Sensitive Groups)
53 (Unhealthy for Sensitive Groups)
37 (Unhealthy for Sensitive Groups)
co
749 (Good)
700 (Good)
716 (Good)
689 (Good)
923 (Good)
923 (Good)
840 (Good)
871 (Good)
792 (Good)
709 (Good)
724 (Good)
875 (Good)
769 (Good)
813 (Good)
867 (Good)
988 (Good)
1 (Good)
973 (Good)
1 (Good)
985 (Good)
no2
24 (Good)
40 (Good)
34 (Good)
23 (Good)
39 (Good)
53 (Moderate)
48 (Moderate)
43 (Moderate)
28 (Good)
24 (Good)
27 (Good)
27 (Good)
35 (Good)
36 (Good)
44 (Moderate)
34 (Good)
54 (Moderate)
46 (Moderate)
47 (Moderate)
43 (Moderate)
o3
144 (Unhealthy for Sensitive Groups)
123 (Unhealthy for Sensitive Groups)
100 (Moderate)
86 (Moderate)
62 (Good)
67 (Good)
94 (Moderate)
113 (Moderate)
163 (Unhealthy)
158 (Unhealthy)
150 (Unhealthy)
181 (Very Unhealthy)
157 (Unhealthy)
130 (Unhealthy for Sensitive Groups)
112 (Moderate)
82 (Moderate)
61 (Good)
52 (Good)
92 (Moderate)
113 (Moderate)
pm10
61 (Unhealthy for Sensitive Groups)
78 (Unhealthy for Sensitive Groups)
66 (Unhealthy for Sensitive Groups)
50 (Moderate)
77 (Unhealthy for Sensitive Groups)
83 (Unhealthy)
87 (Unhealthy)
90 (Unhealthy)
57 (Unhealthy for Sensitive Groups)
48 (Moderate)
50 (Unhealthy for Sensitive Groups)
56 (Unhealthy for Sensitive Groups)
75 (Unhealthy for Sensitive Groups)
71 (Unhealthy for Sensitive Groups)
94 (Unhealthy)
83 (Unhealthy)
106 (Unhealthy)
76 (Unhealthy for Sensitive Groups)
81 (Unhealthy)
72 (Unhealthy for Sensitive Groups)
so2
12 (Good)
15 (Good)
12 (Good)
8.4 (Good)
10 (Good)
14 (Good)
15 (Good)
14 (Good)
12 (Good)
12 (Good)
9.6 (Good)
12 (Good)
14 (Good)
13 (Good)
15 (Good)
9 (Good)
13 (Good)
12 (Good)
14 (Good)
16 (Good)
data source »
Ma'anshan Ci Hu Er Xiao
Freitag, 27. Mai 2022, 12:00
PM10 6.7 (gut)
Feinstaub (PM10) Schwebestaub
PM2,5 1.7 (gut)
Feinstaub (PM2,5)
CO 100 (gut)
Kohlenmonoxid (CO)
NO2 7.6 (gut)
Stickstoffdioxid (NO2)
O3 0.02 (gut)
Ozon (O3)
SO2 8.6 (gut)
Schwefeldioxid (SO2)
Ma'anshan Ci Hu Er Xiao
index
2022-05-27
pm10
32
pm25
24
co
468
no2
21
o3
32
so2
4.6
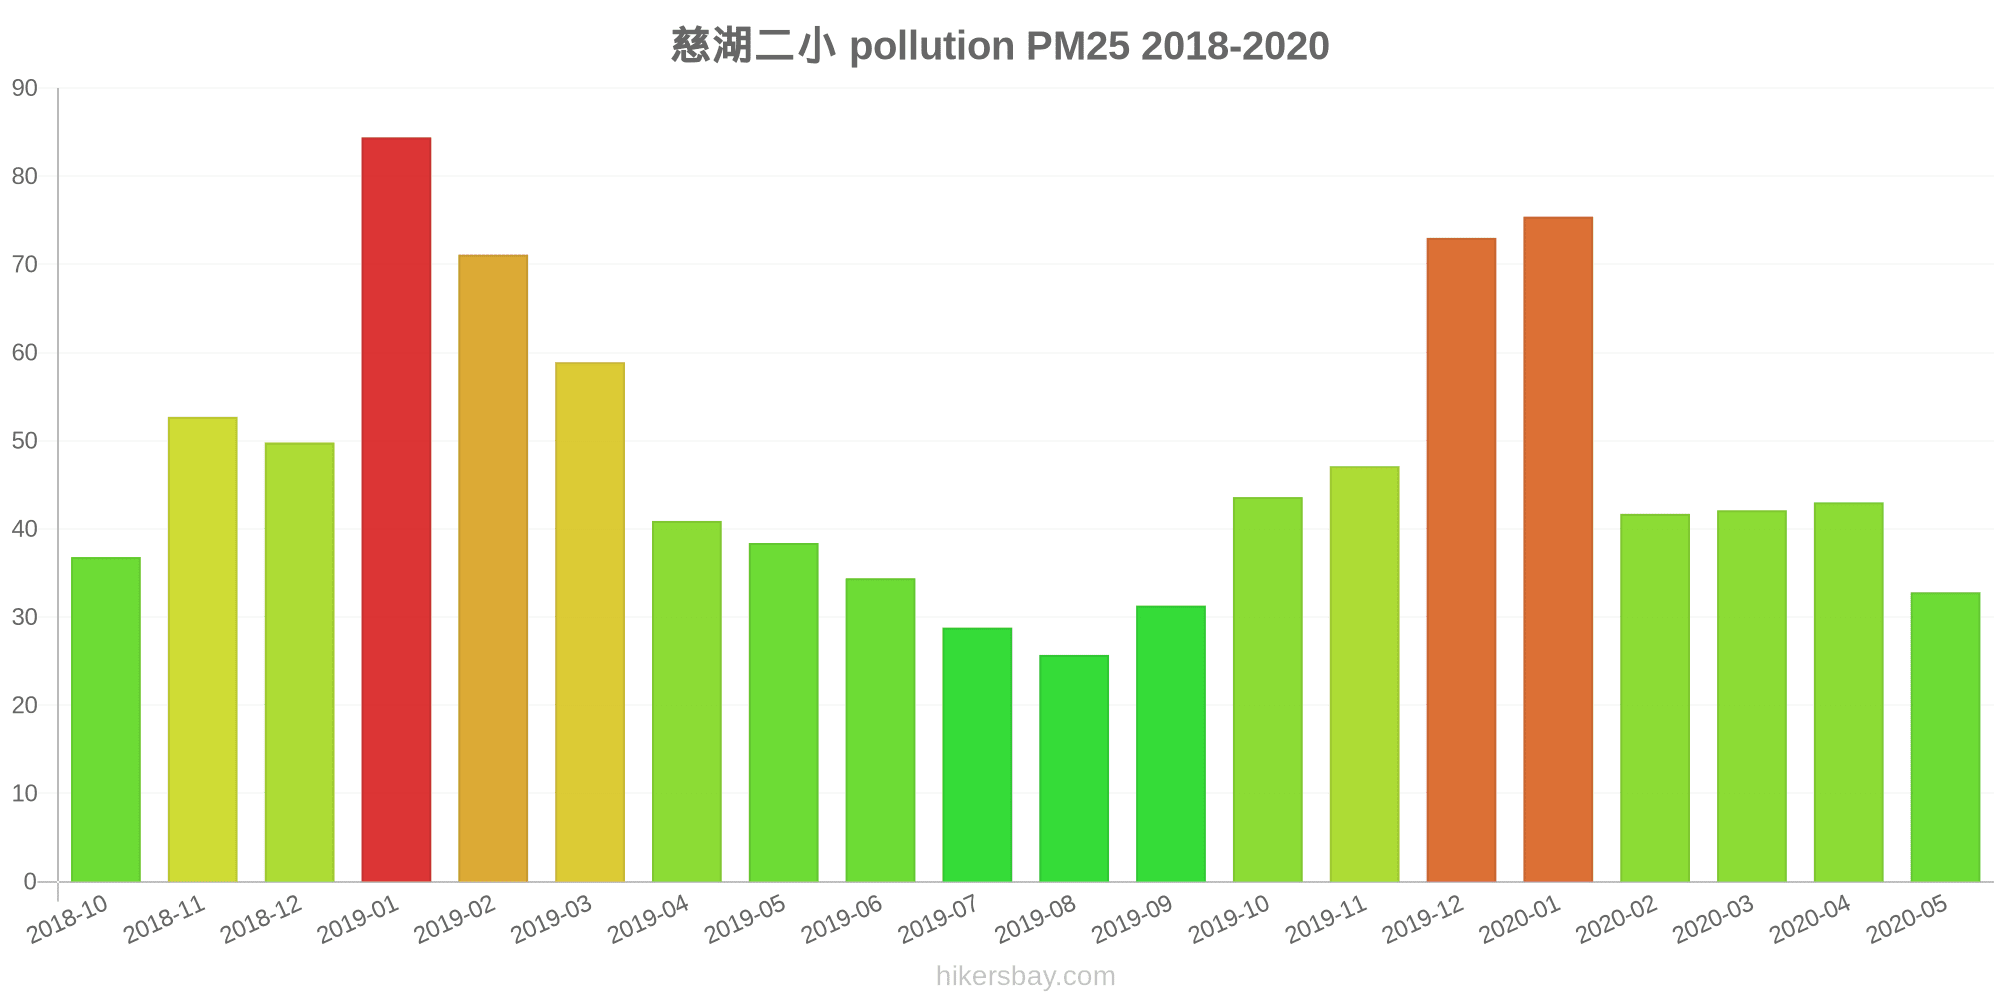
慈湖二小
2018-10 2020-05

index
2020-05
2020-04
2020-03
2020-02
2020-01
2019-12
2019-11
2019-10
2019-09
2019-08
2019-07
2019-06
2019-05
2019-04
2019-03
2019-02
2019-01
2018-12
2018-11
2018-10
pm25
33
43
42
42
75
73
47
44
31
26
29
34
38
41
59
71
84
50
53
37
co
749
700
716
689
923
923
840
871
792
709
724
875
769
813
867
988
1
973
1
985
no2
24
40
34
23
39
53
48
43
28
24
27
27
35
36
44
34
54
46
47
43
o3
144
123
100
86
62
67
94
113
163
158
150
181
157
130
112
82
61
52
92
113
pm10
61
78
66
50
77
83
87
90
57
48
50
56
75
71
94
83
106
76
81
72
so2
12
15
12
8.4
10
14
15
14
12
12
9.6
12
14
13
15
9
13
12
14
16
* Pollution data source:
https://openaq.org
(ChinaAQIData)
The data is licensed under CC-By 4.0
PM10 7 (gut)
PM2,5 2 (gut)
CO 100 (gut)
NO2 8 (gut)
O3 0 (gut)
SO2 9 (gut)
Daten zur Luftverschmutzung der letzten Tage in Zhaomingcun
| index | 2022-05-27 |
|---|---|
| pm10 | 32 Moderate |
| pm25 | 24 Moderate |
| co | 468 Good |
| no2 | 21 Good |
| o3 | 32 Good |
| so2 | 5 Good |

| index | 2020-05 | 2020-04 | 2020-03 | 2020-02 | 2020-01 | 2019-12 | 2019-11 | 2019-10 | 2019-09 | 2019-08 | 2019-07 | 2019-06 | 2019-05 | 2019-04 | 2019-03 | 2019-02 | 2019-01 | 2018-12 | 2018-11 | 2018-10 |
|---|---|---|---|---|---|---|---|---|---|---|---|---|---|---|---|---|---|---|---|---|
| pm25 | 33 (Moderate) | 43 (Unhealthy for Sensitive Groups) | 42 (Unhealthy for Sensitive Groups) | 42 (Unhealthy for Sensitive Groups) | 75 (Very Unhealthy) | 73 (Unhealthy) | 47 (Unhealthy for Sensitive Groups) | 44 (Unhealthy for Sensitive Groups) | 31 (Moderate) | 26 (Moderate) | 29 (Moderate) | 34 (Moderate) | 38 (Unhealthy for Sensitive Groups) | 41 (Unhealthy for Sensitive Groups) | 59 (Unhealthy) | 71 (Unhealthy) | 84 (Very Unhealthy) | 50 (Unhealthy for Sensitive Groups) | 53 (Unhealthy for Sensitive Groups) | 37 (Unhealthy for Sensitive Groups) |
| co | 749 (Good) | 700 (Good) | 716 (Good) | 689 (Good) | 923 (Good) | 923 (Good) | 840 (Good) | 871 (Good) | 792 (Good) | 709 (Good) | 724 (Good) | 875 (Good) | 769 (Good) | 813 (Good) | 867 (Good) | 988 (Good) | 1 (Good) | 973 (Good) | 1 (Good) | 985 (Good) |
| no2 | 24 (Good) | 40 (Good) | 34 (Good) | 23 (Good) | 39 (Good) | 53 (Moderate) | 48 (Moderate) | 43 (Moderate) | 28 (Good) | 24 (Good) | 27 (Good) | 27 (Good) | 35 (Good) | 36 (Good) | 44 (Moderate) | 34 (Good) | 54 (Moderate) | 46 (Moderate) | 47 (Moderate) | 43 (Moderate) |
| o3 | 144 (Unhealthy for Sensitive Groups) | 123 (Unhealthy for Sensitive Groups) | 100 (Moderate) | 86 (Moderate) | 62 (Good) | 67 (Good) | 94 (Moderate) | 113 (Moderate) | 163 (Unhealthy) | 158 (Unhealthy) | 150 (Unhealthy) | 181 (Very Unhealthy) | 157 (Unhealthy) | 130 (Unhealthy for Sensitive Groups) | 112 (Moderate) | 82 (Moderate) | 61 (Good) | 52 (Good) | 92 (Moderate) | 113 (Moderate) |
| pm10 | 61 (Unhealthy for Sensitive Groups) | 78 (Unhealthy for Sensitive Groups) | 66 (Unhealthy for Sensitive Groups) | 50 (Moderate) | 77 (Unhealthy for Sensitive Groups) | 83 (Unhealthy) | 87 (Unhealthy) | 90 (Unhealthy) | 57 (Unhealthy for Sensitive Groups) | 48 (Moderate) | 50 (Unhealthy for Sensitive Groups) | 56 (Unhealthy for Sensitive Groups) | 75 (Unhealthy for Sensitive Groups) | 71 (Unhealthy for Sensitive Groups) | 94 (Unhealthy) | 83 (Unhealthy) | 106 (Unhealthy) | 76 (Unhealthy for Sensitive Groups) | 81 (Unhealthy) | 72 (Unhealthy for Sensitive Groups) |
| so2 | 12 (Good) | 15 (Good) | 12 (Good) | 8.4 (Good) | 10 (Good) | 14 (Good) | 15 (Good) | 14 (Good) | 12 (Good) | 12 (Good) | 9.6 (Good) | 12 (Good) | 14 (Good) | 13 (Good) | 15 (Good) | 9 (Good) | 13 (Good) | 12 (Good) | 14 (Good) | 16 (Good) |
PM10 6.7 (gut)
Feinstaub (PM10) SchwebestaubPM2,5 1.7 (gut)
Feinstaub (PM2,5)CO 100 (gut)
Kohlenmonoxid (CO)NO2 7.6 (gut)
Stickstoffdioxid (NO2)O3 0.02 (gut)
Ozon (O3)SO2 8.6 (gut)
Schwefeldioxid (SO2)Ma'anshan Ci Hu Er Xiao
| index | 2022-05-27 |
|---|---|
| pm10 | 32 |
| pm25 | 24 |
| co | 468 |
| no2 | 21 |
| o3 | 32 |
| so2 | 4.6 |
慈湖二小
| index | 2020-05 | 2020-04 | 2020-03 | 2020-02 | 2020-01 | 2019-12 | 2019-11 | 2019-10 | 2019-09 | 2019-08 | 2019-07 | 2019-06 | 2019-05 | 2019-04 | 2019-03 | 2019-02 | 2019-01 | 2018-12 | 2018-11 | 2018-10 |
|---|---|---|---|---|---|---|---|---|---|---|---|---|---|---|---|---|---|---|---|---|
| pm25 | 33 | 43 | 42 | 42 | 75 | 73 | 47 | 44 | 31 | 26 | 29 | 34 | 38 | 41 | 59 | 71 | 84 | 50 | 53 | 37 |
| co | 749 | 700 | 716 | 689 | 923 | 923 | 840 | 871 | 792 | 709 | 724 | 875 | 769 | 813 | 867 | 988 | 1 | 973 | 1 | 985 |
| no2 | 24 | 40 | 34 | 23 | 39 | 53 | 48 | 43 | 28 | 24 | 27 | 27 | 35 | 36 | 44 | 34 | 54 | 46 | 47 | 43 |
| o3 | 144 | 123 | 100 | 86 | 62 | 67 | 94 | 113 | 163 | 158 | 150 | 181 | 157 | 130 | 112 | 82 | 61 | 52 | 92 | 113 |
| pm10 | 61 | 78 | 66 | 50 | 77 | 83 | 87 | 90 | 57 | 48 | 50 | 56 | 75 | 71 | 94 | 83 | 106 | 76 | 81 | 72 |
| so2 | 12 | 15 | 12 | 8.4 | 10 | 14 | 15 | 14 | 12 | 12 | 9.6 | 12 | 14 | 13 | 15 | 9 | 13 | 12 | 14 | 16 |