Luftverschmutzung in Jiangliang: Echtzeit-Luft-Qualitätsindex und Smog-Alarm.
Für die Jiangliang. Heute ist Donnerstag, 4. Juni 2026. Für Jiangliang wurden folgende Luftverschmutzungswerte gemessen:- Feinstaub (PM2,5) - 61 (ungesund)
- Stickstoffdioxid (NO2) - 22 (gut)
- Feinstaub (PM10) Schwebestaub - 69 (Ungesund für sensible Gruppen)
- Kohlenmonoxid (CO) - 219 (gut)
- Ozon (O3) - 0 (gut)
- Schwefeldioxid (SO2) - 8 (gut)

Wie ist die Luftqualität Jiangliang heute? Ist die Luft in Jiangliang? verschmutzt. Gibt es Smog?
Wie hoch ist der aktuelle PM2,5-Wert in Jiangliang? (Feinstaub (PM2,5))
Die heutige PM2.5-Stufe ist:
61 (ungesund)
Zum Vergleich: Der höchste PM2,5-Wert in Jiangliang in den letzten 7 Tagen war: 28 (Freitag, 27. Mai 2022) und der niedrigste: 28 (Freitag, 27. Mai 2022).
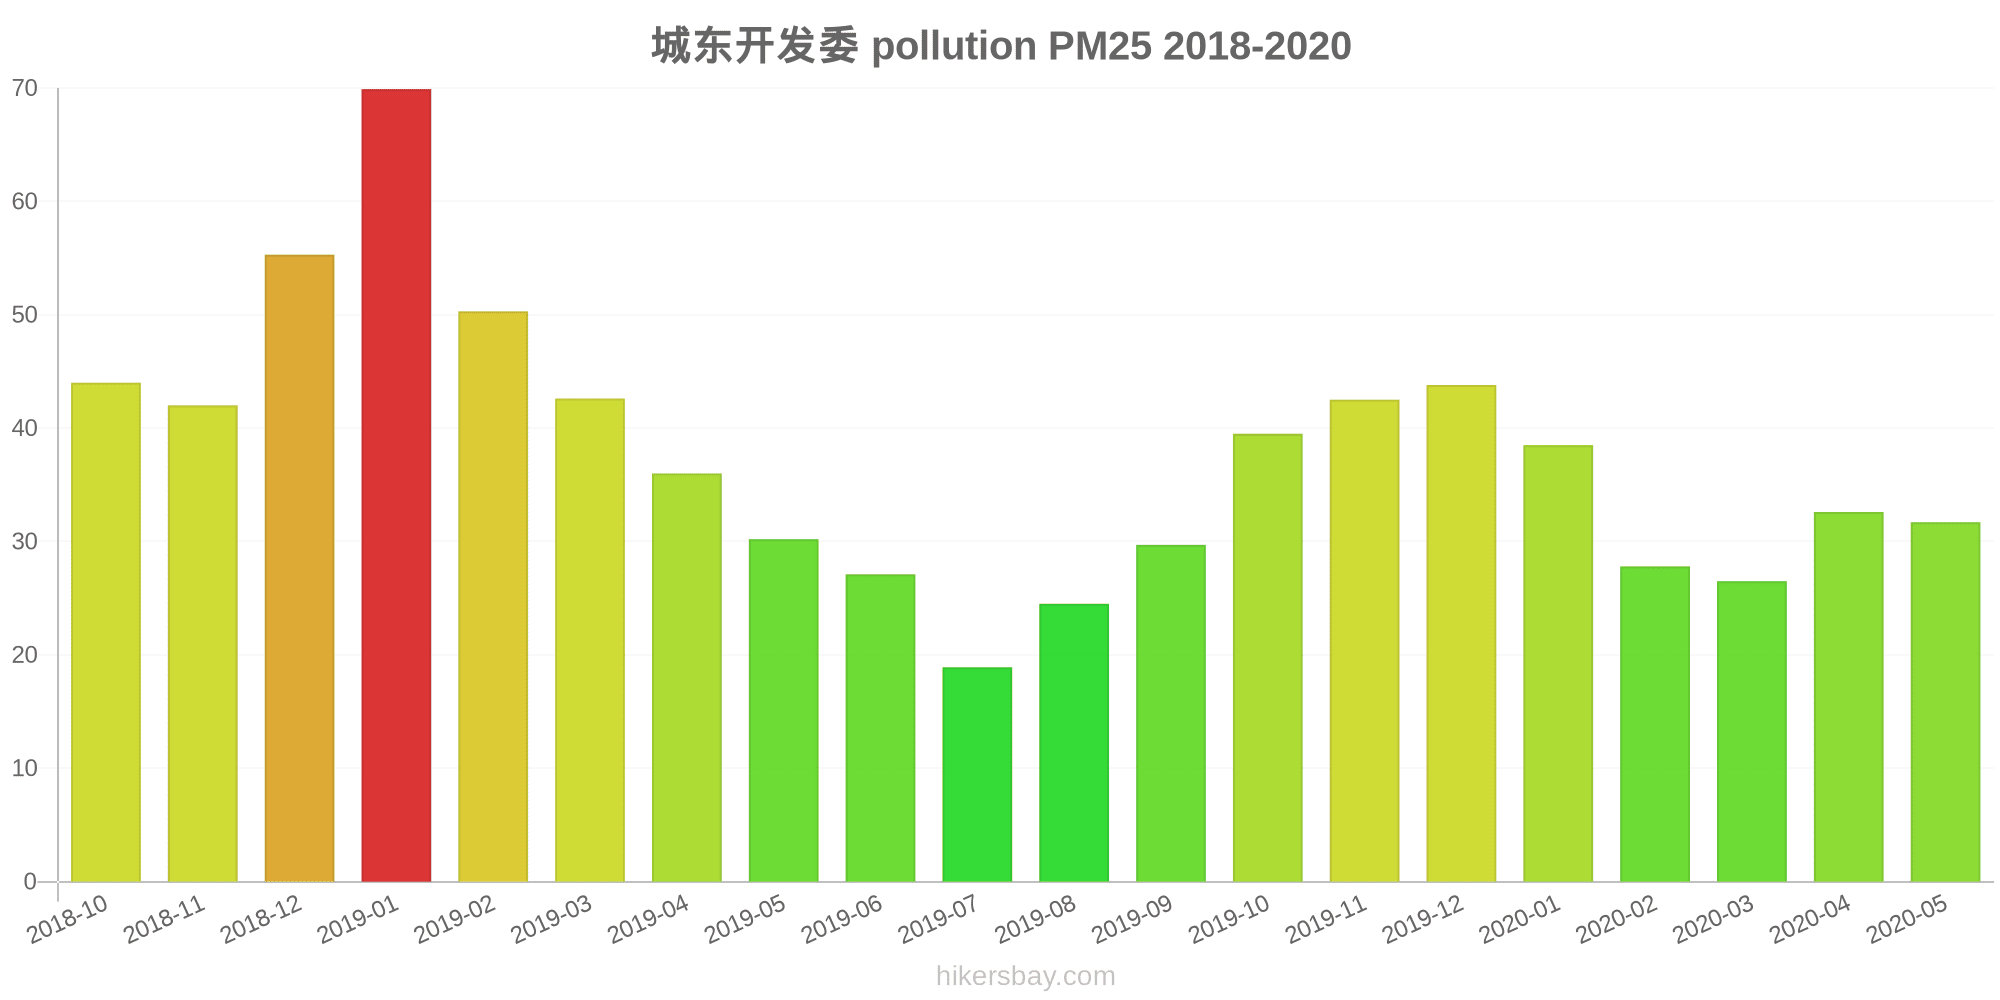
Die höchsten PM2,5-Werte wurden gemessen: 70 (Januar 2019).
Die niedrigste Feinstaubbelastung PM2,5 tritt im Monat auf: Juli (19).
Wie hoch ist das NO2-Niveau? (Stickstoffdioxid (NO2))
22 (gut)
Wie hoch ist der PM10-Stand heute in Jiangliang? (Feinstaub (PM10) Schwebestaub)
Der aktuelle Feinstaubgehalt PM10 in Jiangliang is:
69 (Ungesund für sensible Gruppen)
Die höchsten PM10-Werte treten in der Regel im Monat auf: 93 (Januar 2019).
Der niedrigste Wert der Feinstaub-PM10-Belastung in Jiangliang ist in der Regel in: Juli (30).
Wie hoch ist der CO-Gehalt? (Kohlenmonoxid (CO))
219 (gut)
Wie ist das O3-Niveau heute in Jiangliang? (Ozon (O3))
0 (gut)
Wie hoch ist die SO2-Belastung? (Schwefeldioxid (SO2))
8 (gut)
Aktuelle Daten Freitag, 27. Mai 2022, 15:00
PM2,5 61 (ungesund)
NO2 22 (gut)
PM10 69 (Ungesund für sensible Gruppen)
CO 219 (gut)
O3 0 (gut)
SO2 8 (gut)
Daten zur Luftverschmutzung der letzten Tage in Jiangliang
index
2022-05-27
pm25
28
Moderate
no2
22
Good
pm10
35
Moderate
co
579
Good
o3
22
Good
so2
5
Good
data source »
Luftverschmutzung in Jiangliang von Oktober 2018 bis Mai 2020

index
2020-05
2020-04
2020-03
2020-02
2020-01
2019-12
2019-11
2019-10
2019-09
2019-08
2019-07
2019-06
2019-05
2019-04
2019-03
2019-02
2019-01
2018-12
2018-11
2018-10
pm25
32 (Moderate)
33 (Moderate)
27 (Moderate)
28 (Moderate)
39 (Unhealthy for Sensitive Groups)
44 (Unhealthy for Sensitive Groups)
43 (Unhealthy for Sensitive Groups)
40 (Unhealthy for Sensitive Groups)
30 (Moderate)
25 (Moderate)
19 (Moderate)
27 (Moderate)
30 (Moderate)
36 (Unhealthy for Sensitive Groups)
43 (Unhealthy for Sensitive Groups)
50 (Unhealthy for Sensitive Groups)
70 (Unhealthy)
55 (Unhealthy)
42 (Unhealthy for Sensitive Groups)
44 (Unhealthy for Sensitive Groups)
co
553 (Good)
568 (Good)
565 (Good)
623 (Good)
863 (Good)
899 (Good)
693 (Good)
767 (Good)
682 (Good)
590 (Good)
570 (Good)
709 (Good)
622 (Good)
782 (Good)
731 (Good)
847 (Good)
994 (Good)
956 (Good)
794 (Good)
811 (Good)
no2
20 (Good)
29 (Good)
25 (Good)
15 (Good)
33 (Good)
49 (Moderate)
42 (Moderate)
33 (Good)
20 (Good)
12 (Good)
12 (Good)
19 (Good)
22 (Good)
27 (Good)
33 (Good)
30 (Good)
48 (Moderate)
51 (Moderate)
41 (Moderate)
35 (Good)
o3
138 (Unhealthy for Sensitive Groups)
148 (Unhealthy for Sensitive Groups)
99 (Moderate)
95 (Moderate)
68 (Good)
58 (Good)
99 (Moderate)
123 (Unhealthy for Sensitive Groups)
158 (Unhealthy)
144 (Unhealthy for Sensitive Groups)
121 (Unhealthy for Sensitive Groups)
119 (Moderate)
170 (Unhealthy)
137 (Unhealthy for Sensitive Groups)
117 (Moderate)
71 (Moderate)
61 (Good)
46 (Good)
77 (Moderate)
123 (Unhealthy for Sensitive Groups)
pm10
48 (Moderate)
58 (Unhealthy for Sensitive Groups)
41 (Moderate)
40 (Moderate)
50 (Moderate)
65 (Unhealthy for Sensitive Groups)
75 (Unhealthy for Sensitive Groups)
69 (Unhealthy for Sensitive Groups)
48 (Moderate)
37 (Moderate)
30 (Moderate)
38 (Moderate)
53 (Unhealthy for Sensitive Groups)
60 (Unhealthy for Sensitive Groups)
68 (Unhealthy for Sensitive Groups)
62 (Unhealthy for Sensitive Groups)
93 (Unhealthy)
86 (Unhealthy)
64 (Unhealthy for Sensitive Groups)
72 (Unhealthy for Sensitive Groups)
so2
5.6 (Good)
7.6 (Good)
5.8 (Good)
5.1 (Good)
3.8 (Good)
7.3 (Good)
6.8 (Good)
6.4 (Good)
4.5 (Good)
3.2 (Good)
3.8 (Good)
3.9 (Good)
6.4 (Good)
6 (Good)
6.7 (Good)
6.2 (Good)
11 (Good)
12 (Good)
9.4 (Good)
9.8 (Good)
data source »
城东开发委
Freitag, 27. Mai 2022, 15:00
PM2,5 61 (ungesund)
Feinstaub (PM2,5)
NO2 22 (gut)
Stickstoffdioxid (NO2)
PM10 69 (Ungesund für sensible Gruppen)
Feinstaub (PM10) Schwebestaub
CO 219 (gut)
Kohlenmonoxid (CO)
O3 0.05 (gut)
Ozon (O3)
SO2 7.7 (gut)
Schwefeldioxid (SO2)
城东开发委
index
2022-05-27
pm25
28
no2
22
pm10
35
co
579
o3
22
so2
4.6
城东开发委
2018-10 2020-05

index
2020-05
2020-04
2020-03
2020-02
2020-01
2019-12
2019-11
2019-10
2019-09
2019-08
2019-07
2019-06
2019-05
2019-04
2019-03
2019-02
2019-01
2018-12
2018-11
2018-10
pm25
32
33
27
28
39
44
43
40
30
25
19
27
30
36
43
50
70
55
42
44
co
553
568
565
623
863
899
693
767
682
590
570
709
622
782
731
847
994
956
794
811
no2
20
29
25
15
33
49
42
33
20
12
12
19
22
27
33
30
48
51
41
35
o3
138
148
99
95
68
58
99
123
158
144
121
119
170
137
117
71
61
46
77
123
pm10
48
58
41
40
50
65
75
69
48
37
30
38
53
60
68
62
93
86
64
72
so2
5.6
7.6
5.8
5.1
3.8
7.3
6.8
6.4
4.5
3.2
3.8
3.9
6.4
6
6.7
6.2
11
12
9.4
9.8
* Pollution data source:
https://openaq.org
(ChinaAQIData)
The data is licensed under CC-By 4.0
PM2,5 61 (ungesund)
NO2 22 (gut)
PM10 69 (Ungesund für sensible Gruppen)
CO 219 (gut)
O3 0 (gut)
SO2 8 (gut)
Daten zur Luftverschmutzung der letzten Tage in Jiangliang
| index | 2022-05-27 |
|---|---|
| pm25 | 28 Moderate |
| no2 | 22 Good |
| pm10 | 35 Moderate |
| co | 579 Good |
| o3 | 22 Good |
| so2 | 5 Good |

| index | 2020-05 | 2020-04 | 2020-03 | 2020-02 | 2020-01 | 2019-12 | 2019-11 | 2019-10 | 2019-09 | 2019-08 | 2019-07 | 2019-06 | 2019-05 | 2019-04 | 2019-03 | 2019-02 | 2019-01 | 2018-12 | 2018-11 | 2018-10 |
|---|---|---|---|---|---|---|---|---|---|---|---|---|---|---|---|---|---|---|---|---|
| pm25 | 32 (Moderate) | 33 (Moderate) | 27 (Moderate) | 28 (Moderate) | 39 (Unhealthy for Sensitive Groups) | 44 (Unhealthy for Sensitive Groups) | 43 (Unhealthy for Sensitive Groups) | 40 (Unhealthy for Sensitive Groups) | 30 (Moderate) | 25 (Moderate) | 19 (Moderate) | 27 (Moderate) | 30 (Moderate) | 36 (Unhealthy for Sensitive Groups) | 43 (Unhealthy for Sensitive Groups) | 50 (Unhealthy for Sensitive Groups) | 70 (Unhealthy) | 55 (Unhealthy) | 42 (Unhealthy for Sensitive Groups) | 44 (Unhealthy for Sensitive Groups) |
| co | 553 (Good) | 568 (Good) | 565 (Good) | 623 (Good) | 863 (Good) | 899 (Good) | 693 (Good) | 767 (Good) | 682 (Good) | 590 (Good) | 570 (Good) | 709 (Good) | 622 (Good) | 782 (Good) | 731 (Good) | 847 (Good) | 994 (Good) | 956 (Good) | 794 (Good) | 811 (Good) |
| no2 | 20 (Good) | 29 (Good) | 25 (Good) | 15 (Good) | 33 (Good) | 49 (Moderate) | 42 (Moderate) | 33 (Good) | 20 (Good) | 12 (Good) | 12 (Good) | 19 (Good) | 22 (Good) | 27 (Good) | 33 (Good) | 30 (Good) | 48 (Moderate) | 51 (Moderate) | 41 (Moderate) | 35 (Good) |
| o3 | 138 (Unhealthy for Sensitive Groups) | 148 (Unhealthy for Sensitive Groups) | 99 (Moderate) | 95 (Moderate) | 68 (Good) | 58 (Good) | 99 (Moderate) | 123 (Unhealthy for Sensitive Groups) | 158 (Unhealthy) | 144 (Unhealthy for Sensitive Groups) | 121 (Unhealthy for Sensitive Groups) | 119 (Moderate) | 170 (Unhealthy) | 137 (Unhealthy for Sensitive Groups) | 117 (Moderate) | 71 (Moderate) | 61 (Good) | 46 (Good) | 77 (Moderate) | 123 (Unhealthy for Sensitive Groups) |
| pm10 | 48 (Moderate) | 58 (Unhealthy for Sensitive Groups) | 41 (Moderate) | 40 (Moderate) | 50 (Moderate) | 65 (Unhealthy for Sensitive Groups) | 75 (Unhealthy for Sensitive Groups) | 69 (Unhealthy for Sensitive Groups) | 48 (Moderate) | 37 (Moderate) | 30 (Moderate) | 38 (Moderate) | 53 (Unhealthy for Sensitive Groups) | 60 (Unhealthy for Sensitive Groups) | 68 (Unhealthy for Sensitive Groups) | 62 (Unhealthy for Sensitive Groups) | 93 (Unhealthy) | 86 (Unhealthy) | 64 (Unhealthy for Sensitive Groups) | 72 (Unhealthy for Sensitive Groups) |
| so2 | 5.6 (Good) | 7.6 (Good) | 5.8 (Good) | 5.1 (Good) | 3.8 (Good) | 7.3 (Good) | 6.8 (Good) | 6.4 (Good) | 4.5 (Good) | 3.2 (Good) | 3.8 (Good) | 3.9 (Good) | 6.4 (Good) | 6 (Good) | 6.7 (Good) | 6.2 (Good) | 11 (Good) | 12 (Good) | 9.4 (Good) | 9.8 (Good) |
PM2,5 61 (ungesund)
Feinstaub (PM2,5)NO2 22 (gut)
Stickstoffdioxid (NO2)PM10 69 (Ungesund für sensible Gruppen)
Feinstaub (PM10) SchwebestaubCO 219 (gut)
Kohlenmonoxid (CO)O3 0.05 (gut)
Ozon (O3)SO2 7.7 (gut)
Schwefeldioxid (SO2)城东开发委
| index | 2022-05-27 |
|---|---|
| pm25 | 28 |
| no2 | 22 |
| pm10 | 35 |
| co | 579 |
| o3 | 22 |
| so2 | 4.6 |
城东开发委
| index | 2020-05 | 2020-04 | 2020-03 | 2020-02 | 2020-01 | 2019-12 | 2019-11 | 2019-10 | 2019-09 | 2019-08 | 2019-07 | 2019-06 | 2019-05 | 2019-04 | 2019-03 | 2019-02 | 2019-01 | 2018-12 | 2018-11 | 2018-10 |
|---|---|---|---|---|---|---|---|---|---|---|---|---|---|---|---|---|---|---|---|---|
| pm25 | 32 | 33 | 27 | 28 | 39 | 44 | 43 | 40 | 30 | 25 | 19 | 27 | 30 | 36 | 43 | 50 | 70 | 55 | 42 | 44 |
| co | 553 | 568 | 565 | 623 | 863 | 899 | 693 | 767 | 682 | 590 | 570 | 709 | 622 | 782 | 731 | 847 | 994 | 956 | 794 | 811 |
| no2 | 20 | 29 | 25 | 15 | 33 | 49 | 42 | 33 | 20 | 12 | 12 | 19 | 22 | 27 | 33 | 30 | 48 | 51 | 41 | 35 |
| o3 | 138 | 148 | 99 | 95 | 68 | 58 | 99 | 123 | 158 | 144 | 121 | 119 | 170 | 137 | 117 | 71 | 61 | 46 | 77 | 123 |
| pm10 | 48 | 58 | 41 | 40 | 50 | 65 | 75 | 69 | 48 | 37 | 30 | 38 | 53 | 60 | 68 | 62 | 93 | 86 | 64 | 72 |
| so2 | 5.6 | 7.6 | 5.8 | 5.1 | 3.8 | 7.3 | 6.8 | 6.4 | 4.5 | 3.2 | 3.8 | 3.9 | 6.4 | 6 | 6.7 | 6.2 | 11 | 12 | 9.4 | 9.8 |