Luftverschmutzung in Bayan Nur: Echtzeit-Luft-Qualitätsindex und Smog-Alarm.
Für die Bayan Nur. Heute ist Donnerstag, 4. Juni 2026. Für Bayan Nur wurden folgende Luftverschmutzungswerte gemessen:- Feinstaub (PM10) Schwebestaub - 7 (gut)
- Feinstaub (PM2,5) - 2 (gut)
- Kohlenmonoxid (CO) - 100 (gut)
- Stickstoffdioxid (NO2) - 8 (gut)
- Ozon (O3) - 0 (gut)
- Schwefeldioxid (SO2) - 9 (gut)

Wie ist die Luftqualität Bayan Nur heute? Ist die Luft in Bayan Nur? verschmutzt. Gibt es Smog?
Wie hoch ist der PM10-Stand heute in Bayan Nur? (Feinstaub (PM10) Schwebestaub)
Der aktuelle Feinstaubgehalt PM10 in Bayan Nur is:
7 (gut)
Die höchsten PM10-Werte treten in der Regel im Monat auf: 171 (Januar 2020).
Der niedrigste Wert der Feinstaub-PM10-Belastung in Bayan Nur ist in der Regel in: August (33).
Wie hoch ist der aktuelle PM2,5-Wert in Bayan Nur? (Feinstaub (PM2,5))
Die heutige PM2.5-Stufe ist:
2 (gut)
Zum Vergleich: Der höchste PM2,5-Wert in Bayan Nur in den letzten 7 Tagen war: 24 (Freitag, 27. Mai 2022) und der niedrigste: 24 (Freitag, 27. Mai 2022).
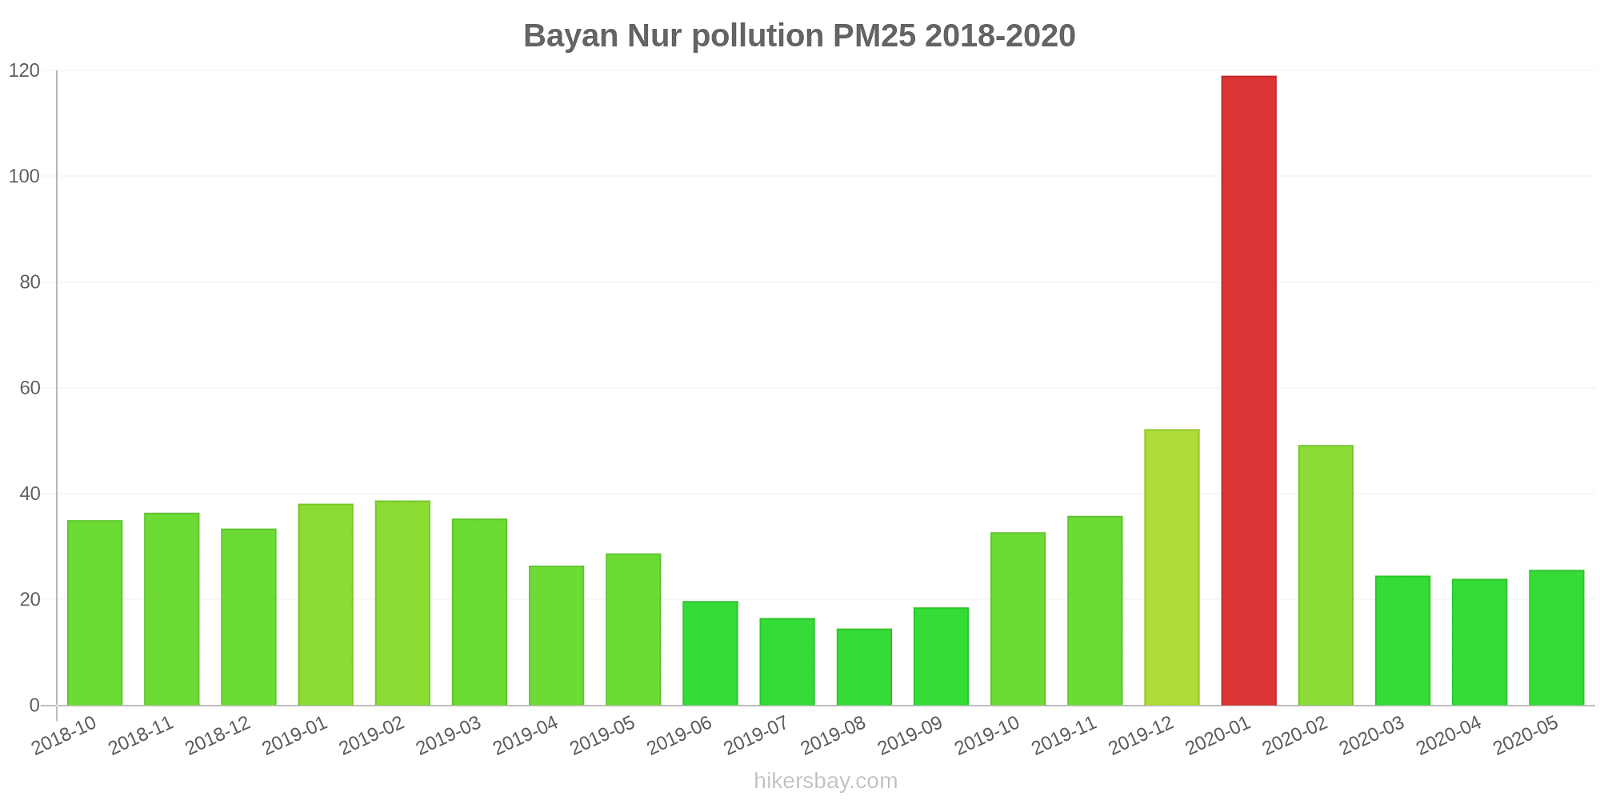
Die höchsten PM2,5-Werte wurden gemessen: 119 (Januar 2020).
Die niedrigste Feinstaubbelastung PM2,5 tritt im Monat auf: August (15).
Wie hoch ist der CO-Gehalt? (Kohlenmonoxid (CO))
100 (gut)
Wie hoch ist das NO2-Niveau? (Stickstoffdioxid (NO2))
8 (gut)
Wie ist das O3-Niveau heute in Bayan Nur? (Ozon (O3))
0 (gut)
Wie hoch ist die SO2-Belastung? (Schwefeldioxid (SO2))
9 (gut)
Aktuelle Daten Freitag, 27. Mai 2022, 12:00
PM10 7 (gut)
PM2,5 2 (gut)
CO 100 (gut)
NO2 8 (gut)
O3 0 (gut)
SO2 9 (gut)
Daten zur Luftverschmutzung der letzten Tage in Bayan Nur
index
2022-05-27
pm10
32
Moderate
pm25
24
Moderate
co
468
Good
no2
21
Good
o3
32
Good
so2
5
Good
data source »
Luftverschmutzung in Bayan Nur von Oktober 2018 bis Mai 2020
index
2020-05
2020-04
2020-03
2020-02
2020-01
2019-12
2019-11
2019-10
2019-09
2019-08
2019-07
2019-06
2019-05
2019-04
2019-03
2019-02
2019-01
2018-12
2018-11
2018-10
pm25
26 (Moderate)
24 (Moderate)
25 (Moderate)
49 (Unhealthy for Sensitive Groups)
119 (Very bad Hazardous)
52 (Unhealthy for Sensitive Groups)
36 (Unhealthy for Sensitive Groups)
33 (Moderate)
19 (Moderate)
15 (Moderate)
17 (Moderate)
20 (Moderate)
29 (Moderate)
26 (Moderate)
35 (Unhealthy for Sensitive Groups)
39 (Unhealthy for Sensitive Groups)
38 (Unhealthy for Sensitive Groups)
33 (Moderate)
36 (Unhealthy for Sensitive Groups)
35 (Unhealthy for Sensitive Groups)
co
614 (Good)
585 (Good)
593 (Good)
786 (Good)
1 (Good)
1 (Good)
814 (Good)
594 (Good)
590 (Good)
587 (Good)
590 (Good)
701 (Good)
656 (Good)
595 (Good)
675 (Good)
755 (Good)
743 (Good)
628 (Good)
552 (Good)
467 (Good)
no2
14 (Good)
21 (Good)
15 (Good)
19 (Good)
43 (Moderate)
29 (Good)
25 (Good)
20 (Good)
18 (Good)
16 (Good)
18 (Good)
14 (Good)
14 (Good)
24 (Good)
23 (Good)
26 (Good)
31 (Good)
23 (Good)
24 (Good)
22 (Good)
o3
115 (Moderate)
118 (Moderate)
97 (Moderate)
92 (Moderate)
70 (Moderate)
76 (Moderate)
81 (Moderate)
100 (Moderate)
137 (Unhealthy for Sensitive Groups)
131 (Unhealthy for Sensitive Groups)
149 (Unhealthy for Sensitive Groups)
141 (Unhealthy for Sensitive Groups)
134 (Unhealthy for Sensitive Groups)
122 (Unhealthy for Sensitive Groups)
100 (Moderate)
82 (Moderate)
64 (Good)
65 (Good)
78 (Moderate)
87 (Moderate)
pm10
86 (Unhealthy)
68 (Unhealthy for Sensitive Groups)
78 (Unhealthy for Sensitive Groups)
107 (Unhealthy)
171 (Very bad Hazardous)
97 (Unhealthy)
97 (Unhealthy)
77 (Unhealthy for Sensitive Groups)
37 (Moderate)
33 (Moderate)
45 (Moderate)
59 (Unhealthy for Sensitive Groups)
93 (Unhealthy)
94 (Unhealthy)
82 (Unhealthy)
88 (Unhealthy)
71 (Unhealthy for Sensitive Groups)
79 (Unhealthy for Sensitive Groups)
104 (Unhealthy)
74 (Unhealthy for Sensitive Groups)
so2
11 (Good)
11 (Good)
12 (Good)
16 (Good)
28 (Good)
17 (Good)
13 (Good)
7.7 (Good)
6.8 (Good)
7.5 (Good)
9.3 (Good)
8.9 (Good)
8.4 (Good)
13 (Good)
14 (Good)
21 (Good)
24 (Good)
19 (Good)
13 (Good)
8 (Good)
data source »
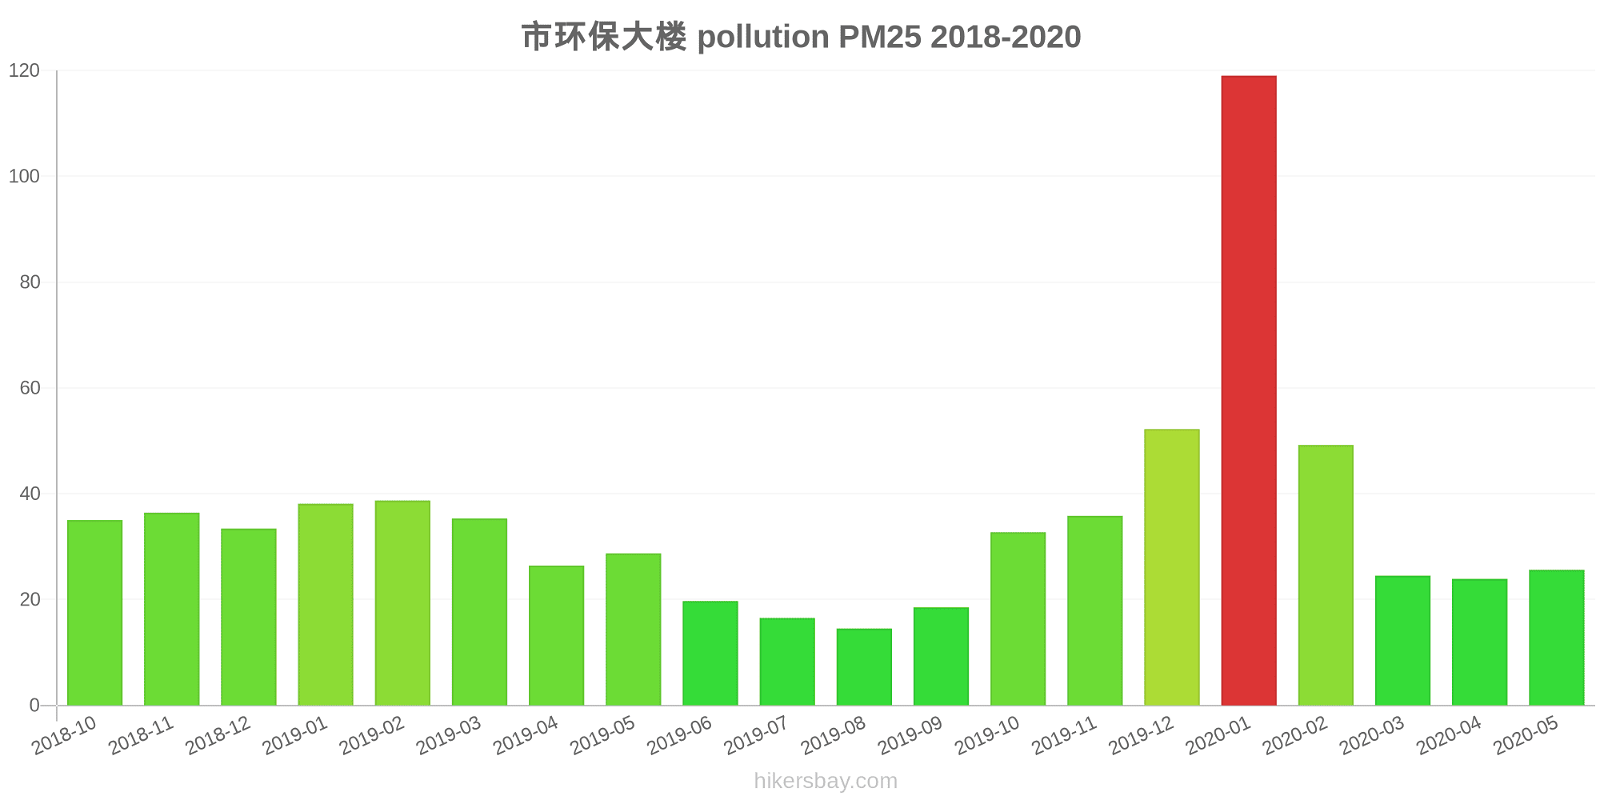
市环保大楼
Freitag, 27. Mai 2022, 12:00
PM10 6.7 (gut)
Feinstaub (PM10) Schwebestaub
PM2,5 1.7 (gut)
Feinstaub (PM2,5)
CO 100 (gut)
Kohlenmonoxid (CO)
NO2 7.6 (gut)
Stickstoffdioxid (NO2)
O3 0.02 (gut)
Ozon (O3)
SO2 8.6 (gut)
Schwefeldioxid (SO2)
市环保大楼
index
2022-05-27
pm10
32
pm25
24
co
468
no2
21
o3
32
so2
4.6
市环保大楼
2018-10 2020-05
index
2020-05
2020-04
2020-03
2020-02
2020-01
2019-12
2019-11
2019-10
2019-09
2019-08
2019-07
2019-06
2019-05
2019-04
2019-03
2019-02
2019-01
2018-12
2018-11
2018-10
pm25
26
24
25
49
119
52
36
33
19
15
17
20
29
26
35
39
38
33
36
35
co
614
585
593
786
1
1
814
594
590
587
590
701
656
595
675
755
743
628
552
467
no2
14
21
15
19
43
29
25
20
18
16
18
14
14
24
23
26
31
23
24
22
o3
115
118
97
92
70
76
81
100
137
131
149
141
134
122
100
82
64
65
78
87
pm10
86
68
78
107
171
97
97
77
37
33
45
59
93
94
82
88
71
79
104
74
so2
11
11
12
16
28
17
13
7.7
6.8
7.5
9.3
8.9
8.4
13
14
21
24
19
13
8
* Pollution data source:
https://openaq.org
(ChinaAQIData)
The data is licensed under CC-By 4.0
PM10 7 (gut)
PM2,5 2 (gut)
CO 100 (gut)
NO2 8 (gut)
O3 0 (gut)
SO2 9 (gut)
Daten zur Luftverschmutzung der letzten Tage in Bayan Nur
| index | 2022-05-27 |
|---|---|
| pm10 | 32 Moderate |
| pm25 | 24 Moderate |
| co | 468 Good |
| no2 | 21 Good |
| o3 | 32 Good |
| so2 | 5 Good |

| index | 2020-05 | 2020-04 | 2020-03 | 2020-02 | 2020-01 | 2019-12 | 2019-11 | 2019-10 | 2019-09 | 2019-08 | 2019-07 | 2019-06 | 2019-05 | 2019-04 | 2019-03 | 2019-02 | 2019-01 | 2018-12 | 2018-11 | 2018-10 |
|---|---|---|---|---|---|---|---|---|---|---|---|---|---|---|---|---|---|---|---|---|
| pm25 | 26 (Moderate) | 24 (Moderate) | 25 (Moderate) | 49 (Unhealthy for Sensitive Groups) | 119 (Very bad Hazardous) | 52 (Unhealthy for Sensitive Groups) | 36 (Unhealthy for Sensitive Groups) | 33 (Moderate) | 19 (Moderate) | 15 (Moderate) | 17 (Moderate) | 20 (Moderate) | 29 (Moderate) | 26 (Moderate) | 35 (Unhealthy for Sensitive Groups) | 39 (Unhealthy for Sensitive Groups) | 38 (Unhealthy for Sensitive Groups) | 33 (Moderate) | 36 (Unhealthy for Sensitive Groups) | 35 (Unhealthy for Sensitive Groups) |
| co | 614 (Good) | 585 (Good) | 593 (Good) | 786 (Good) | 1 (Good) | 1 (Good) | 814 (Good) | 594 (Good) | 590 (Good) | 587 (Good) | 590 (Good) | 701 (Good) | 656 (Good) | 595 (Good) | 675 (Good) | 755 (Good) | 743 (Good) | 628 (Good) | 552 (Good) | 467 (Good) |
| no2 | 14 (Good) | 21 (Good) | 15 (Good) | 19 (Good) | 43 (Moderate) | 29 (Good) | 25 (Good) | 20 (Good) | 18 (Good) | 16 (Good) | 18 (Good) | 14 (Good) | 14 (Good) | 24 (Good) | 23 (Good) | 26 (Good) | 31 (Good) | 23 (Good) | 24 (Good) | 22 (Good) |
| o3 | 115 (Moderate) | 118 (Moderate) | 97 (Moderate) | 92 (Moderate) | 70 (Moderate) | 76 (Moderate) | 81 (Moderate) | 100 (Moderate) | 137 (Unhealthy for Sensitive Groups) | 131 (Unhealthy for Sensitive Groups) | 149 (Unhealthy for Sensitive Groups) | 141 (Unhealthy for Sensitive Groups) | 134 (Unhealthy for Sensitive Groups) | 122 (Unhealthy for Sensitive Groups) | 100 (Moderate) | 82 (Moderate) | 64 (Good) | 65 (Good) | 78 (Moderate) | 87 (Moderate) |
| pm10 | 86 (Unhealthy) | 68 (Unhealthy for Sensitive Groups) | 78 (Unhealthy for Sensitive Groups) | 107 (Unhealthy) | 171 (Very bad Hazardous) | 97 (Unhealthy) | 97 (Unhealthy) | 77 (Unhealthy for Sensitive Groups) | 37 (Moderate) | 33 (Moderate) | 45 (Moderate) | 59 (Unhealthy for Sensitive Groups) | 93 (Unhealthy) | 94 (Unhealthy) | 82 (Unhealthy) | 88 (Unhealthy) | 71 (Unhealthy for Sensitive Groups) | 79 (Unhealthy for Sensitive Groups) | 104 (Unhealthy) | 74 (Unhealthy for Sensitive Groups) |
| so2 | 11 (Good) | 11 (Good) | 12 (Good) | 16 (Good) | 28 (Good) | 17 (Good) | 13 (Good) | 7.7 (Good) | 6.8 (Good) | 7.5 (Good) | 9.3 (Good) | 8.9 (Good) | 8.4 (Good) | 13 (Good) | 14 (Good) | 21 (Good) | 24 (Good) | 19 (Good) | 13 (Good) | 8 (Good) |
PM10 6.7 (gut)
Feinstaub (PM10) SchwebestaubPM2,5 1.7 (gut)
Feinstaub (PM2,5)CO 100 (gut)
Kohlenmonoxid (CO)NO2 7.6 (gut)
Stickstoffdioxid (NO2)O3 0.02 (gut)
Ozon (O3)SO2 8.6 (gut)
Schwefeldioxid (SO2)市环保大楼
| index | 2022-05-27 |
|---|---|
| pm10 | 32 |
| pm25 | 24 |
| co | 468 |
| no2 | 21 |
| o3 | 32 |
| so2 | 4.6 |
市环保大楼

| index | 2020-05 | 2020-04 | 2020-03 | 2020-02 | 2020-01 | 2019-12 | 2019-11 | 2019-10 | 2019-09 | 2019-08 | 2019-07 | 2019-06 | 2019-05 | 2019-04 | 2019-03 | 2019-02 | 2019-01 | 2018-12 | 2018-11 | 2018-10 |
|---|---|---|---|---|---|---|---|---|---|---|---|---|---|---|---|---|---|---|---|---|
| pm25 | 26 | 24 | 25 | 49 | 119 | 52 | 36 | 33 | 19 | 15 | 17 | 20 | 29 | 26 | 35 | 39 | 38 | 33 | 36 | 35 |
| co | 614 | 585 | 593 | 786 | 1 | 1 | 814 | 594 | 590 | 587 | 590 | 701 | 656 | 595 | 675 | 755 | 743 | 628 | 552 | 467 |
| no2 | 14 | 21 | 15 | 19 | 43 | 29 | 25 | 20 | 18 | 16 | 18 | 14 | 14 | 24 | 23 | 26 | 31 | 23 | 24 | 22 |
| o3 | 115 | 118 | 97 | 92 | 70 | 76 | 81 | 100 | 137 | 131 | 149 | 141 | 134 | 122 | 100 | 82 | 64 | 65 | 78 | 87 |
| pm10 | 86 | 68 | 78 | 107 | 171 | 97 | 97 | 77 | 37 | 33 | 45 | 59 | 93 | 94 | 82 | 88 | 71 | 79 | 104 | 74 |
| so2 | 11 | 11 | 12 | 16 | 28 | 17 | 13 | 7.7 | 6.8 | 7.5 | 9.3 | 8.9 | 8.4 | 13 | 14 | 21 | 24 | 19 | 13 | 8 |