Luftverschmutzung in Shiyingcun: Echtzeit-Luft-Qualitätsindex und Smog-Alarm.
Für die Shiyingcun. Heute ist Donnerstag, 4. Juni 2026. Für Shiyingcun wurden folgende Luftverschmutzungswerte gemessen:- Feinstaub (PM10) Schwebestaub - 7 (gut)
- Feinstaub (PM2,5) - 2 (gut)
- Kohlenmonoxid (CO) - 100 (gut)
- Stickstoffdioxid (NO2) - 8 (gut)
- Ozon (O3) - 0 (gut)
- Schwefeldioxid (SO2) - 9 (gut)

Wie ist die Luftqualität Shiyingcun heute? Ist die Luft in Shiyingcun? verschmutzt. Gibt es Smog?
Wie hoch ist der PM10-Stand heute in Shiyingcun? (Feinstaub (PM10) Schwebestaub)
Der aktuelle Feinstaubgehalt PM10 in Shiyingcun is:
7 (gut)
Die höchsten PM10-Werte treten in der Regel im Monat auf: 121 (November 2018).
Der niedrigste Wert der Feinstaub-PM10-Belastung in Shiyingcun ist in der Regel in: August (33).
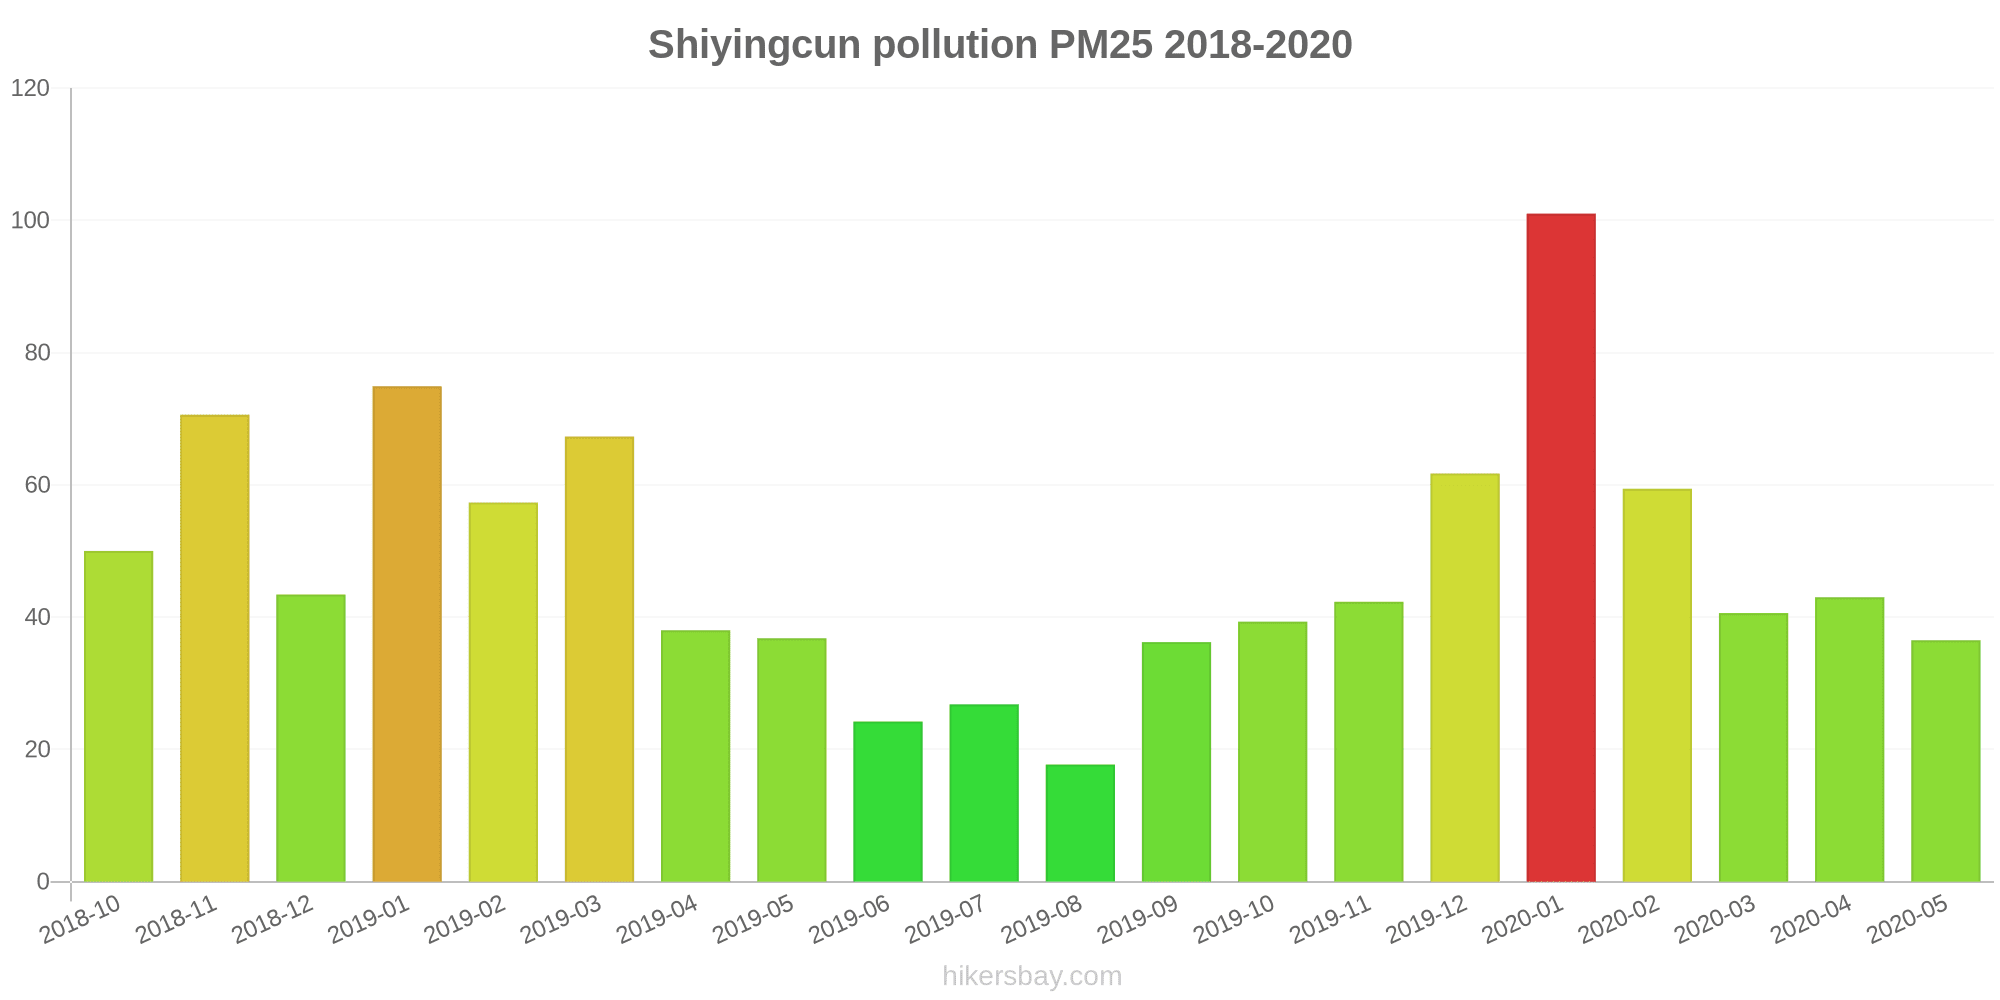
Wie hoch ist der aktuelle PM2,5-Wert in Shiyingcun? (Feinstaub (PM2,5))
Die heutige PM2.5-Stufe ist:
2 (gut)
Zum Vergleich: Der höchste PM2,5-Wert in Shiyingcun in den letzten 7 Tagen war: 24 (Freitag, 27. Mai 2022) und der niedrigste: 24 (Freitag, 27. Mai 2022).
Die höchsten PM2,5-Werte wurden gemessen: 101 (Januar 2020).
Die niedrigste Feinstaubbelastung PM2,5 tritt im Monat auf: August (18).
Wie hoch ist der CO-Gehalt? (Kohlenmonoxid (CO))
100 (gut)
Wie hoch ist das NO2-Niveau? (Stickstoffdioxid (NO2))
8 (gut)
Wie ist das O3-Niveau heute in Shiyingcun? (Ozon (O3))
0 (gut)
Wie hoch ist die SO2-Belastung? (Schwefeldioxid (SO2))
9 (gut)
Aktuelle Daten Freitag, 27. Mai 2022, 12:00
PM10 7 (gut)
PM2,5 2 (gut)
CO 100 (gut)
NO2 8 (gut)
O3 0 (gut)
SO2 9 (gut)
Daten zur Luftverschmutzung der letzten Tage in Shiyingcun
index
2022-05-27
pm10
32
Moderate
pm25
24
Moderate
co
468
Good
no2
21
Good
o3
32
Good
so2
5
Good
data source »
Luftverschmutzung in Shiyingcun von Oktober 2018 bis Mai 2020

index
2020-05
2020-04
2020-03
2020-02
2020-01
2019-12
2019-11
2019-10
2019-09
2019-08
2019-07
2019-06
2019-05
2019-04
2019-03
2019-02
2019-01
2018-12
2018-11
2018-10
pm25
37 (Unhealthy for Sensitive Groups)
43 (Unhealthy for Sensitive Groups)
41 (Unhealthy for Sensitive Groups)
59 (Unhealthy)
101 (Very Unhealthy)
62 (Unhealthy)
42 (Unhealthy for Sensitive Groups)
39 (Unhealthy for Sensitive Groups)
36 (Unhealthy for Sensitive Groups)
18 (Moderate)
27 (Moderate)
24 (Moderate)
37 (Unhealthy for Sensitive Groups)
38 (Unhealthy for Sensitive Groups)
67 (Unhealthy)
57 (Unhealthy)
75 (Unhealthy)
43 (Unhealthy for Sensitive Groups)
71 (Unhealthy)
50 (Unhealthy for Sensitive Groups)
co
858 (Good)
802 (Good)
787 (Good)
1 (Good)
1 (Good)
1 (Good)
1 (Good)
1 (Good)
988 (Good)
738 (Good)
865 (Good)
751 (Good)
746 (Good)
844 (Good)
1 (Good)
1 (Good)
1 (Good)
1 (Good)
1 (Good)
1 (Good)
no2
31 (Good)
29 (Good)
28 (Good)
28 (Good)
48 (Moderate)
45 (Moderate)
39 (Good)
39 (Good)
32 (Good)
21 (Good)
20 (Good)
24 (Good)
29 (Good)
30 (Good)
44 (Moderate)
41 (Moderate)
45 (Moderate)
36 (Good)
51 (Moderate)
43 (Moderate)
o3
134 (Unhealthy for Sensitive Groups)
120 (Unhealthy for Sensitive Groups)
87 (Moderate)
76 (Moderate)
66 (Good)
54 (Good)
57 (Good)
88 (Moderate)
137 (Unhealthy for Sensitive Groups)
114 (Moderate)
158 (Unhealthy)
150 (Unhealthy)
157 (Unhealthy)
112 (Moderate)
81 (Moderate)
65 (Good)
66 (Good)
63 (Good)
67 (Good)
87 (Moderate)
pm10
64 (Unhealthy for Sensitive Groups)
82 (Unhealthy)
67 (Unhealthy for Sensitive Groups)
72 (Unhealthy for Sensitive Groups)
115 (Very Unhealthy)
83 (Unhealthy)
72 (Unhealthy for Sensitive Groups)
78 (Unhealthy for Sensitive Groups)
59 (Unhealthy for Sensitive Groups)
33 (Moderate)
48 (Moderate)
45 (Moderate)
73 (Unhealthy for Sensitive Groups)
81 (Unhealthy)
94 (Unhealthy)
79 (Unhealthy for Sensitive Groups)
106 (Unhealthy)
68 (Unhealthy for Sensitive Groups)
121 (Very Unhealthy)
75 (Unhealthy for Sensitive Groups)
so2
19 (Good)
20 (Good)
35 (Good)
42 (Good)
74 (Moderate)
72 (Moderate)
57 (Moderate)
23 (Good)
19 (Good)
17 (Good)
12 (Good)
16 (Good)
21 (Good)
25 (Good)
44 (Good)
63 (Moderate)
68 (Moderate)
60 (Moderate)
66 (Moderate)
21 (Good)
data source »
天安街道
Freitag, 27. Mai 2022, 12:00
PM10 6.7 (gut)
Feinstaub (PM10) Schwebestaub
PM2,5 1.7 (gut)
Feinstaub (PM2,5)
CO 100 (gut)
Kohlenmonoxid (CO)
NO2 7.6 (gut)
Stickstoffdioxid (NO2)
O3 0.02 (gut)
Ozon (O3)
SO2 8.6 (gut)
Schwefeldioxid (SO2)
天安街道
index
2022-05-27
pm10
32
pm25
24
co
468
no2
21
o3
32
so2
4.6
天安街道
2018-10 2020-05

index
2020-05
2020-04
2020-03
2020-02
2020-01
2019-12
2019-11
2019-10
2019-09
2019-08
2019-07
2019-06
2019-05
2019-04
2019-03
2019-02
2019-01
2018-12
2018-11
2018-10
pm25
37
43
41
59
101
62
42
39
36
18
27
24
37
38
67
57
75
43
71
50
co
858
802
787
1
1
1
1
1
988
738
865
751
746
844
1
1
1
1
1
1
no2
31
29
28
28
48
45
39
39
32
21
20
24
29
30
44
41
45
36
51
43
o3
134
120
87
76
66
54
57
88
137
114
158
150
157
112
81
65
66
63
67
87
pm10
64
82
67
72
115
83
72
78
59
33
48
45
73
81
94
79
106
68
121
75
so2
19
20
35
42
74
72
57
23
19
17
12
16
21
25
44
63
68
60
66
21
* Pollution data source:
https://openaq.org
(ChinaAQIData)
The data is licensed under CC-By 4.0
PM10 7 (gut)
PM2,5 2 (gut)
CO 100 (gut)
NO2 8 (gut)
O3 0 (gut)
SO2 9 (gut)
Daten zur Luftverschmutzung der letzten Tage in Shiyingcun
| index | 2022-05-27 |
|---|---|
| pm10 | 32 Moderate |
| pm25 | 24 Moderate |
| co | 468 Good |
| no2 | 21 Good |
| o3 | 32 Good |
| so2 | 5 Good |
| index | 2020-05 | 2020-04 | 2020-03 | 2020-02 | 2020-01 | 2019-12 | 2019-11 | 2019-10 | 2019-09 | 2019-08 | 2019-07 | 2019-06 | 2019-05 | 2019-04 | 2019-03 | 2019-02 | 2019-01 | 2018-12 | 2018-11 | 2018-10 |
|---|---|---|---|---|---|---|---|---|---|---|---|---|---|---|---|---|---|---|---|---|
| pm25 | 37 (Unhealthy for Sensitive Groups) | 43 (Unhealthy for Sensitive Groups) | 41 (Unhealthy for Sensitive Groups) | 59 (Unhealthy) | 101 (Very Unhealthy) | 62 (Unhealthy) | 42 (Unhealthy for Sensitive Groups) | 39 (Unhealthy for Sensitive Groups) | 36 (Unhealthy for Sensitive Groups) | 18 (Moderate) | 27 (Moderate) | 24 (Moderate) | 37 (Unhealthy for Sensitive Groups) | 38 (Unhealthy for Sensitive Groups) | 67 (Unhealthy) | 57 (Unhealthy) | 75 (Unhealthy) | 43 (Unhealthy for Sensitive Groups) | 71 (Unhealthy) | 50 (Unhealthy for Sensitive Groups) |
| co | 858 (Good) | 802 (Good) | 787 (Good) | 1 (Good) | 1 (Good) | 1 (Good) | 1 (Good) | 1 (Good) | 988 (Good) | 738 (Good) | 865 (Good) | 751 (Good) | 746 (Good) | 844 (Good) | 1 (Good) | 1 (Good) | 1 (Good) | 1 (Good) | 1 (Good) | 1 (Good) |
| no2 | 31 (Good) | 29 (Good) | 28 (Good) | 28 (Good) | 48 (Moderate) | 45 (Moderate) | 39 (Good) | 39 (Good) | 32 (Good) | 21 (Good) | 20 (Good) | 24 (Good) | 29 (Good) | 30 (Good) | 44 (Moderate) | 41 (Moderate) | 45 (Moderate) | 36 (Good) | 51 (Moderate) | 43 (Moderate) |
| o3 | 134 (Unhealthy for Sensitive Groups) | 120 (Unhealthy for Sensitive Groups) | 87 (Moderate) | 76 (Moderate) | 66 (Good) | 54 (Good) | 57 (Good) | 88 (Moderate) | 137 (Unhealthy for Sensitive Groups) | 114 (Moderate) | 158 (Unhealthy) | 150 (Unhealthy) | 157 (Unhealthy) | 112 (Moderate) | 81 (Moderate) | 65 (Good) | 66 (Good) | 63 (Good) | 67 (Good) | 87 (Moderate) |
| pm10 | 64 (Unhealthy for Sensitive Groups) | 82 (Unhealthy) | 67 (Unhealthy for Sensitive Groups) | 72 (Unhealthy for Sensitive Groups) | 115 (Very Unhealthy) | 83 (Unhealthy) | 72 (Unhealthy for Sensitive Groups) | 78 (Unhealthy for Sensitive Groups) | 59 (Unhealthy for Sensitive Groups) | 33 (Moderate) | 48 (Moderate) | 45 (Moderate) | 73 (Unhealthy for Sensitive Groups) | 81 (Unhealthy) | 94 (Unhealthy) | 79 (Unhealthy for Sensitive Groups) | 106 (Unhealthy) | 68 (Unhealthy for Sensitive Groups) | 121 (Very Unhealthy) | 75 (Unhealthy for Sensitive Groups) |
| so2 | 19 (Good) | 20 (Good) | 35 (Good) | 42 (Good) | 74 (Moderate) | 72 (Moderate) | 57 (Moderate) | 23 (Good) | 19 (Good) | 17 (Good) | 12 (Good) | 16 (Good) | 21 (Good) | 25 (Good) | 44 (Good) | 63 (Moderate) | 68 (Moderate) | 60 (Moderate) | 66 (Moderate) | 21 (Good) |
PM10 6.7 (gut)
Feinstaub (PM10) SchwebestaubPM2,5 1.7 (gut)
Feinstaub (PM2,5)CO 100 (gut)
Kohlenmonoxid (CO)NO2 7.6 (gut)
Stickstoffdioxid (NO2)O3 0.02 (gut)
Ozon (O3)SO2 8.6 (gut)
Schwefeldioxid (SO2)天安街道
| index | 2022-05-27 |
|---|---|
| pm10 | 32 |
| pm25 | 24 |
| co | 468 |
| no2 | 21 |
| o3 | 32 |
| so2 | 4.6 |
天安街道

| index | 2020-05 | 2020-04 | 2020-03 | 2020-02 | 2020-01 | 2019-12 | 2019-11 | 2019-10 | 2019-09 | 2019-08 | 2019-07 | 2019-06 | 2019-05 | 2019-04 | 2019-03 | 2019-02 | 2019-01 | 2018-12 | 2018-11 | 2018-10 |
|---|---|---|---|---|---|---|---|---|---|---|---|---|---|---|---|---|---|---|---|---|
| pm25 | 37 | 43 | 41 | 59 | 101 | 62 | 42 | 39 | 36 | 18 | 27 | 24 | 37 | 38 | 67 | 57 | 75 | 43 | 71 | 50 |
| co | 858 | 802 | 787 | 1 | 1 | 1 | 1 | 1 | 988 | 738 | 865 | 751 | 746 | 844 | 1 | 1 | 1 | 1 | 1 | 1 |
| no2 | 31 | 29 | 28 | 28 | 48 | 45 | 39 | 39 | 32 | 21 | 20 | 24 | 29 | 30 | 44 | 41 | 45 | 36 | 51 | 43 |
| o3 | 134 | 120 | 87 | 76 | 66 | 54 | 57 | 88 | 137 | 114 | 158 | 150 | 157 | 112 | 81 | 65 | 66 | 63 | 67 | 87 |
| pm10 | 64 | 82 | 67 | 72 | 115 | 83 | 72 | 78 | 59 | 33 | 48 | 45 | 73 | 81 | 94 | 79 | 106 | 68 | 121 | 75 |
| so2 | 19 | 20 | 35 | 42 | 74 | 72 | 57 | 23 | 19 | 17 | 12 | 16 | 21 | 25 | 44 | 63 | 68 | 60 | 66 | 21 |