Luftverschmutzung in Shuijiatuncun: Echtzeit-Luft-Qualitätsindex und Smog-Alarm.
Für die Shuijiatuncun. Heute ist Donnerstag, 4. Juni 2026. Für Shuijiatuncun wurden folgende Luftverschmutzungswerte gemessen:- Feinstaub (PM10) Schwebestaub - 7 (gut)
- Feinstaub (PM2,5) - 2 (gut)
- Kohlenmonoxid (CO) - 100 (gut)
- Stickstoffdioxid (NO2) - 8 (gut)
- Ozon (O3) - 0 (gut)
- Schwefeldioxid (SO2) - 9 (gut)

Wie ist die Luftqualität Shuijiatuncun heute? Ist die Luft in Shuijiatuncun? verschmutzt. Gibt es Smog?
Wie hoch ist der PM10-Stand heute in Shuijiatuncun? (Feinstaub (PM10) Schwebestaub)
Der aktuelle Feinstaubgehalt PM10 in Shuijiatuncun is:
7 (gut)
Die höchsten PM10-Werte treten in der Regel im Monat auf: 159 (Januar 2020).
Der niedrigste Wert der Feinstaub-PM10-Belastung in Shuijiatuncun ist in der Regel in: August (32).
Wie hoch ist der aktuelle PM2,5-Wert in Shuijiatuncun? (Feinstaub (PM2,5))
Die heutige PM2.5-Stufe ist:
2 (gut)
Zum Vergleich: Der höchste PM2,5-Wert in Shuijiatuncun in den letzten 7 Tagen war: 24 (Freitag, 27. Mai 2022) und der niedrigste: 24 (Freitag, 27. Mai 2022).
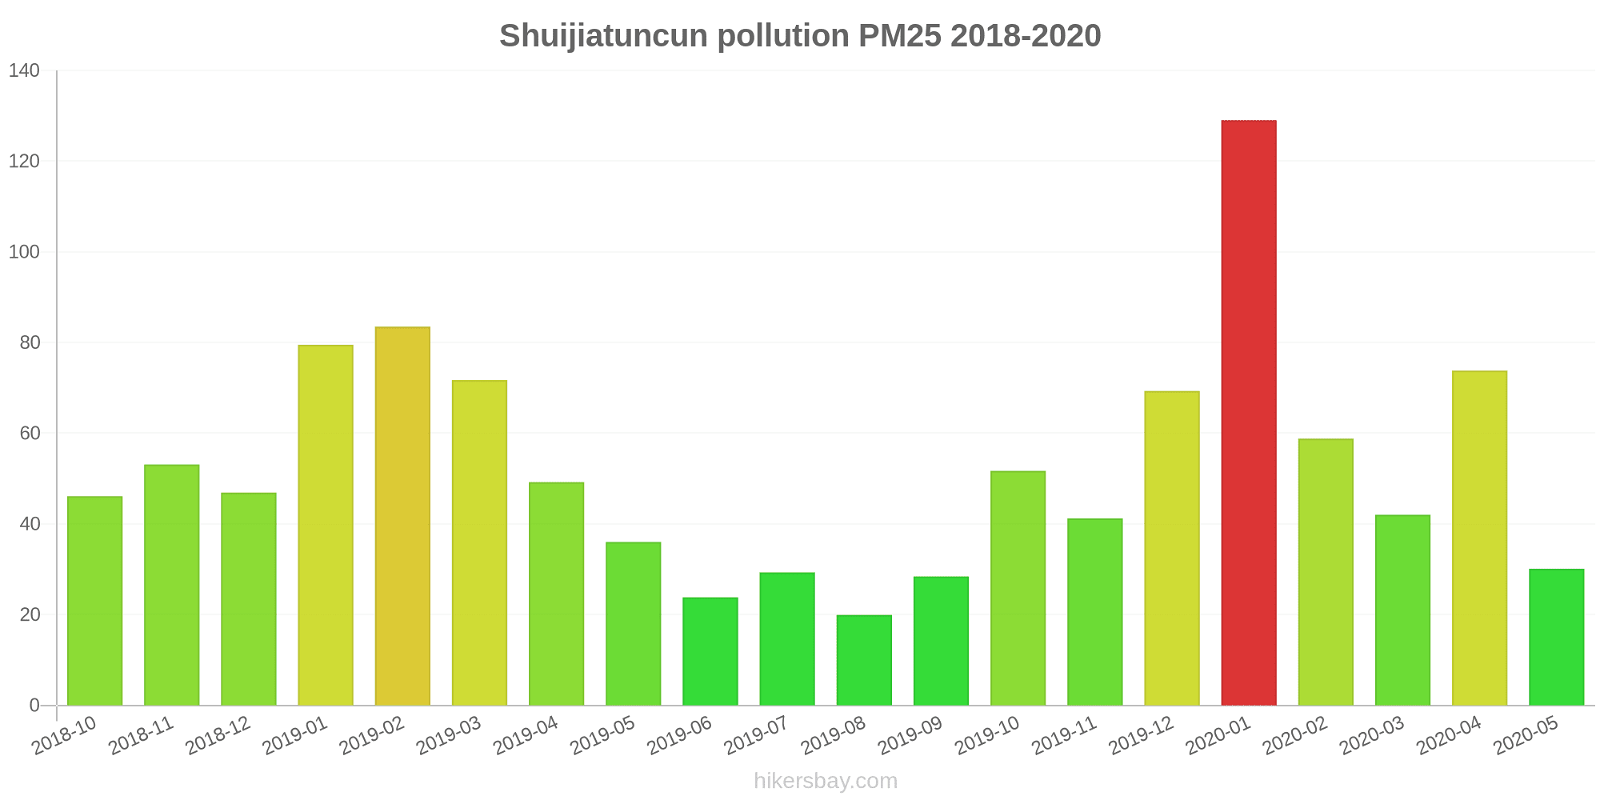
Die höchsten PM2,5-Werte wurden gemessen: 129 (Januar 2020).
Die niedrigste Feinstaubbelastung PM2,5 tritt im Monat auf: August (20).
Wie hoch ist der CO-Gehalt? (Kohlenmonoxid (CO))
100 (gut)
Wie hoch ist das NO2-Niveau? (Stickstoffdioxid (NO2))
8 (gut)
Wie ist das O3-Niveau heute in Shuijiatuncun? (Ozon (O3))
0 (gut)
Wie hoch ist die SO2-Belastung? (Schwefeldioxid (SO2))
9 (gut)
Aktuelle Daten Freitag, 27. Mai 2022, 12:00
PM10 7 (gut)
PM2,5 2 (gut)
CO 100 (gut)
NO2 8 (gut)
O3 0 (gut)
SO2 9 (gut)
Daten zur Luftverschmutzung der letzten Tage in Shuijiatuncun
index
2022-05-27
pm10
32
Moderate
pm25
24
Moderate
co
468
Good
no2
21
Good
o3
32
Good
so2
5
Good
data source »
Luftverschmutzung in Shuijiatuncun von Oktober 2018 bis Mai 2020
index
2020-05
2020-04
2020-03
2020-02
2020-01
2019-12
2019-11
2019-10
2019-09
2019-08
2019-07
2019-06
2019-05
2019-04
2019-03
2019-02
2019-01
2018-12
2018-11
2018-10
pm25
30 (Moderate)
74 (Unhealthy)
42 (Unhealthy for Sensitive Groups)
59 (Unhealthy)
129 (Very bad Hazardous)
69 (Unhealthy)
41 (Unhealthy for Sensitive Groups)
52 (Unhealthy for Sensitive Groups)
28 (Moderate)
20 (Moderate)
29 (Moderate)
24 (Moderate)
36 (Unhealthy for Sensitive Groups)
49 (Unhealthy for Sensitive Groups)
72 (Unhealthy)
84 (Very Unhealthy)
80 (Very Unhealthy)
47 (Unhealthy for Sensitive Groups)
53 (Unhealthy for Sensitive Groups)
46 (Unhealthy for Sensitive Groups)
co
518 (Good)
872 (Good)
595 (Good)
916 (Good)
1 (Good)
1 (Good)
836 (Good)
935 (Good)
975 (Good)
821 (Good)
933 (Good)
708 (Good)
676 (Good)
703 (Good)
1 (Good)
1 (Good)
1 (Good)
1 (Good)
1 (Good)
952 (Good)
no2
28 (Good)
40 (Moderate)
31 (Good)
31 (Good)
54 (Moderate)
44 (Moderate)
40 (Good)
40 (Good)
36 (Good)
24 (Good)
26 (Good)
29 (Good)
25 (Good)
35 (Good)
42 (Moderate)
44 (Moderate)
50 (Moderate)
39 (Good)
45 (Moderate)
42 (Moderate)
o3
129 (Unhealthy for Sensitive Groups)
128 (Unhealthy for Sensitive Groups)
94 (Moderate)
79 (Moderate)
59 (Good)
45 (Good)
54 (Good)
97 (Moderate)
128 (Unhealthy for Sensitive Groups)
111 (Moderate)
171 (Unhealthy)
149 (Unhealthy for Sensitive Groups)
142 (Unhealthy for Sensitive Groups)
117 (Moderate)
106 (Moderate)
76 (Moderate)
49 (Good)
45 (Good)
50 (Good)
70 (Good)
pm10
80 (Unhealthy for Sensitive Groups)
136 (Very Unhealthy)
76 (Unhealthy for Sensitive Groups)
80 (Unhealthy for Sensitive Groups)
159 (Very bad Hazardous)
91 (Unhealthy)
71 (Unhealthy for Sensitive Groups)
92 (Unhealthy)
58 (Unhealthy for Sensitive Groups)
32 (Moderate)
47 (Moderate)
43 (Moderate)
85 (Unhealthy)
119 (Very Unhealthy)
122 (Very Unhealthy)
112 (Very Unhealthy)
123 (Very Unhealthy)
74 (Unhealthy for Sensitive Groups)
87 (Unhealthy)
80 (Unhealthy)
so2
17 (Good)
21 (Good)
17 (Good)
20 (Good)
28 (Good)
27 (Good)
21 (Good)
20 (Good)
18 (Good)
13 (Good)
9.5 (Good)
14 (Good)
25 (Good)
27 (Good)
26 (Good)
29 (Good)
31 (Good)
27 (Good)
23 (Good)
25 (Good)
data source »
浑南东路
Freitag, 27. Mai 2022, 12:00
PM10 6.7 (gut)
Feinstaub (PM10) Schwebestaub
PM2,5 1.7 (gut)
Feinstaub (PM2,5)
CO 100 (gut)
Kohlenmonoxid (CO)
NO2 7.6 (gut)
Stickstoffdioxid (NO2)
O3 0.02 (gut)
Ozon (O3)
SO2 8.6 (gut)
Schwefeldioxid (SO2)
浑南东路
index
2022-05-27
pm10
32
pm25
24
co
468
no2
21
o3
32
so2
4.6
浑南东路
2018-10 2020-05

index
2020-05
2020-04
2020-03
2020-02
2020-01
2019-12
2019-11
2019-10
2019-09
2019-08
2019-07
2019-06
2019-05
2019-04
2019-03
2019-02
2019-01
2018-12
2018-11
2018-10
pm25
30
74
42
59
129
69
41
52
28
20
29
24
36
49
72
84
80
47
53
46
co
518
872
595
916
1
1
836
935
975
821
933
708
676
703
1
1
1
1
1
952
no2
28
40
31
31
54
44
40
40
36
24
26
29
25
35
42
44
50
39
45
42
o3
129
128
94
79
59
45
54
97
128
111
171
149
142
117
106
76
49
45
50
70
pm10
80
136
76
80
159
91
71
92
58
32
47
43
85
119
122
112
123
74
87
80
so2
17
21
17
20
28
27
21
20
18
13
9.5
14
25
27
26
29
31
27
23
25
* Pollution data source:
https://openaq.org
(ChinaAQIData)
The data is licensed under CC-By 4.0
PM10 7 (gut)
PM2,5 2 (gut)
CO 100 (gut)
NO2 8 (gut)
O3 0 (gut)
SO2 9 (gut)
Daten zur Luftverschmutzung der letzten Tage in Shuijiatuncun
| index | 2022-05-27 |
|---|---|
| pm10 | 32 Moderate |
| pm25 | 24 Moderate |
| co | 468 Good |
| no2 | 21 Good |
| o3 | 32 Good |
| so2 | 5 Good |

| index | 2020-05 | 2020-04 | 2020-03 | 2020-02 | 2020-01 | 2019-12 | 2019-11 | 2019-10 | 2019-09 | 2019-08 | 2019-07 | 2019-06 | 2019-05 | 2019-04 | 2019-03 | 2019-02 | 2019-01 | 2018-12 | 2018-11 | 2018-10 |
|---|---|---|---|---|---|---|---|---|---|---|---|---|---|---|---|---|---|---|---|---|
| pm25 | 30 (Moderate) | 74 (Unhealthy) | 42 (Unhealthy for Sensitive Groups) | 59 (Unhealthy) | 129 (Very bad Hazardous) | 69 (Unhealthy) | 41 (Unhealthy for Sensitive Groups) | 52 (Unhealthy for Sensitive Groups) | 28 (Moderate) | 20 (Moderate) | 29 (Moderate) | 24 (Moderate) | 36 (Unhealthy for Sensitive Groups) | 49 (Unhealthy for Sensitive Groups) | 72 (Unhealthy) | 84 (Very Unhealthy) | 80 (Very Unhealthy) | 47 (Unhealthy for Sensitive Groups) | 53 (Unhealthy for Sensitive Groups) | 46 (Unhealthy for Sensitive Groups) |
| co | 518 (Good) | 872 (Good) | 595 (Good) | 916 (Good) | 1 (Good) | 1 (Good) | 836 (Good) | 935 (Good) | 975 (Good) | 821 (Good) | 933 (Good) | 708 (Good) | 676 (Good) | 703 (Good) | 1 (Good) | 1 (Good) | 1 (Good) | 1 (Good) | 1 (Good) | 952 (Good) |
| no2 | 28 (Good) | 40 (Moderate) | 31 (Good) | 31 (Good) | 54 (Moderate) | 44 (Moderate) | 40 (Good) | 40 (Good) | 36 (Good) | 24 (Good) | 26 (Good) | 29 (Good) | 25 (Good) | 35 (Good) | 42 (Moderate) | 44 (Moderate) | 50 (Moderate) | 39 (Good) | 45 (Moderate) | 42 (Moderate) |
| o3 | 129 (Unhealthy for Sensitive Groups) | 128 (Unhealthy for Sensitive Groups) | 94 (Moderate) | 79 (Moderate) | 59 (Good) | 45 (Good) | 54 (Good) | 97 (Moderate) | 128 (Unhealthy for Sensitive Groups) | 111 (Moderate) | 171 (Unhealthy) | 149 (Unhealthy for Sensitive Groups) | 142 (Unhealthy for Sensitive Groups) | 117 (Moderate) | 106 (Moderate) | 76 (Moderate) | 49 (Good) | 45 (Good) | 50 (Good) | 70 (Good) |
| pm10 | 80 (Unhealthy for Sensitive Groups) | 136 (Very Unhealthy) | 76 (Unhealthy for Sensitive Groups) | 80 (Unhealthy for Sensitive Groups) | 159 (Very bad Hazardous) | 91 (Unhealthy) | 71 (Unhealthy for Sensitive Groups) | 92 (Unhealthy) | 58 (Unhealthy for Sensitive Groups) | 32 (Moderate) | 47 (Moderate) | 43 (Moderate) | 85 (Unhealthy) | 119 (Very Unhealthy) | 122 (Very Unhealthy) | 112 (Very Unhealthy) | 123 (Very Unhealthy) | 74 (Unhealthy for Sensitive Groups) | 87 (Unhealthy) | 80 (Unhealthy) |
| so2 | 17 (Good) | 21 (Good) | 17 (Good) | 20 (Good) | 28 (Good) | 27 (Good) | 21 (Good) | 20 (Good) | 18 (Good) | 13 (Good) | 9.5 (Good) | 14 (Good) | 25 (Good) | 27 (Good) | 26 (Good) | 29 (Good) | 31 (Good) | 27 (Good) | 23 (Good) | 25 (Good) |
PM10 6.7 (gut)
Feinstaub (PM10) SchwebestaubPM2,5 1.7 (gut)
Feinstaub (PM2,5)CO 100 (gut)
Kohlenmonoxid (CO)NO2 7.6 (gut)
Stickstoffdioxid (NO2)O3 0.02 (gut)
Ozon (O3)SO2 8.6 (gut)
Schwefeldioxid (SO2)浑南东路
| index | 2022-05-27 |
|---|---|
| pm10 | 32 |
| pm25 | 24 |
| co | 468 |
| no2 | 21 |
| o3 | 32 |
| so2 | 4.6 |
浑南东路

| index | 2020-05 | 2020-04 | 2020-03 | 2020-02 | 2020-01 | 2019-12 | 2019-11 | 2019-10 | 2019-09 | 2019-08 | 2019-07 | 2019-06 | 2019-05 | 2019-04 | 2019-03 | 2019-02 | 2019-01 | 2018-12 | 2018-11 | 2018-10 |
|---|---|---|---|---|---|---|---|---|---|---|---|---|---|---|---|---|---|---|---|---|
| pm25 | 30 | 74 | 42 | 59 | 129 | 69 | 41 | 52 | 28 | 20 | 29 | 24 | 36 | 49 | 72 | 84 | 80 | 47 | 53 | 46 |
| co | 518 | 872 | 595 | 916 | 1 | 1 | 836 | 935 | 975 | 821 | 933 | 708 | 676 | 703 | 1 | 1 | 1 | 1 | 1 | 952 |
| no2 | 28 | 40 | 31 | 31 | 54 | 44 | 40 | 40 | 36 | 24 | 26 | 29 | 25 | 35 | 42 | 44 | 50 | 39 | 45 | 42 |
| o3 | 129 | 128 | 94 | 79 | 59 | 45 | 54 | 97 | 128 | 111 | 171 | 149 | 142 | 117 | 106 | 76 | 49 | 45 | 50 | 70 |
| pm10 | 80 | 136 | 76 | 80 | 159 | 91 | 71 | 92 | 58 | 32 | 47 | 43 | 85 | 119 | 122 | 112 | 123 | 74 | 87 | 80 |
| so2 | 17 | 21 | 17 | 20 | 28 | 27 | 21 | 20 | 18 | 13 | 9.5 | 14 | 25 | 27 | 26 | 29 | 31 | 27 | 23 | 25 |