Luftverschmutzung in Donggebicun: Echtzeit-Luft-Qualitätsindex und Smog-Alarm.
Für die Donggebicun. Heute ist Sonntag, 21. Dezember 2025. Für Donggebicun wurden folgende Luftverschmutzungswerte gemessen:- Feinstaub (PM2,5) - 22 (Moderate)
- Kohlenmonoxid (CO) - 219 (gut)
- Ozon (O3) - 0 (gut)
- Stickstoffdioxid (NO2) - 7 (gut)
- Feinstaub (PM10) Schwebestaub - 36 (Moderate)
- Schwefeldioxid (SO2) - 8 (gut)

Wie ist die Luftqualität Donggebicun heute? Ist die Luft in Donggebicun? verschmutzt. Gibt es Smog?
Wie hoch ist der aktuelle PM2,5-Wert in Donggebicun? (Feinstaub (PM2,5))
Die heutige PM2.5-Stufe ist:
22 (Moderate)
Zum Vergleich: Der höchste PM2,5-Wert in Donggebicun in den letzten 7 Tagen war: 23 (Freitag, 27. Mai 2022) und der niedrigste: 23 (Freitag, 27. Mai 2022).
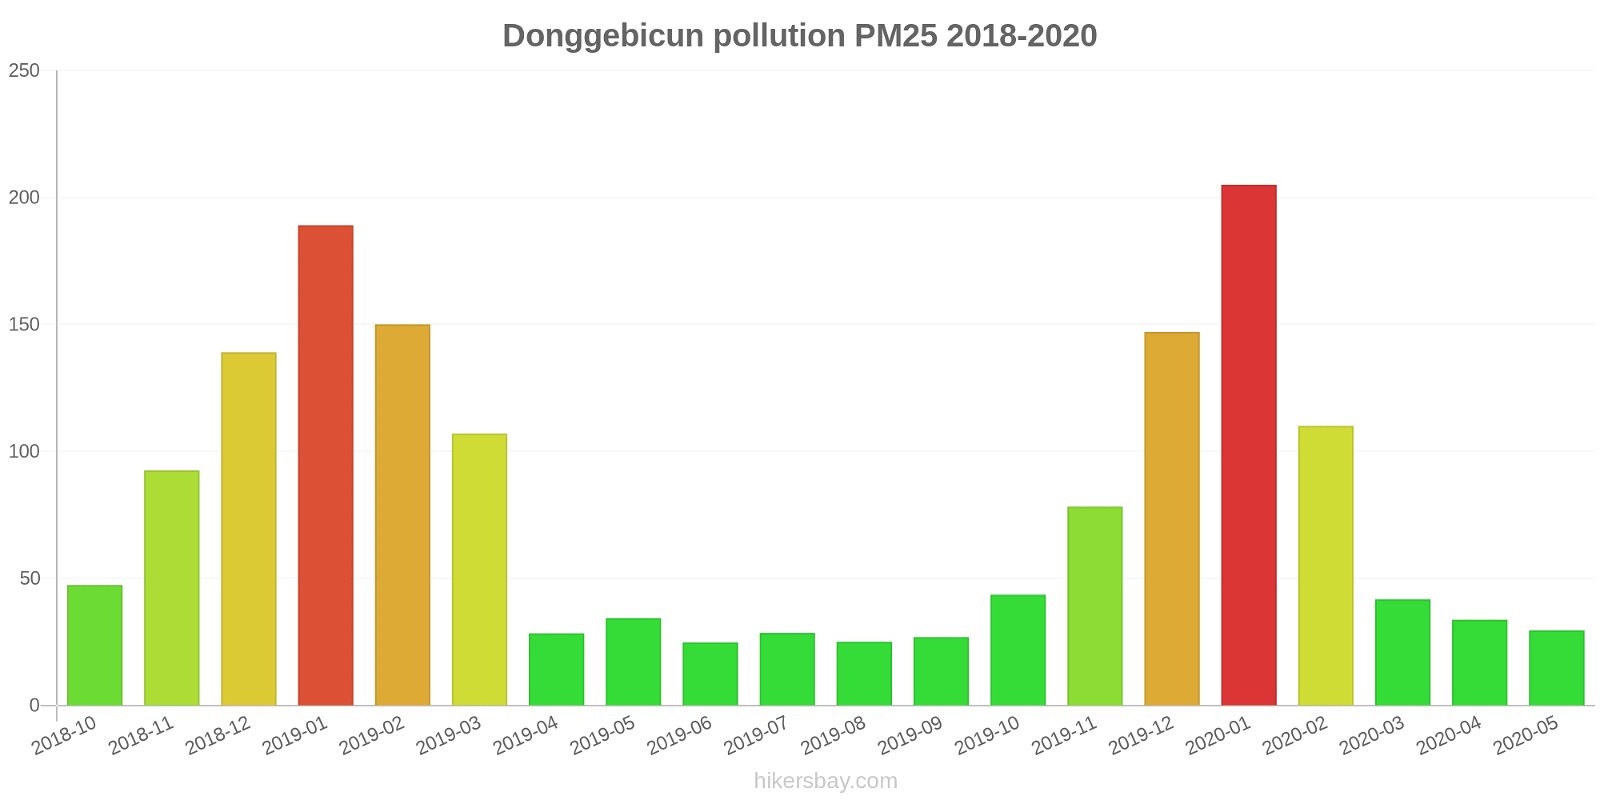
Die höchsten PM2,5-Werte wurden gemessen: 205 (Januar 2020).
Die niedrigste Feinstaubbelastung PM2,5 tritt im Monat auf: Juni (25).
Wie hoch ist der CO-Gehalt? (Kohlenmonoxid (CO))
219 (gut)
Wie ist das O3-Niveau heute in Donggebicun? (Ozon (O3))
0 (gut)
Wie hoch ist das NO2-Niveau? (Stickstoffdioxid (NO2))
7 (gut)
Wie hoch ist der PM10-Stand heute in Donggebicun? (Feinstaub (PM10) Schwebestaub)
Der aktuelle Feinstaubgehalt PM10 in Donggebicun is:
36 (Moderate)
Die höchsten PM10-Werte treten in der Regel im Monat auf: 292 (Dezember 2018).
Der niedrigste Wert der Feinstaub-PM10-Belastung in Donggebicun ist in der Regel in: August (29).
Wie hoch ist die SO2-Belastung? (Schwefeldioxid (SO2))
8 (gut)
Aktuelle Daten Freitag, 27. Mai 2022, 15:00
PM2,5 22 (Moderate)
CO 219 (gut)
O3 0 (gut)
NO2 7 (gut)
PM10 36 (Moderate)
SO2 8 (gut)
Daten zur Luftverschmutzung der letzten Tage in Donggebicun
index
2022-05-27
pm25
23
Moderate
co
475
Good
o3
25
Good
no2
21
Good
pm10
32
Moderate
so2
4
Good
data source »
Luftverschmutzung in Donggebicun von Oktober 2018 bis Mai 2020

index
2020-05
2020-04
2020-03
2020-02
2020-01
2019-12
2019-11
2019-10
2019-09
2019-08
2019-07
2019-06
2019-05
2019-04
2019-03
2019-02
2019-01
2018-12
2018-11
2018-10
pm25
30 (Moderate)
34 (Moderate)
42 (Unhealthy for Sensitive Groups)
110 (Very bad Hazardous)
205 (Very bad Hazardous)
147 (Very bad Hazardous)
78 (Very Unhealthy)
44 (Unhealthy for Sensitive Groups)
27 (Moderate)
25 (Moderate)
29 (Moderate)
25 (Moderate)
34 (Moderate)
28 (Moderate)
107 (Very Unhealthy)
150 (Very bad Hazardous)
189 (Very bad Hazardous)
139 (Very bad Hazardous)
93 (Very Unhealthy)
47 (Unhealthy for Sensitive Groups)
co
467 (Good)
603 (Good)
1 (Good)
1 (Good)
2 (Good)
2 (Good)
1 (Good)
1 (Good)
743 (Good)
599 (Good)
537 (Good)
545 (Good)
615 (Good)
692 (Good)
1 (Good)
1 (Good)
2 (Good)
2 (Good)
1 (Good)
1 (Good)
no2
30 (Good)
27 (Good)
33 (Good)
49 (Moderate)
81 (Moderate)
70 (Moderate)
51 (Moderate)
51 (Moderate)
46 (Moderate)
43 (Moderate)
39 (Good)
30 (Good)
32 (Good)
31 (Good)
48 (Moderate)
56 (Moderate)
69 (Moderate)
89 (Moderate)
55 (Moderate)
52 (Moderate)
o3
130 (Unhealthy for Sensitive Groups)
120 (Unhealthy for Sensitive Groups)
93 (Moderate)
106 (Moderate)
60 (Good)
38 (Good)
55 (Good)
79 (Moderate)
124 (Unhealthy for Sensitive Groups)
141 (Unhealthy for Sensitive Groups)
147 (Unhealthy for Sensitive Groups)
122 (Unhealthy for Sensitive Groups)
110 (Moderate)
88 (Moderate)
100 (Moderate)
100 (Moderate)
54 (Good)
45 (Good)
50 (Good)
62 (Good)
pm10
80 (Unhealthy)
119 (Very Unhealthy)
84 (Unhealthy)
84 (Unhealthy)
168 (Very bad Hazardous)
156 (Very bad Hazardous)
104 (Unhealthy)
116 (Very Unhealthy)
54 (Unhealthy for Sensitive Groups)
29 (Moderate)
38 (Moderate)
35 (Moderate)
71 (Unhealthy for Sensitive Groups)
84 (Unhealthy)
136 (Very Unhealthy)
169 (Very bad Hazardous)
236 (Very bad Hazardous)
292 (Very bad Hazardous)
214 (Very bad Hazardous)
129 (Very Unhealthy)
so2
6.8 (Good)
7 (Good)
8.3 (Good)
11 (Good)
11 (Good)
8.5 (Good)
12 (Good)
9.8 (Good)
6.8 (Good)
5.6 (Good)
5.3 (Good)
5.6 (Good)
5.8 (Good)
5.5 (Good)
9.7 (Good)
14 (Good)
14 (Good)
13 (Good)
11 (Good)
14 (Good)
data source »
新疆农科院农场
Freitag, 27. Mai 2022, 15:00
PM2,5 22 (Moderate)
Feinstaub (PM2,5)
CO 219 (gut)
Kohlenmonoxid (CO)
O3 0.05 (gut)
Ozon (O3)
NO2 7 (gut)
Stickstoffdioxid (NO2)
PM10 36 (Moderate)
Feinstaub (PM10) Schwebestaub
SO2 7.7 (gut)
Schwefeldioxid (SO2)
新疆农科院农场
index
2022-05-27
pm25
23
co
475
o3
25
no2
21
pm10
32
so2
4.4
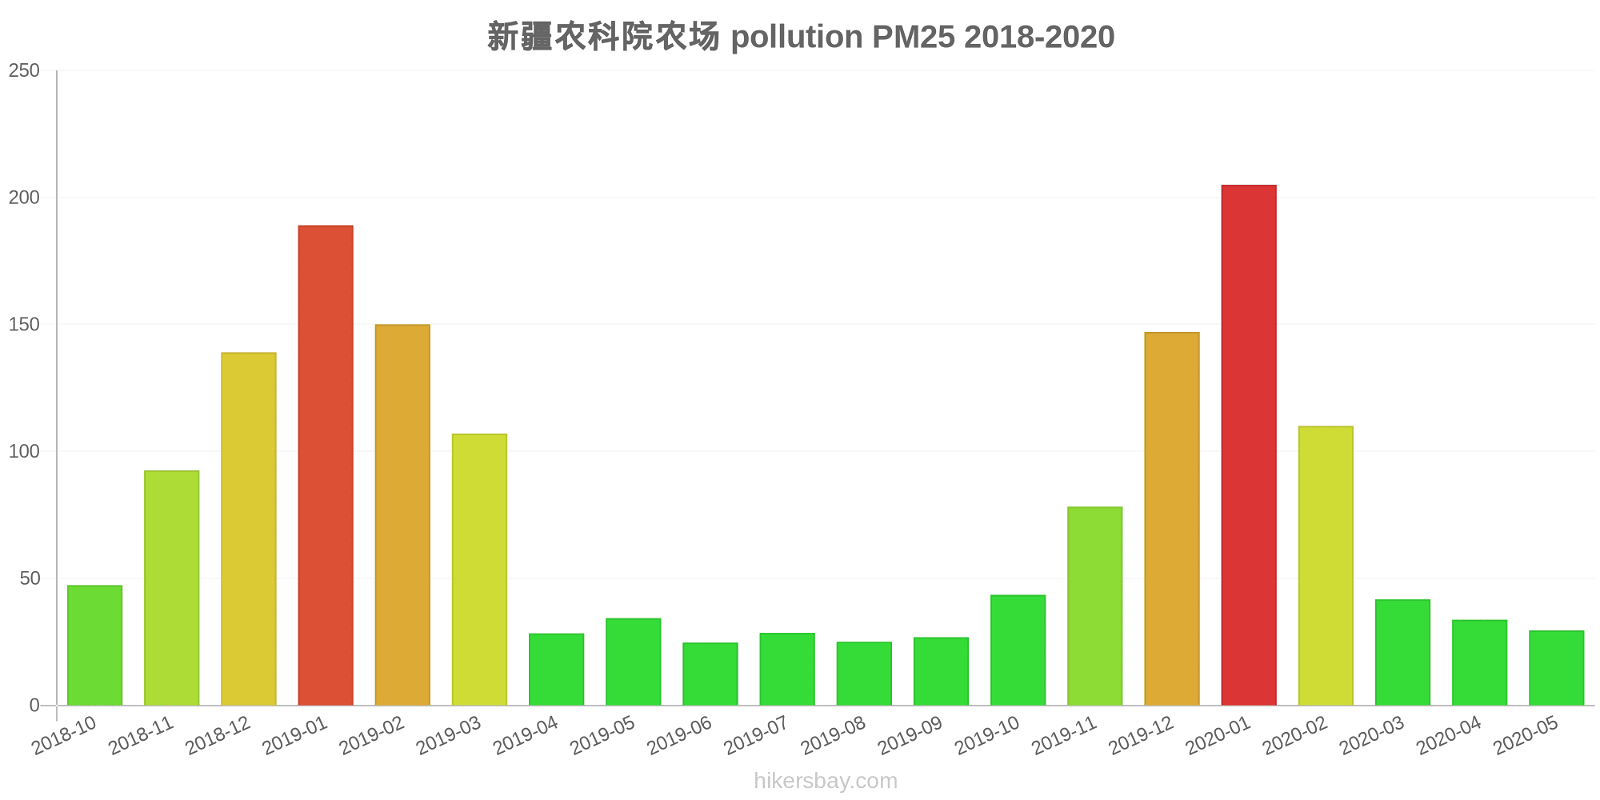
新疆农科院农场
2018-10 2020-05

index
2020-05
2020-04
2020-03
2020-02
2020-01
2019-12
2019-11
2019-10
2019-09
2019-08
2019-07
2019-06
2019-05
2019-04
2019-03
2019-02
2019-01
2018-12
2018-11
2018-10
pm25
30
34
42
110
205
147
78
44
27
25
29
25
34
28
107
150
189
139
93
47
co
467
603
1
1
2
2
1
1
743
599
537
545
615
692
1
1
2
2
1
1
no2
30
27
33
49
81
70
51
51
46
43
39
30
32
31
48
56
69
89
55
52
o3
130
120
93
106
60
38
55
79
124
141
147
122
110
88
100
100
54
45
50
62
pm10
80
119
84
84
168
156
104
116
54
29
38
35
71
84
136
169
236
292
214
129
so2
6.8
7
8.3
11
11
8.5
12
9.8
6.8
5.6
5.3
5.6
5.8
5.5
9.7
14
14
13
11
14
* Pollution data source:
https://openaq.org
(ChinaAQIData)
The data is licensed under CC-By 4.0
PM2,5 22 (Moderate)
CO 219 (gut)
O3 0 (gut)
NO2 7 (gut)
PM10 36 (Moderate)
SO2 8 (gut)
Daten zur Luftverschmutzung der letzten Tage in Donggebicun
| index | 2022-05-27 |
|---|---|
| pm25 | 23 Moderate |
| co | 475 Good |
| o3 | 25 Good |
| no2 | 21 Good |
| pm10 | 32 Moderate |
| so2 | 4 Good |

| index | 2020-05 | 2020-04 | 2020-03 | 2020-02 | 2020-01 | 2019-12 | 2019-11 | 2019-10 | 2019-09 | 2019-08 | 2019-07 | 2019-06 | 2019-05 | 2019-04 | 2019-03 | 2019-02 | 2019-01 | 2018-12 | 2018-11 | 2018-10 |
|---|---|---|---|---|---|---|---|---|---|---|---|---|---|---|---|---|---|---|---|---|
| pm25 | 30 (Moderate) | 34 (Moderate) | 42 (Unhealthy for Sensitive Groups) | 110 (Very bad Hazardous) | 205 (Very bad Hazardous) | 147 (Very bad Hazardous) | 78 (Very Unhealthy) | 44 (Unhealthy for Sensitive Groups) | 27 (Moderate) | 25 (Moderate) | 29 (Moderate) | 25 (Moderate) | 34 (Moderate) | 28 (Moderate) | 107 (Very Unhealthy) | 150 (Very bad Hazardous) | 189 (Very bad Hazardous) | 139 (Very bad Hazardous) | 93 (Very Unhealthy) | 47 (Unhealthy for Sensitive Groups) |
| co | 467 (Good) | 603 (Good) | 1 (Good) | 1 (Good) | 2 (Good) | 2 (Good) | 1 (Good) | 1 (Good) | 743 (Good) | 599 (Good) | 537 (Good) | 545 (Good) | 615 (Good) | 692 (Good) | 1 (Good) | 1 (Good) | 2 (Good) | 2 (Good) | 1 (Good) | 1 (Good) |
| no2 | 30 (Good) | 27 (Good) | 33 (Good) | 49 (Moderate) | 81 (Moderate) | 70 (Moderate) | 51 (Moderate) | 51 (Moderate) | 46 (Moderate) | 43 (Moderate) | 39 (Good) | 30 (Good) | 32 (Good) | 31 (Good) | 48 (Moderate) | 56 (Moderate) | 69 (Moderate) | 89 (Moderate) | 55 (Moderate) | 52 (Moderate) |
| o3 | 130 (Unhealthy for Sensitive Groups) | 120 (Unhealthy for Sensitive Groups) | 93 (Moderate) | 106 (Moderate) | 60 (Good) | 38 (Good) | 55 (Good) | 79 (Moderate) | 124 (Unhealthy for Sensitive Groups) | 141 (Unhealthy for Sensitive Groups) | 147 (Unhealthy for Sensitive Groups) | 122 (Unhealthy for Sensitive Groups) | 110 (Moderate) | 88 (Moderate) | 100 (Moderate) | 100 (Moderate) | 54 (Good) | 45 (Good) | 50 (Good) | 62 (Good) |
| pm10 | 80 (Unhealthy) | 119 (Very Unhealthy) | 84 (Unhealthy) | 84 (Unhealthy) | 168 (Very bad Hazardous) | 156 (Very bad Hazardous) | 104 (Unhealthy) | 116 (Very Unhealthy) | 54 (Unhealthy for Sensitive Groups) | 29 (Moderate) | 38 (Moderate) | 35 (Moderate) | 71 (Unhealthy for Sensitive Groups) | 84 (Unhealthy) | 136 (Very Unhealthy) | 169 (Very bad Hazardous) | 236 (Very bad Hazardous) | 292 (Very bad Hazardous) | 214 (Very bad Hazardous) | 129 (Very Unhealthy) |
| so2 | 6.8 (Good) | 7 (Good) | 8.3 (Good) | 11 (Good) | 11 (Good) | 8.5 (Good) | 12 (Good) | 9.8 (Good) | 6.8 (Good) | 5.6 (Good) | 5.3 (Good) | 5.6 (Good) | 5.8 (Good) | 5.5 (Good) | 9.7 (Good) | 14 (Good) | 14 (Good) | 13 (Good) | 11 (Good) | 14 (Good) |
PM2,5 22 (Moderate)
Feinstaub (PM2,5)CO 219 (gut)
Kohlenmonoxid (CO)O3 0.05 (gut)
Ozon (O3)NO2 7 (gut)
Stickstoffdioxid (NO2)PM10 36 (Moderate)
Feinstaub (PM10) SchwebestaubSO2 7.7 (gut)
Schwefeldioxid (SO2)新疆农科院农场
| index | 2022-05-27 |
|---|---|
| pm25 | 23 |
| co | 475 |
| o3 | 25 |
| no2 | 21 |
| pm10 | 32 |
| so2 | 4.4 |
新疆农科院农场

| index | 2020-05 | 2020-04 | 2020-03 | 2020-02 | 2020-01 | 2019-12 | 2019-11 | 2019-10 | 2019-09 | 2019-08 | 2019-07 | 2019-06 | 2019-05 | 2019-04 | 2019-03 | 2019-02 | 2019-01 | 2018-12 | 2018-11 | 2018-10 |
|---|---|---|---|---|---|---|---|---|---|---|---|---|---|---|---|---|---|---|---|---|
| pm25 | 30 | 34 | 42 | 110 | 205 | 147 | 78 | 44 | 27 | 25 | 29 | 25 | 34 | 28 | 107 | 150 | 189 | 139 | 93 | 47 |
| co | 467 | 603 | 1 | 1 | 2 | 2 | 1 | 1 | 743 | 599 | 537 | 545 | 615 | 692 | 1 | 1 | 2 | 2 | 1 | 1 |
| no2 | 30 | 27 | 33 | 49 | 81 | 70 | 51 | 51 | 46 | 43 | 39 | 30 | 32 | 31 | 48 | 56 | 69 | 89 | 55 | 52 |
| o3 | 130 | 120 | 93 | 106 | 60 | 38 | 55 | 79 | 124 | 141 | 147 | 122 | 110 | 88 | 100 | 100 | 54 | 45 | 50 | 62 |
| pm10 | 80 | 119 | 84 | 84 | 168 | 156 | 104 | 116 | 54 | 29 | 38 | 35 | 71 | 84 | 136 | 169 | 236 | 292 | 214 | 129 |
| so2 | 6.8 | 7 | 8.3 | 11 | 11 | 8.5 | 12 | 9.8 | 6.8 | 5.6 | 5.3 | 5.6 | 5.8 | 5.5 | 9.7 | 14 | 14 | 13 | 11 | 14 |