Luftverschmutzung in Zhongqiaqicun: Echtzeit-Luft-Qualitätsindex und Smog-Alarm.
Für die Zhongqiaqicun. Heute ist Montag, 22. Dezember 2025. Für Zhongqiaqicun wurden folgende Luftverschmutzungswerte gemessen:- Feinstaub (PM2,5) - 22 (Moderate)
- Kohlenmonoxid (CO) - 219 (gut)
- Ozon (O3) - 0 (gut)
- Stickstoffdioxid (NO2) - 7 (gut)
- Feinstaub (PM10) Schwebestaub - 36 (Moderate)
- Schwefeldioxid (SO2) - 8 (gut)

Wie ist die Luftqualität Zhongqiaqicun heute? Ist die Luft in Zhongqiaqicun? verschmutzt. Gibt es Smog?
Wie hoch ist der aktuelle PM2,5-Wert in Zhongqiaqicun? (Feinstaub (PM2,5))
Die heutige PM2.5-Stufe ist:
22 (Moderate)
Zum Vergleich: Der höchste PM2,5-Wert in Zhongqiaqicun in den letzten 7 Tagen war: 23 (Freitag, 27. Mai 2022) und der niedrigste: 23 (Freitag, 27. Mai 2022).
Die höchsten PM2,5-Werte wurden gemessen: 85 (März 2020).
Die niedrigste Feinstaubbelastung PM2,5 tritt im Monat auf: September (26).
Wie hoch ist der CO-Gehalt? (Kohlenmonoxid (CO))
219 (gut)
Wie ist das O3-Niveau heute in Zhongqiaqicun? (Ozon (O3))
0 (gut)
Wie hoch ist das NO2-Niveau? (Stickstoffdioxid (NO2))
7 (gut)
Wie hoch ist der PM10-Stand heute in Zhongqiaqicun? (Feinstaub (PM10) Schwebestaub)
Der aktuelle Feinstaubgehalt PM10 in Zhongqiaqicun is:
36 (Moderate)
Die höchsten PM10-Werte treten in der Regel im Monat auf: 356 (März 2020).
Der niedrigste Wert der Feinstaub-PM10-Belastung in Zhongqiaqicun ist in der Regel in: Januar (75).
Wie hoch ist die SO2-Belastung? (Schwefeldioxid (SO2))
8 (gut)
Aktuelle Daten Freitag, 27. Mai 2022, 15:00
PM2,5 22 (Moderate)
CO 219 (gut)
O3 0 (gut)
NO2 7 (gut)
PM10 36 (Moderate)
SO2 8 (gut)
Daten zur Luftverschmutzung der letzten Tage in Zhongqiaqicun
index
2022-05-27
pm25
23
Moderate
co
475
Good
o3
25
Good
no2
21
Good
pm10
32
Moderate
so2
4
Good
data source »
Luftverschmutzung in Zhongqiaqicun von Oktober 2018 bis Mai 2020
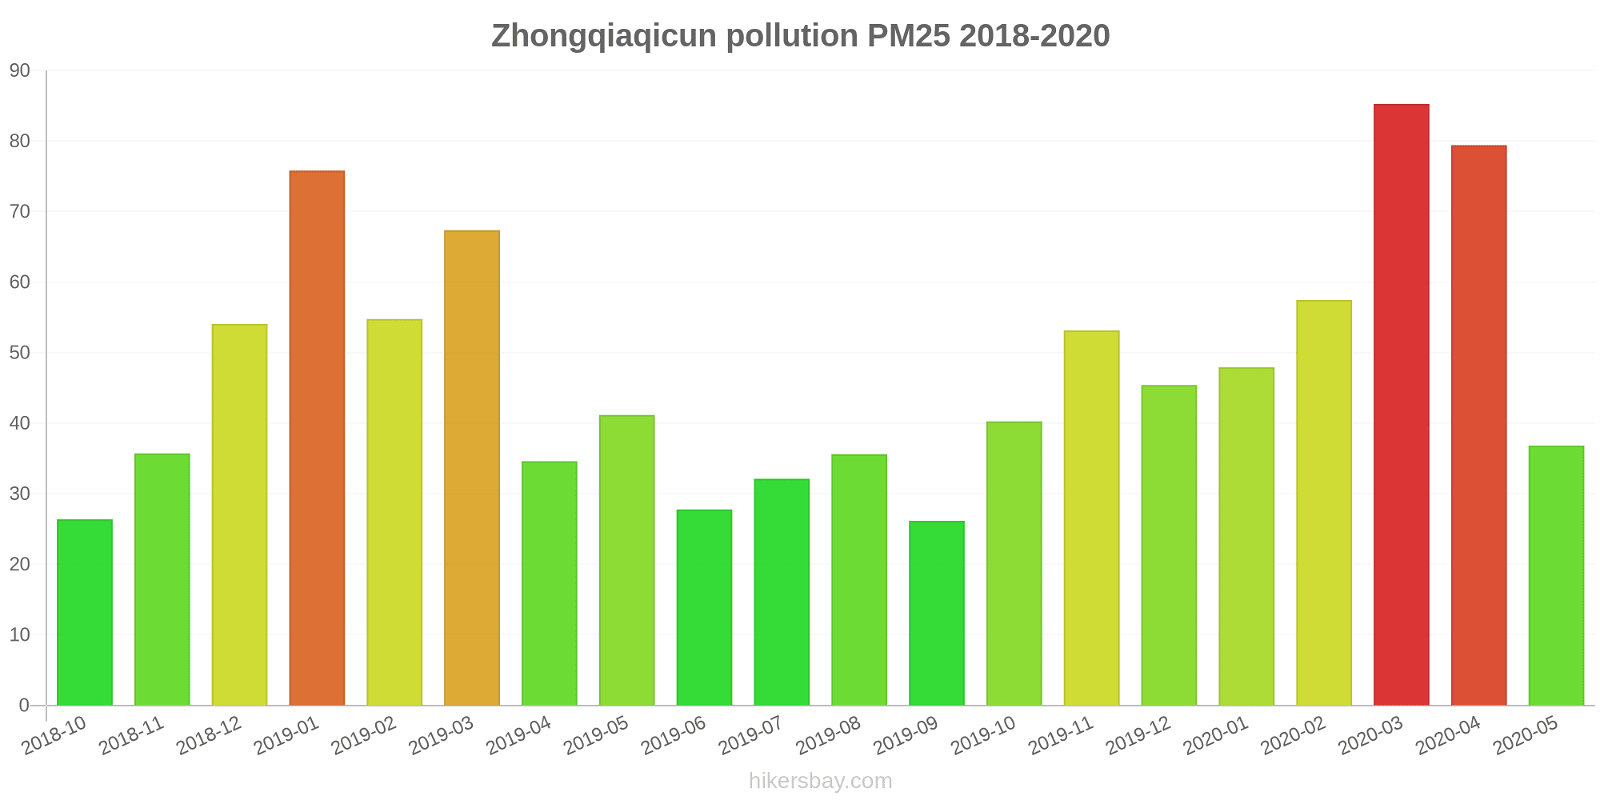
index
2020-05
2020-04
2020-03
2020-02
2020-01
2019-12
2019-11
2019-10
2019-09
2019-08
2019-07
2019-06
2019-05
2019-04
2019-03
2019-02
2019-01
2018-12
2018-11
2018-10
pm25
37 (Unhealthy for Sensitive Groups)
79 (Very Unhealthy)
85 (Very Unhealthy)
57 (Unhealthy)
48 (Unhealthy for Sensitive Groups)
45 (Unhealthy for Sensitive Groups)
53 (Unhealthy for Sensitive Groups)
40 (Unhealthy for Sensitive Groups)
26 (Moderate)
36 (Unhealthy for Sensitive Groups)
32 (Moderate)
28 (Moderate)
41 (Unhealthy for Sensitive Groups)
35 (Moderate)
67 (Unhealthy)
55 (Unhealthy for Sensitive Groups)
76 (Very Unhealthy)
54 (Unhealthy for Sensitive Groups)
36 (Unhealthy for Sensitive Groups)
26 (Moderate)
co
471 (Good)
425 (Good)
531 (Good)
606 (Good)
822 (Good)
880 (Good)
627 (Good)
575 (Good)
658 (Good)
674 (Good)
604 (Good)
662 (Good)
503 (Good)
452 (Good)
534 (Good)
578 (Good)
324 (Good)
689 (Good)
641 (Good)
528 (Good)
no2
11 (Good)
16 (Good)
11 (Good)
9.1 (Good)
21 (Good)
30 (Good)
31 (Good)
23 (Good)
20 (Good)
16 (Good)
14 (Good)
15 (Good)
15 (Good)
18 (Good)
25 (Good)
16 (Good)
23 (Good)
20 (Good)
22 (Good)
26 (Good)
o3
114 (Moderate)
105 (Moderate)
103 (Moderate)
94 (Moderate)
77 (Moderate)
79 (Moderate)
85 (Moderate)
92 (Moderate)
113 (Moderate)
119 (Moderate)
124 (Unhealthy for Sensitive Groups)
119 (Moderate)
109 (Moderate)
100 (Moderate)
111 (Moderate)
85 (Moderate)
79 (Moderate)
57 (Good)
66 (Good)
81 (Moderate)
pm10
116 (Very Unhealthy)
294 (Very bad Hazardous)
356 (Very bad Hazardous)
205 (Very bad Hazardous)
75 (Unhealthy for Sensitive Groups)
114 (Very Unhealthy)
179 (Very bad Hazardous)
150 (Very Unhealthy)
94 (Unhealthy)
110 (Unhealthy)
108 (Unhealthy)
109 (Unhealthy)
141 (Very Unhealthy)
150 (Very Unhealthy)
323 (Very bad Hazardous)
290 (Very bad Hazardous)
194 (Very bad Hazardous)
228 (Very bad Hazardous)
128 (Very Unhealthy)
103 (Unhealthy)
so2
4 (Good)
3.6 (Good)
5.4 (Good)
7.7 (Good)
6.1 (Good)
5.1 (Good)
6.2 (Good)
4.4 (Good)
4 (Good)
4.8 (Good)
6.1 (Good)
5.2 (Good)
6 (Good)
4.4 (Good)
5.1 (Good)
6.1 (Good)
6.2 (Good)
6 (Good)
7.1 (Good)
6.3 (Good)
data source »
棉纺厂
Freitag, 27. Mai 2022, 15:00
PM2,5 22 (Moderate)
Feinstaub (PM2,5)
CO 219 (gut)
Kohlenmonoxid (CO)
O3 0.05 (gut)
Ozon (O3)
NO2 7 (gut)
Stickstoffdioxid (NO2)
PM10 36 (Moderate)
Feinstaub (PM10) Schwebestaub
SO2 7.7 (gut)
Schwefeldioxid (SO2)
经济开发区
Freitag, 27. Mai 2022, 15:00
PM2,5 22 (Moderate)
Feinstaub (PM2,5)
CO 219 (gut)
Kohlenmonoxid (CO)
O3 0.05 (gut)
Ozon (O3)
NO2 7 (gut)
Stickstoffdioxid (NO2)
PM10 36 (Moderate)
Feinstaub (PM10) Schwebestaub
SO2 7.7 (gut)
Schwefeldioxid (SO2)
棉纺厂
index
2022-05-27
pm25
23
co
475
o3
25
no2
21
pm10
32
so2
4.4
经济开发区
index
2022-05-27
pm25
23
co
475
o3
25
no2
21
pm10
32
so2
4.4
棉纺厂
2018-10 2020-05
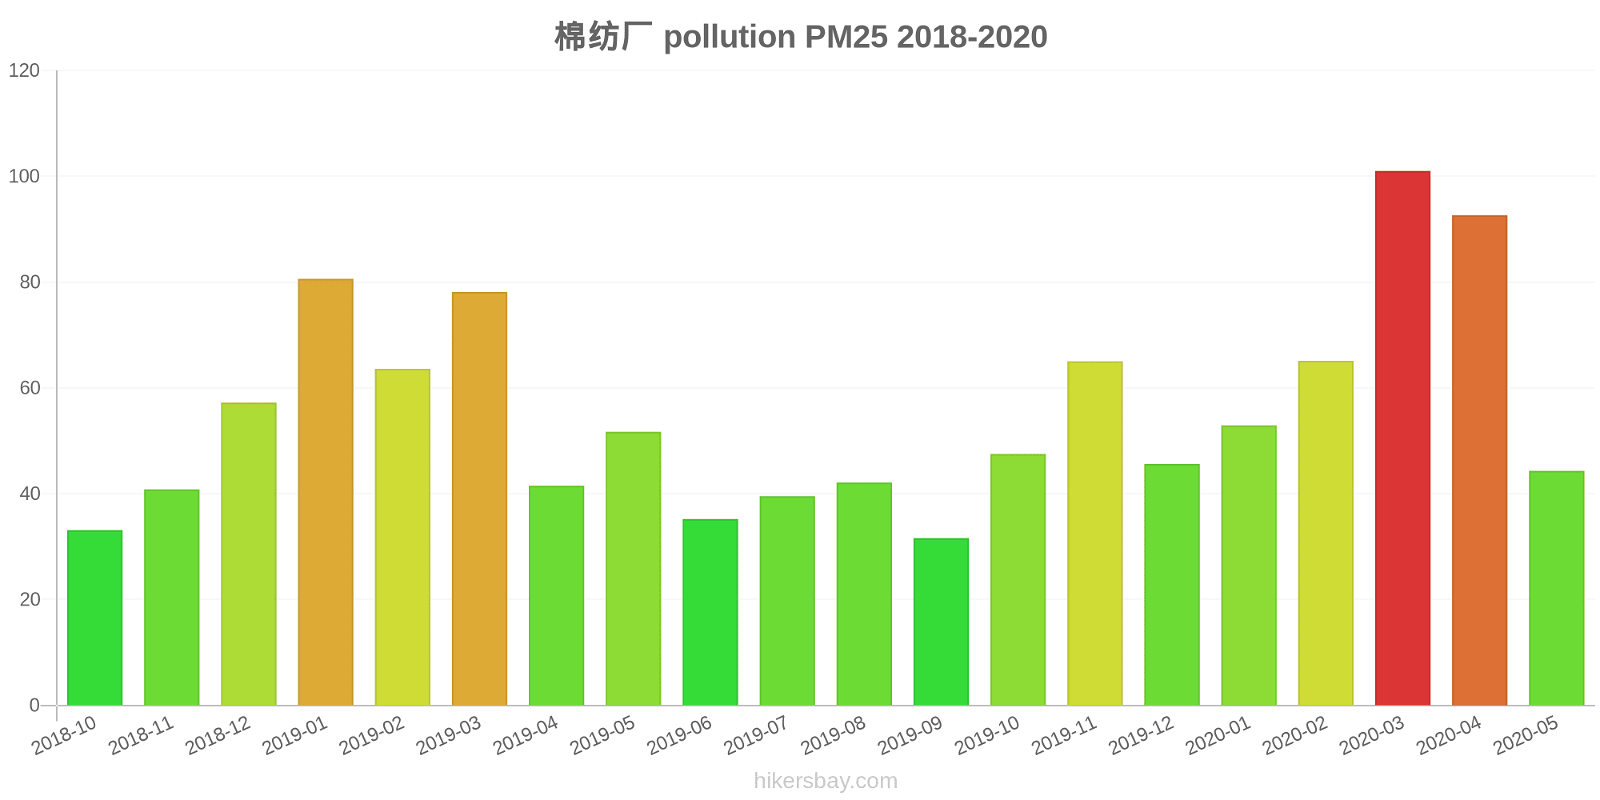
index
2020-05
2020-04
2020-03
2020-02
2020-01
2019-12
2019-11
2019-10
2019-09
2019-08
2019-07
2019-06
2019-05
2019-04
2019-03
2019-02
2019-01
2018-12
2018-11
2018-10
pm25
44
93
101
65
53
46
65
48
32
42
40
35
52
42
78
64
81
57
41
33
co
518
429
487
595
889
864
660
538
677
659
617
716
504
544
784
794
1
802
785
588
no2
13
20
12
9.4
23
34
37
27
23
17
15
16
17
21
27
19
25
21
24
28
o3
116
105
101
93
74
81
86
94
118
119
124
121
99
90
107
89
82
49
65
72
pm10
105
275
329
192
73
113
173
146
94
109
107
108
142
150
333
276
196
232
131
97
so2
5.6
5
7.5
7.7
6
4.1
6.6
4.5
3.8
6.6
6.4
6.3
5.9
5.2
6.5
7.1
6.3
4.8
7.6
7.1
经济开发区
2018-10 2020-05
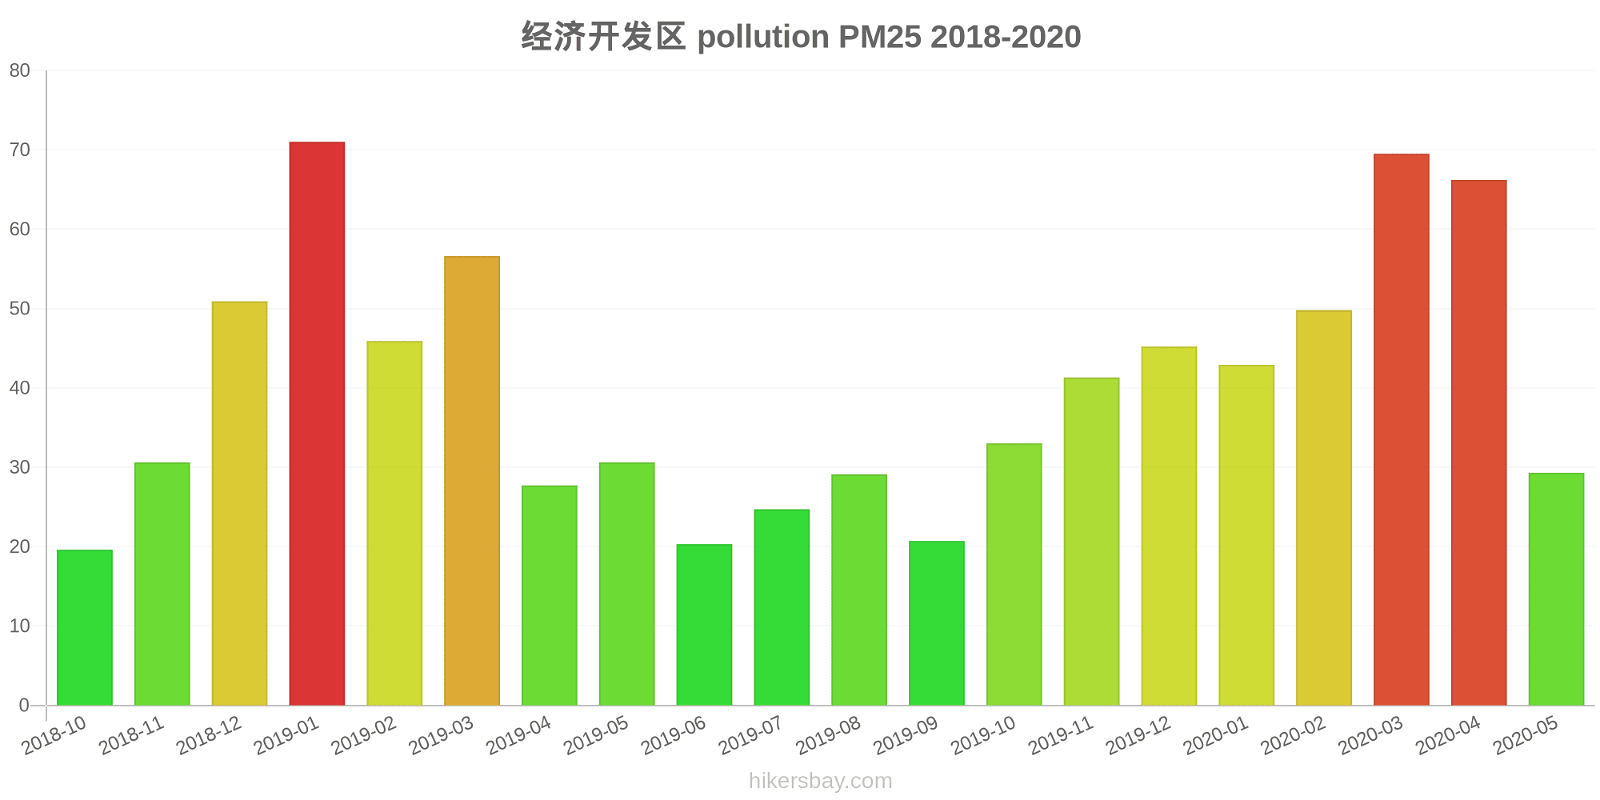
index
2020-05
2020-04
2020-03
2020-02
2020-01
2019-12
2019-11
2019-10
2019-09
2019-08
2019-07
2019-06
2019-05
2019-04
2019-03
2019-02
2019-01
2018-12
2018-11
2018-10
pm25
29
66
70
50
43
45
41
33
21
29
25
20
31
28
57
46
71
51
31
20
co
424
420
574
617
755
895
594
612
638
688
591
607
502
360
283
362
646
576
497
467
no2
8.4
12
10
8.7
19
27
26
19
17
15
13
14
13
15
23
13
20
19
19
23
o3
112
104
105
95
80
77
84
90
108
118
123
117
118
110
114
81
77
66
66
89
pm10
126
312
382
217
77
114
184
153
94
110
109
109
139
149
313
303
192
223
124
108
so2
2.5
2.3
3.3
7.8
6.3
6
5.8
4.3
4.1
3
5.7
4.1
6.1
3.6
3.6
5
6.2
7.2
6.5
5.5
* Pollution data source:
https://openaq.org
(ChinaAQIData)
The data is licensed under CC-By 4.0
PM2,5 22 (Moderate)
CO 219 (gut)
O3 0 (gut)
NO2 7 (gut)
PM10 36 (Moderate)
SO2 8 (gut)
Daten zur Luftverschmutzung der letzten Tage in Zhongqiaqicun
| index | 2022-05-27 |
|---|---|
| pm25 | 23 Moderate |
| co | 475 Good |
| o3 | 25 Good |
| no2 | 21 Good |
| pm10 | 32 Moderate |
| so2 | 4 Good |
| index | 2020-05 | 2020-04 | 2020-03 | 2020-02 | 2020-01 | 2019-12 | 2019-11 | 2019-10 | 2019-09 | 2019-08 | 2019-07 | 2019-06 | 2019-05 | 2019-04 | 2019-03 | 2019-02 | 2019-01 | 2018-12 | 2018-11 | 2018-10 |
|---|---|---|---|---|---|---|---|---|---|---|---|---|---|---|---|---|---|---|---|---|
| pm25 | 37 (Unhealthy for Sensitive Groups) | 79 (Very Unhealthy) | 85 (Very Unhealthy) | 57 (Unhealthy) | 48 (Unhealthy for Sensitive Groups) | 45 (Unhealthy for Sensitive Groups) | 53 (Unhealthy for Sensitive Groups) | 40 (Unhealthy for Sensitive Groups) | 26 (Moderate) | 36 (Unhealthy for Sensitive Groups) | 32 (Moderate) | 28 (Moderate) | 41 (Unhealthy for Sensitive Groups) | 35 (Moderate) | 67 (Unhealthy) | 55 (Unhealthy for Sensitive Groups) | 76 (Very Unhealthy) | 54 (Unhealthy for Sensitive Groups) | 36 (Unhealthy for Sensitive Groups) | 26 (Moderate) |
| co | 471 (Good) | 425 (Good) | 531 (Good) | 606 (Good) | 822 (Good) | 880 (Good) | 627 (Good) | 575 (Good) | 658 (Good) | 674 (Good) | 604 (Good) | 662 (Good) | 503 (Good) | 452 (Good) | 534 (Good) | 578 (Good) | 324 (Good) | 689 (Good) | 641 (Good) | 528 (Good) |
| no2 | 11 (Good) | 16 (Good) | 11 (Good) | 9.1 (Good) | 21 (Good) | 30 (Good) | 31 (Good) | 23 (Good) | 20 (Good) | 16 (Good) | 14 (Good) | 15 (Good) | 15 (Good) | 18 (Good) | 25 (Good) | 16 (Good) | 23 (Good) | 20 (Good) | 22 (Good) | 26 (Good) |
| o3 | 114 (Moderate) | 105 (Moderate) | 103 (Moderate) | 94 (Moderate) | 77 (Moderate) | 79 (Moderate) | 85 (Moderate) | 92 (Moderate) | 113 (Moderate) | 119 (Moderate) | 124 (Unhealthy for Sensitive Groups) | 119 (Moderate) | 109 (Moderate) | 100 (Moderate) | 111 (Moderate) | 85 (Moderate) | 79 (Moderate) | 57 (Good) | 66 (Good) | 81 (Moderate) |
| pm10 | 116 (Very Unhealthy) | 294 (Very bad Hazardous) | 356 (Very bad Hazardous) | 205 (Very bad Hazardous) | 75 (Unhealthy for Sensitive Groups) | 114 (Very Unhealthy) | 179 (Very bad Hazardous) | 150 (Very Unhealthy) | 94 (Unhealthy) | 110 (Unhealthy) | 108 (Unhealthy) | 109 (Unhealthy) | 141 (Very Unhealthy) | 150 (Very Unhealthy) | 323 (Very bad Hazardous) | 290 (Very bad Hazardous) | 194 (Very bad Hazardous) | 228 (Very bad Hazardous) | 128 (Very Unhealthy) | 103 (Unhealthy) |
| so2 | 4 (Good) | 3.6 (Good) | 5.4 (Good) | 7.7 (Good) | 6.1 (Good) | 5.1 (Good) | 6.2 (Good) | 4.4 (Good) | 4 (Good) | 4.8 (Good) | 6.1 (Good) | 5.2 (Good) | 6 (Good) | 4.4 (Good) | 5.1 (Good) | 6.1 (Good) | 6.2 (Good) | 6 (Good) | 7.1 (Good) | 6.3 (Good) |
PM2,5 22 (Moderate)
Feinstaub (PM2,5)CO 219 (gut)
Kohlenmonoxid (CO)O3 0.05 (gut)
Ozon (O3)NO2 7 (gut)
Stickstoffdioxid (NO2)PM10 36 (Moderate)
Feinstaub (PM10) SchwebestaubSO2 7.7 (gut)
Schwefeldioxid (SO2)PM2,5 22 (Moderate)
Feinstaub (PM2,5)CO 219 (gut)
Kohlenmonoxid (CO)O3 0.05 (gut)
Ozon (O3)NO2 7 (gut)
Stickstoffdioxid (NO2)PM10 36 (Moderate)
Feinstaub (PM10) SchwebestaubSO2 7.7 (gut)
Schwefeldioxid (SO2)棉纺厂
| index | 2022-05-27 |
|---|---|
| pm25 | 23 |
| co | 475 |
| o3 | 25 |
| no2 | 21 |
| pm10 | 32 |
| so2 | 4.4 |
经济开发区
| index | 2022-05-27 |
|---|---|
| pm25 | 23 |
| co | 475 |
| o3 | 25 |
| no2 | 21 |
| pm10 | 32 |
| so2 | 4.4 |
棉纺厂
| index | 2020-05 | 2020-04 | 2020-03 | 2020-02 | 2020-01 | 2019-12 | 2019-11 | 2019-10 | 2019-09 | 2019-08 | 2019-07 | 2019-06 | 2019-05 | 2019-04 | 2019-03 | 2019-02 | 2019-01 | 2018-12 | 2018-11 | 2018-10 |
|---|---|---|---|---|---|---|---|---|---|---|---|---|---|---|---|---|---|---|---|---|
| pm25 | 44 | 93 | 101 | 65 | 53 | 46 | 65 | 48 | 32 | 42 | 40 | 35 | 52 | 42 | 78 | 64 | 81 | 57 | 41 | 33 |
| co | 518 | 429 | 487 | 595 | 889 | 864 | 660 | 538 | 677 | 659 | 617 | 716 | 504 | 544 | 784 | 794 | 1 | 802 | 785 | 588 |
| no2 | 13 | 20 | 12 | 9.4 | 23 | 34 | 37 | 27 | 23 | 17 | 15 | 16 | 17 | 21 | 27 | 19 | 25 | 21 | 24 | 28 |
| o3 | 116 | 105 | 101 | 93 | 74 | 81 | 86 | 94 | 118 | 119 | 124 | 121 | 99 | 90 | 107 | 89 | 82 | 49 | 65 | 72 |
| pm10 | 105 | 275 | 329 | 192 | 73 | 113 | 173 | 146 | 94 | 109 | 107 | 108 | 142 | 150 | 333 | 276 | 196 | 232 | 131 | 97 |
| so2 | 5.6 | 5 | 7.5 | 7.7 | 6 | 4.1 | 6.6 | 4.5 | 3.8 | 6.6 | 6.4 | 6.3 | 5.9 | 5.2 | 6.5 | 7.1 | 6.3 | 4.8 | 7.6 | 7.1 |
经济开发区
| index | 2020-05 | 2020-04 | 2020-03 | 2020-02 | 2020-01 | 2019-12 | 2019-11 | 2019-10 | 2019-09 | 2019-08 | 2019-07 | 2019-06 | 2019-05 | 2019-04 | 2019-03 | 2019-02 | 2019-01 | 2018-12 | 2018-11 | 2018-10 |
|---|---|---|---|---|---|---|---|---|---|---|---|---|---|---|---|---|---|---|---|---|
| pm25 | 29 | 66 | 70 | 50 | 43 | 45 | 41 | 33 | 21 | 29 | 25 | 20 | 31 | 28 | 57 | 46 | 71 | 51 | 31 | 20 |
| co | 424 | 420 | 574 | 617 | 755 | 895 | 594 | 612 | 638 | 688 | 591 | 607 | 502 | 360 | 283 | 362 | 646 | 576 | 497 | 467 |
| no2 | 8.4 | 12 | 10 | 8.7 | 19 | 27 | 26 | 19 | 17 | 15 | 13 | 14 | 13 | 15 | 23 | 13 | 20 | 19 | 19 | 23 |
| o3 | 112 | 104 | 105 | 95 | 80 | 77 | 84 | 90 | 108 | 118 | 123 | 117 | 118 | 110 | 114 | 81 | 77 | 66 | 66 | 89 |
| pm10 | 126 | 312 | 382 | 217 | 77 | 114 | 184 | 153 | 94 | 110 | 109 | 109 | 139 | 149 | 313 | 303 | 192 | 223 | 124 | 108 |
| so2 | 2.5 | 2.3 | 3.3 | 7.8 | 6.3 | 6 | 5.8 | 4.3 | 4.1 | 3 | 5.7 | 4.1 | 6.1 | 3.6 | 3.6 | 5 | 6.2 | 7.2 | 6.5 | 5.5 |