Luftverschmutzung in Luogangzhen: Echtzeit-Luft-Qualitätsindex und Smog-Alarm.
Für die Luogangzhen. Heute ist Donnerstag, 4. Juni 2026. Für Luogangzhen wurden folgende Luftverschmutzungswerte gemessen:- Feinstaub (PM2,5) - 22 (Moderate)
- Kohlenmonoxid (CO) - 219 (gut)
- Ozon (O3) - 0 (gut)
- Stickstoffdioxid (NO2) - 7 (gut)
- Feinstaub (PM10) Schwebestaub - 36 (Moderate)
- Schwefeldioxid (SO2) - 8 (gut)

Wie ist die Luftqualität Luogangzhen heute? Ist die Luft in Luogangzhen? verschmutzt. Gibt es Smog?
Wie hoch ist der aktuelle PM2,5-Wert in Luogangzhen? (Feinstaub (PM2,5))
Die heutige PM2.5-Stufe ist:
22 (Moderate)
Zum Vergleich: Der höchste PM2,5-Wert in Luogangzhen in den letzten 7 Tagen war: 23 (Freitag, 27. Mai 2022) und der niedrigste: 23 (Freitag, 27. Mai 2022).
Die höchsten PM2,5-Werte wurden gemessen: 93 (Januar 2019).
Die niedrigste Feinstaubbelastung PM2,5 tritt im Monat auf: August (25).
Wie hoch ist der CO-Gehalt? (Kohlenmonoxid (CO))
219 (gut)
Wie ist das O3-Niveau heute in Luogangzhen? (Ozon (O3))
0 (gut)
Wie hoch ist das NO2-Niveau? (Stickstoffdioxid (NO2))
7 (gut)
Wie hoch ist der PM10-Stand heute in Luogangzhen? (Feinstaub (PM10) Schwebestaub)
Der aktuelle Feinstaubgehalt PM10 in Luogangzhen is:
36 (Moderate)
Die höchsten PM10-Werte treten in der Regel im Monat auf: 113 (Januar 2019).
Der niedrigste Wert der Feinstaub-PM10-Belastung in Luogangzhen ist in der Regel in: Februar (40).
Wie hoch ist die SO2-Belastung? (Schwefeldioxid (SO2))
8 (gut)
Aktuelle Daten Freitag, 27. Mai 2022, 15:00
PM2,5 22 (Moderate)
CO 219 (gut)
O3 0 (gut)
NO2 7 (gut)
PM10 36 (Moderate)
SO2 8 (gut)
Daten zur Luftverschmutzung der letzten Tage in Luogangzhen
index
2022-05-27
pm25
23
Moderate
co
475
Good
o3
25
Good
no2
21
Good
pm10
32
Moderate
so2
4
Good
data source »
Luftverschmutzung in Luogangzhen von Oktober 2018 bis Mai 2020
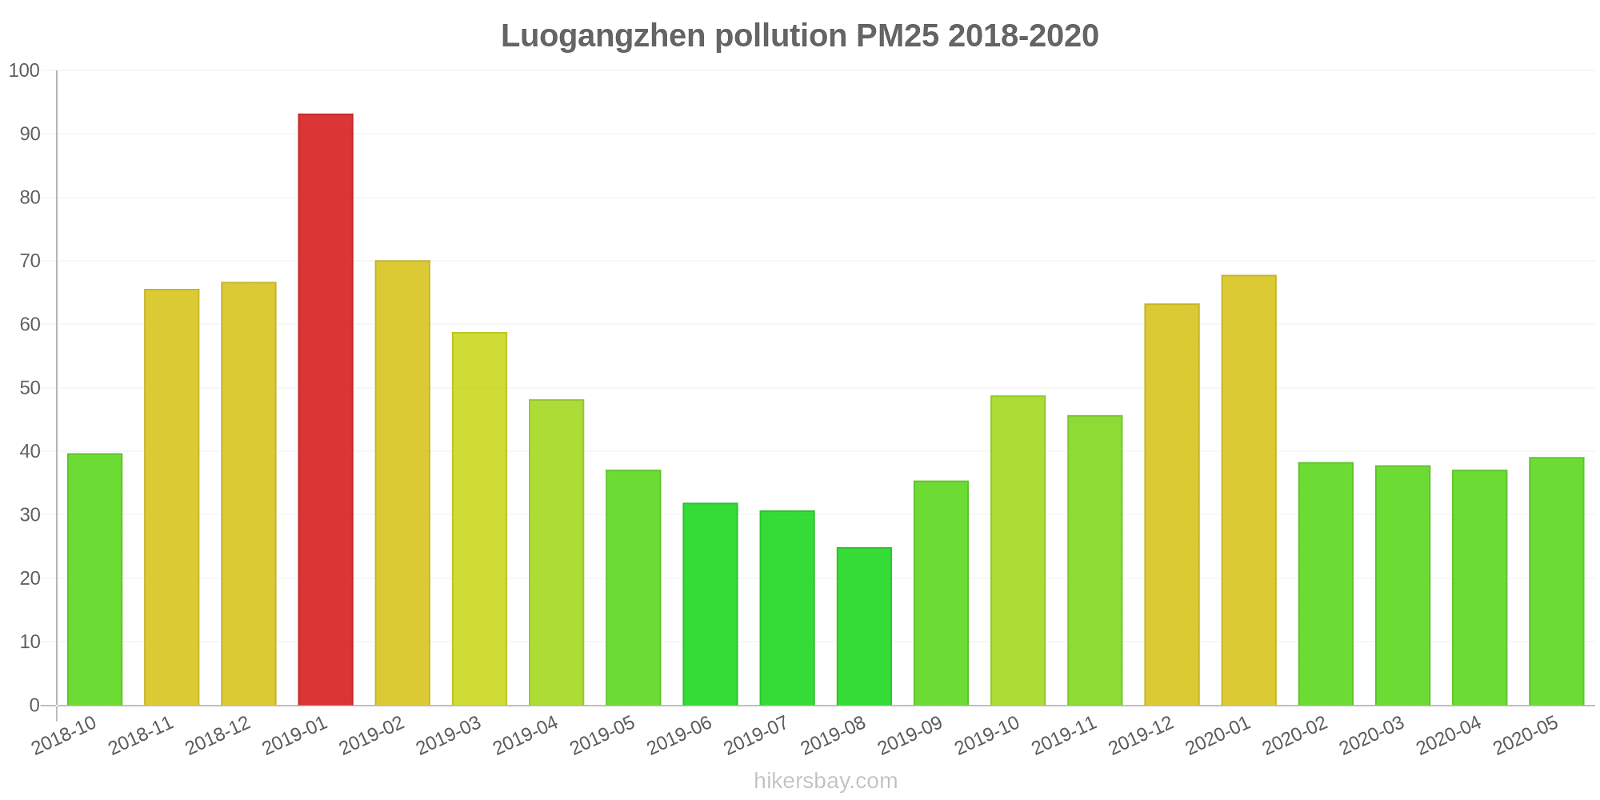
index
2020-05
2020-04
2020-03
2020-02
2020-01
2019-12
2019-11
2019-10
2019-09
2019-08
2019-07
2019-06
2019-05
2019-04
2019-03
2019-02
2019-01
2018-12
2018-11
2018-10
pm25
39 (Unhealthy for Sensitive Groups)
37 (Unhealthy for Sensitive Groups)
38 (Unhealthy for Sensitive Groups)
38 (Unhealthy for Sensitive Groups)
68 (Unhealthy)
63 (Unhealthy)
46 (Unhealthy for Sensitive Groups)
49 (Unhealthy for Sensitive Groups)
35 (Unhealthy for Sensitive Groups)
25 (Moderate)
31 (Moderate)
32 (Moderate)
37 (Unhealthy for Sensitive Groups)
48 (Unhealthy for Sensitive Groups)
59 (Unhealthy)
70 (Unhealthy)
93 (Very Unhealthy)
67 (Unhealthy)
66 (Unhealthy)
40 (Unhealthy for Sensitive Groups)
co
502 (Good)
545 (Good)
563 (Good)
602 (Good)
923 (Good)
965 (Good)
667 (Good)
693 (Good)
744 (Good)
582 (Good)
591 (Good)
621 (Good)
562 (Good)
755 (Good)
777 (Good)
829 (Good)
1 (Good)
835 (Good)
1 (Good)
713 (Good)
no2
40 (Moderate)
61 (Moderate)
47 (Moderate)
31 (Good)
48 (Moderate)
63 (Moderate)
63 (Moderate)
60 (Moderate)
53 (Moderate)
38 (Good)
32 (Good)
33 (Good)
48 (Moderate)
50 (Moderate)
58 (Moderate)
45 (Moderate)
62 (Moderate)
53 (Moderate)
64 (Moderate)
63 (Moderate)
o3
115 (Moderate)
105 (Moderate)
88 (Moderate)
75 (Moderate)
45 (Good)
54 (Good)
86 (Moderate)
102 (Moderate)
146 (Unhealthy for Sensitive Groups)
147 (Unhealthy for Sensitive Groups)
148 (Unhealthy for Sensitive Groups)
171 (Unhealthy)
158 (Unhealthy)
124 (Unhealthy for Sensitive Groups)
110 (Moderate)
74 (Moderate)
63 (Good)
53 (Good)
90 (Moderate)
107 (Moderate)
pm10
61 (Unhealthy for Sensitive Groups)
82 (Unhealthy)
64 (Unhealthy for Sensitive Groups)
40 (Moderate)
62 (Unhealthy for Sensitive Groups)
79 (Unhealthy for Sensitive Groups)
93 (Unhealthy)
99 (Unhealthy)
79 (Unhealthy for Sensitive Groups)
59 (Unhealthy for Sensitive Groups)
58 (Unhealthy for Sensitive Groups)
52 (Unhealthy for Sensitive Groups)
80 (Unhealthy for Sensitive Groups)
81 (Unhealthy)
101 (Unhealthy)
86 (Unhealthy)
113 (Very Unhealthy)
81 (Unhealthy)
86 (Unhealthy)
78 (Unhealthy for Sensitive Groups)
so2
5.7 (Good)
9.9 (Good)
8.6 (Good)
5.2 (Good)
5.7 (Good)
9.4 (Good)
9.2 (Good)
7.4 (Good)
6 (Good)
3.9 (Good)
3.1 (Good)
4 (Good)
5.6 (Good)
6.3 (Good)
6.8 (Good)
4.3 (Good)
8.1 (Good)
7.6 (Good)
7.7 (Good)
7.4 (Good)
data source »
Hefei Bao He Qu
Freitag, 27. Mai 2022, 15:00
PM2,5 22 (Moderate)
Feinstaub (PM2,5)
CO 219 (gut)
Kohlenmonoxid (CO)
O3 0.05 (gut)
Ozon (O3)
NO2 7 (gut)
Stickstoffdioxid (NO2)
PM10 36 (Moderate)
Feinstaub (PM10) Schwebestaub
SO2 7.7 (gut)
Schwefeldioxid (SO2)
Hefei Bao He Qu
index
2022-05-27
pm25
23
co
475
o3
25
no2
21
pm10
32
so2
4.4
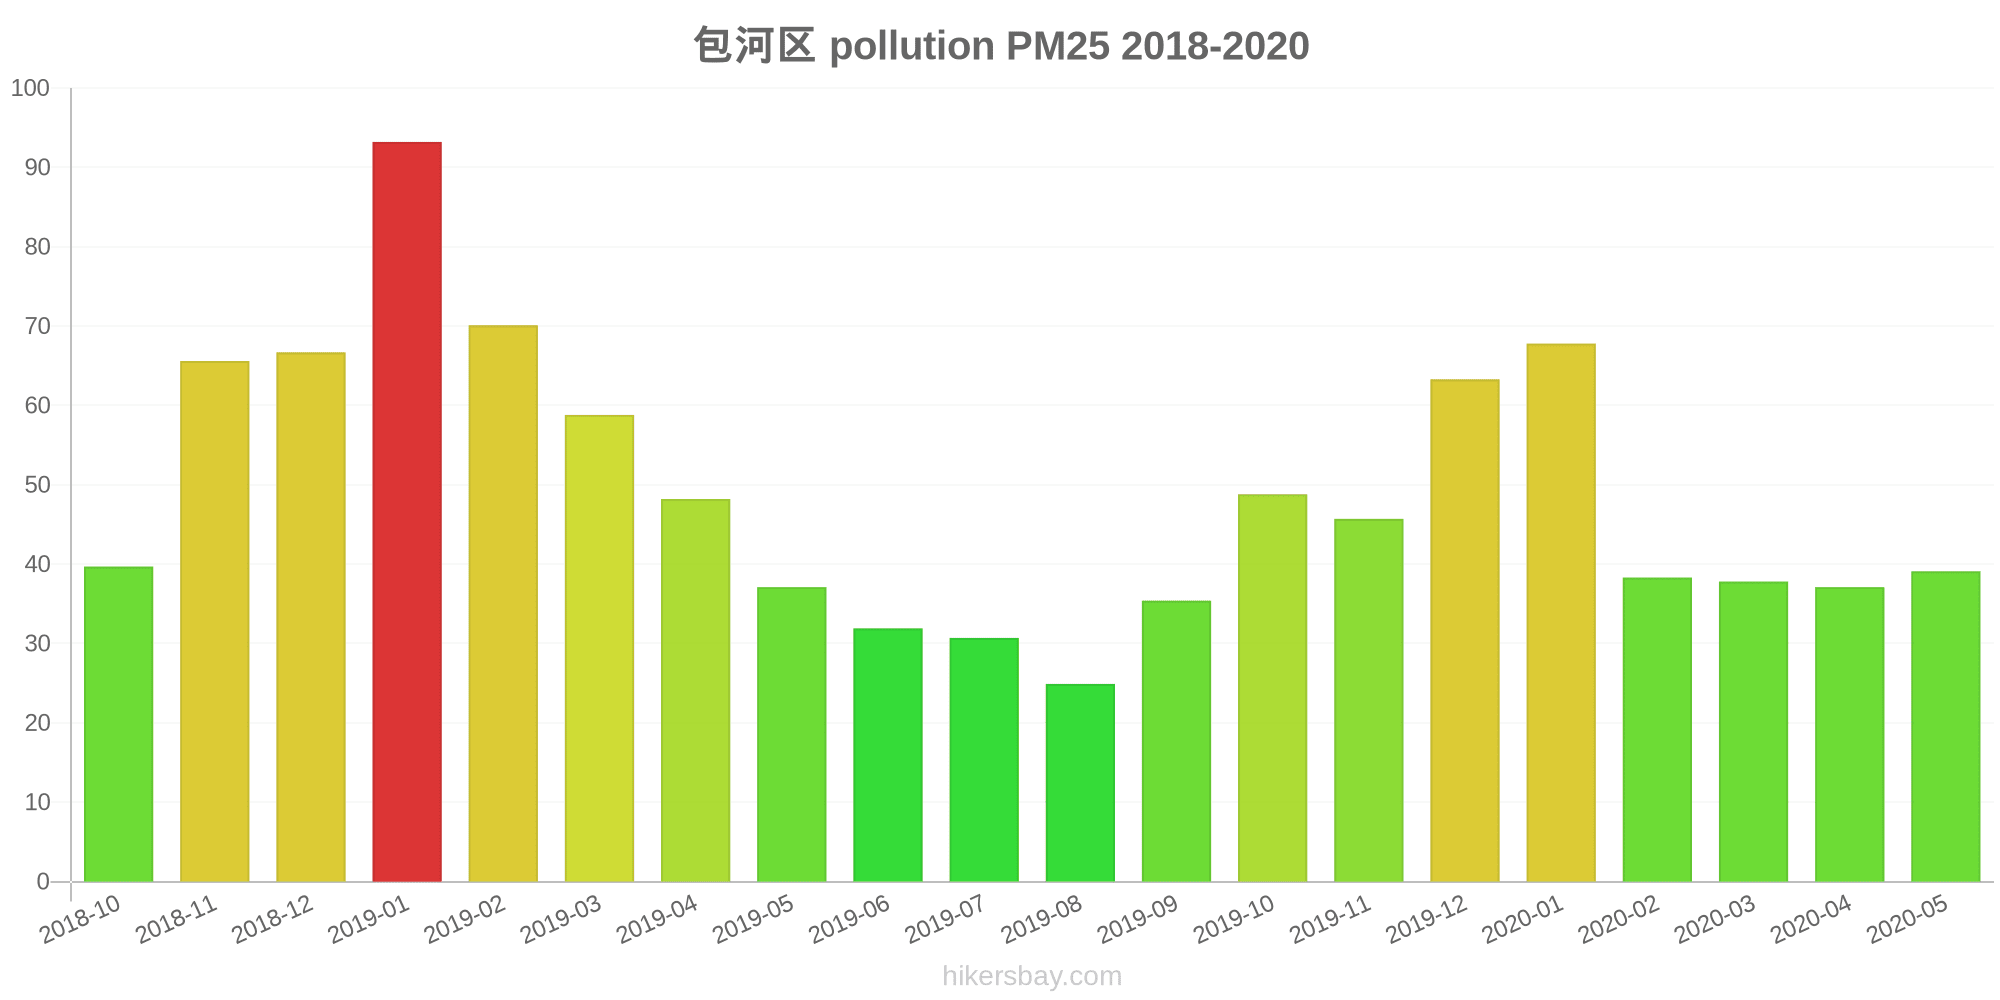
包河区
2018-10 2020-05

index
2020-05
2020-04
2020-03
2020-02
2020-01
2019-12
2019-11
2019-10
2019-09
2019-08
2019-07
2019-06
2019-05
2019-04
2019-03
2019-02
2019-01
2018-12
2018-11
2018-10
pm25
39
37
38
38
68
63
46
49
35
25
31
32
37
48
59
70
93
67
66
40
co
502
545
563
602
923
965
667
693
744
582
591
621
562
755
777
829
1
835
1
713
no2
40
61
47
31
48
63
63
60
53
38
32
33
48
50
58
45
62
53
64
63
o3
115
105
88
75
45
54
86
102
146
147
148
171
158
124
110
74
63
53
90
107
pm10
61
82
64
40
62
79
93
99
79
59
58
52
80
81
101
86
113
81
86
78
so2
5.7
9.9
8.6
5.2
5.7
9.4
9.2
7.4
6
3.9
3.1
4
5.6
6.3
6.8
4.3
8.1
7.6
7.7
7.4
* Pollution data source:
https://openaq.org
(ChinaAQIData)
The data is licensed under CC-By 4.0
PM2,5 22 (Moderate)
CO 219 (gut)
O3 0 (gut)
NO2 7 (gut)
PM10 36 (Moderate)
SO2 8 (gut)
Daten zur Luftverschmutzung der letzten Tage in Luogangzhen
| index | 2022-05-27 |
|---|---|
| pm25 | 23 Moderate |
| co | 475 Good |
| o3 | 25 Good |
| no2 | 21 Good |
| pm10 | 32 Moderate |
| so2 | 4 Good |

| index | 2020-05 | 2020-04 | 2020-03 | 2020-02 | 2020-01 | 2019-12 | 2019-11 | 2019-10 | 2019-09 | 2019-08 | 2019-07 | 2019-06 | 2019-05 | 2019-04 | 2019-03 | 2019-02 | 2019-01 | 2018-12 | 2018-11 | 2018-10 |
|---|---|---|---|---|---|---|---|---|---|---|---|---|---|---|---|---|---|---|---|---|
| pm25 | 39 (Unhealthy for Sensitive Groups) | 37 (Unhealthy for Sensitive Groups) | 38 (Unhealthy for Sensitive Groups) | 38 (Unhealthy for Sensitive Groups) | 68 (Unhealthy) | 63 (Unhealthy) | 46 (Unhealthy for Sensitive Groups) | 49 (Unhealthy for Sensitive Groups) | 35 (Unhealthy for Sensitive Groups) | 25 (Moderate) | 31 (Moderate) | 32 (Moderate) | 37 (Unhealthy for Sensitive Groups) | 48 (Unhealthy for Sensitive Groups) | 59 (Unhealthy) | 70 (Unhealthy) | 93 (Very Unhealthy) | 67 (Unhealthy) | 66 (Unhealthy) | 40 (Unhealthy for Sensitive Groups) |
| co | 502 (Good) | 545 (Good) | 563 (Good) | 602 (Good) | 923 (Good) | 965 (Good) | 667 (Good) | 693 (Good) | 744 (Good) | 582 (Good) | 591 (Good) | 621 (Good) | 562 (Good) | 755 (Good) | 777 (Good) | 829 (Good) | 1 (Good) | 835 (Good) | 1 (Good) | 713 (Good) |
| no2 | 40 (Moderate) | 61 (Moderate) | 47 (Moderate) | 31 (Good) | 48 (Moderate) | 63 (Moderate) | 63 (Moderate) | 60 (Moderate) | 53 (Moderate) | 38 (Good) | 32 (Good) | 33 (Good) | 48 (Moderate) | 50 (Moderate) | 58 (Moderate) | 45 (Moderate) | 62 (Moderate) | 53 (Moderate) | 64 (Moderate) | 63 (Moderate) |
| o3 | 115 (Moderate) | 105 (Moderate) | 88 (Moderate) | 75 (Moderate) | 45 (Good) | 54 (Good) | 86 (Moderate) | 102 (Moderate) | 146 (Unhealthy for Sensitive Groups) | 147 (Unhealthy for Sensitive Groups) | 148 (Unhealthy for Sensitive Groups) | 171 (Unhealthy) | 158 (Unhealthy) | 124 (Unhealthy for Sensitive Groups) | 110 (Moderate) | 74 (Moderate) | 63 (Good) | 53 (Good) | 90 (Moderate) | 107 (Moderate) |
| pm10 | 61 (Unhealthy for Sensitive Groups) | 82 (Unhealthy) | 64 (Unhealthy for Sensitive Groups) | 40 (Moderate) | 62 (Unhealthy for Sensitive Groups) | 79 (Unhealthy for Sensitive Groups) | 93 (Unhealthy) | 99 (Unhealthy) | 79 (Unhealthy for Sensitive Groups) | 59 (Unhealthy for Sensitive Groups) | 58 (Unhealthy for Sensitive Groups) | 52 (Unhealthy for Sensitive Groups) | 80 (Unhealthy for Sensitive Groups) | 81 (Unhealthy) | 101 (Unhealthy) | 86 (Unhealthy) | 113 (Very Unhealthy) | 81 (Unhealthy) | 86 (Unhealthy) | 78 (Unhealthy for Sensitive Groups) |
| so2 | 5.7 (Good) | 9.9 (Good) | 8.6 (Good) | 5.2 (Good) | 5.7 (Good) | 9.4 (Good) | 9.2 (Good) | 7.4 (Good) | 6 (Good) | 3.9 (Good) | 3.1 (Good) | 4 (Good) | 5.6 (Good) | 6.3 (Good) | 6.8 (Good) | 4.3 (Good) | 8.1 (Good) | 7.6 (Good) | 7.7 (Good) | 7.4 (Good) |
PM2,5 22 (Moderate)
Feinstaub (PM2,5)CO 219 (gut)
Kohlenmonoxid (CO)O3 0.05 (gut)
Ozon (O3)NO2 7 (gut)
Stickstoffdioxid (NO2)PM10 36 (Moderate)
Feinstaub (PM10) SchwebestaubSO2 7.7 (gut)
Schwefeldioxid (SO2)Hefei Bao He Qu
| index | 2022-05-27 |
|---|---|
| pm25 | 23 |
| co | 475 |
| o3 | 25 |
| no2 | 21 |
| pm10 | 32 |
| so2 | 4.4 |
包河区
| index | 2020-05 | 2020-04 | 2020-03 | 2020-02 | 2020-01 | 2019-12 | 2019-11 | 2019-10 | 2019-09 | 2019-08 | 2019-07 | 2019-06 | 2019-05 | 2019-04 | 2019-03 | 2019-02 | 2019-01 | 2018-12 | 2018-11 | 2018-10 |
|---|---|---|---|---|---|---|---|---|---|---|---|---|---|---|---|---|---|---|---|---|
| pm25 | 39 | 37 | 38 | 38 | 68 | 63 | 46 | 49 | 35 | 25 | 31 | 32 | 37 | 48 | 59 | 70 | 93 | 67 | 66 | 40 |
| co | 502 | 545 | 563 | 602 | 923 | 965 | 667 | 693 | 744 | 582 | 591 | 621 | 562 | 755 | 777 | 829 | 1 | 835 | 1 | 713 |
| no2 | 40 | 61 | 47 | 31 | 48 | 63 | 63 | 60 | 53 | 38 | 32 | 33 | 48 | 50 | 58 | 45 | 62 | 53 | 64 | 63 |
| o3 | 115 | 105 | 88 | 75 | 45 | 54 | 86 | 102 | 146 | 147 | 148 | 171 | 158 | 124 | 110 | 74 | 63 | 53 | 90 | 107 |
| pm10 | 61 | 82 | 64 | 40 | 62 | 79 | 93 | 99 | 79 | 59 | 58 | 52 | 80 | 81 | 101 | 86 | 113 | 81 | 86 | 78 |
| so2 | 5.7 | 9.9 | 8.6 | 5.2 | 5.7 | 9.4 | 9.2 | 7.4 | 6 | 3.9 | 3.1 | 4 | 5.6 | 6.3 | 6.8 | 4.3 | 8.1 | 7.6 | 7.7 | 7.4 |