Luftverschmutzung in Zhumadian: Echtzeit-Luft-Qualitätsindex und Smog-Alarm.
Für die Zhumadian. Heute ist Donnerstag, 4. Juni 2026. Für Zhumadian wurden folgende Luftverschmutzungswerte gemessen:- Feinstaub (PM2,5) - 22 (Moderate)
- Kohlenmonoxid (CO) - 219 (gut)
- Ozon (O3) - 0 (gut)
- Stickstoffdioxid (NO2) - 7 (gut)
- Feinstaub (PM10) Schwebestaub - 36 (Moderate)
- Schwefeldioxid (SO2) - 8 (gut)

Wie ist die Luftqualität Zhumadian heute? Ist die Luft in Zhumadian? verschmutzt. Gibt es Smog?
Wie hoch ist der aktuelle PM2,5-Wert in Zhumadian? (Feinstaub (PM2,5))
Die heutige PM2.5-Stufe ist:
22 (Moderate)
Zum Vergleich: Der höchste PM2,5-Wert in Zhumadian in den letzten 7 Tagen war: 23 (Freitag, 27. Mai 2022) und der niedrigste: 23 (Freitag, 27. Mai 2022).
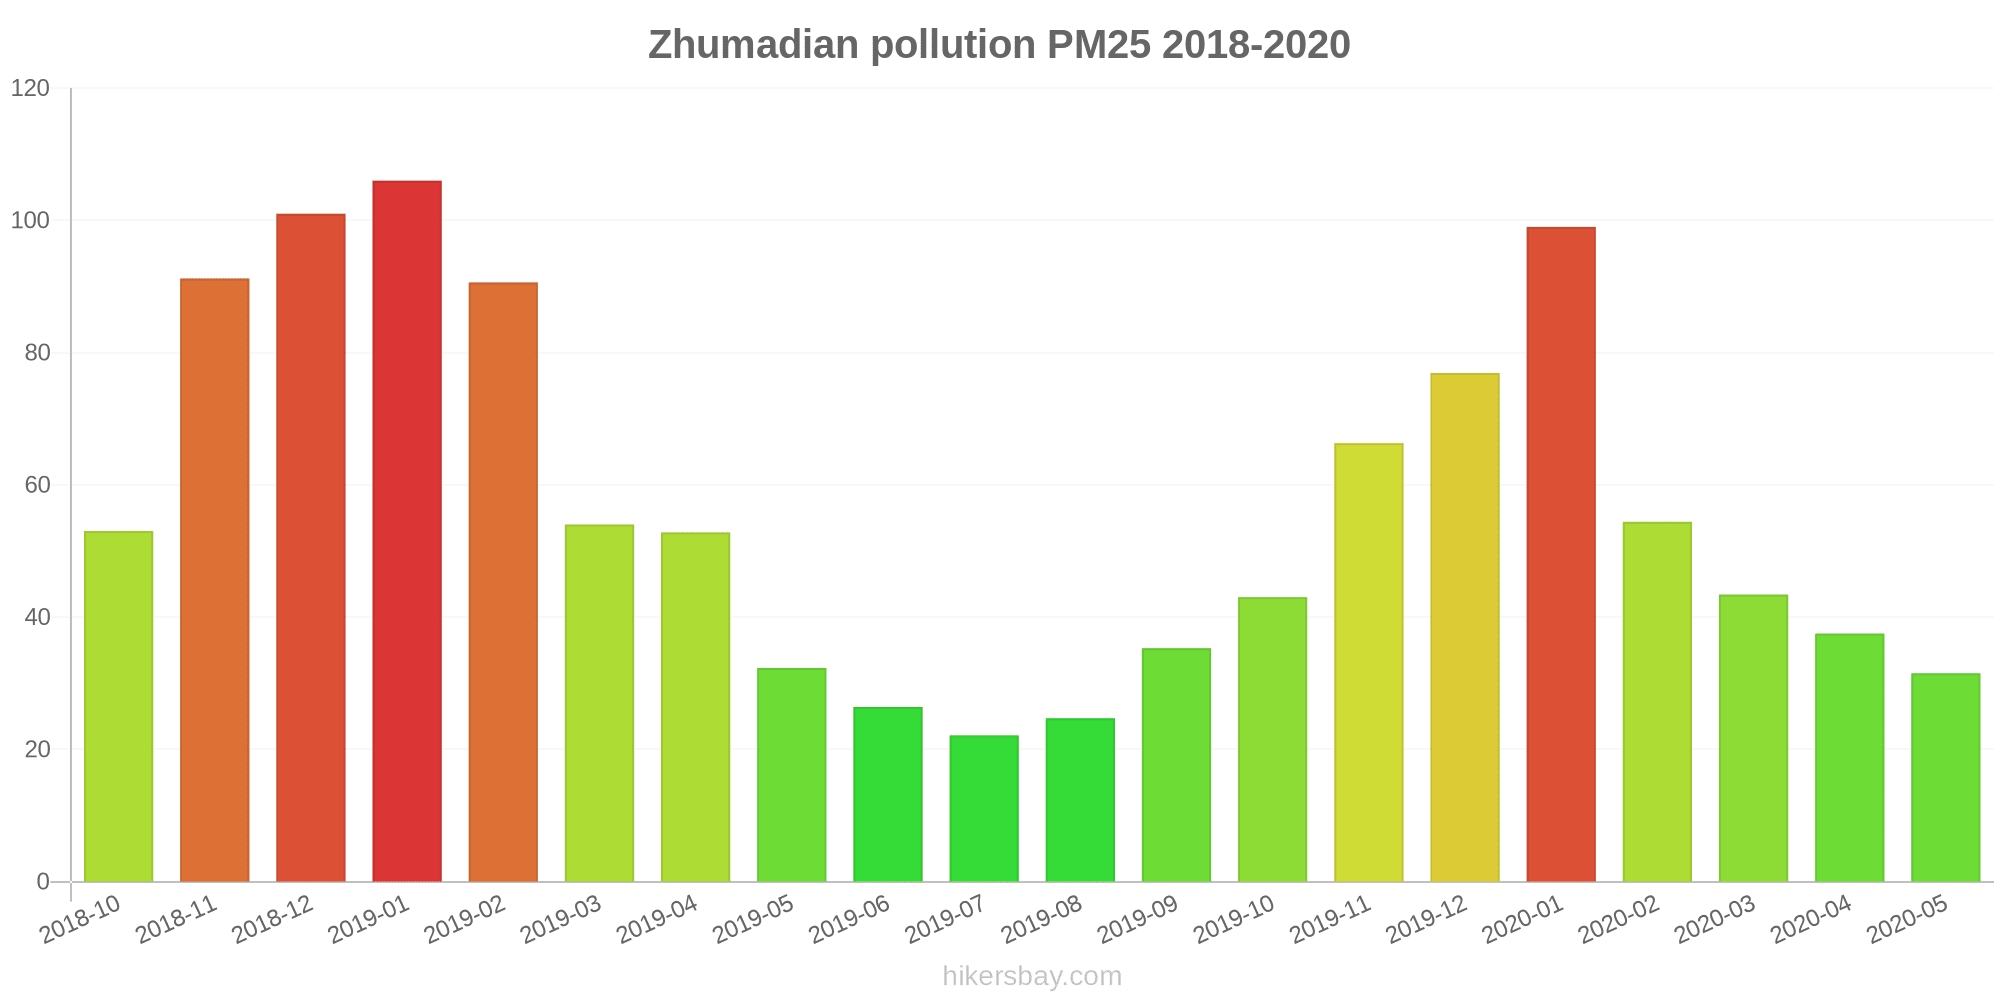
Die höchsten PM2,5-Werte wurden gemessen: 106 (Januar 2019).
Die niedrigste Feinstaubbelastung PM2,5 tritt im Monat auf: Juli (22).
Wie hoch ist der CO-Gehalt? (Kohlenmonoxid (CO))
219 (gut)
Wie ist das O3-Niveau heute in Zhumadian? (Ozon (O3))
0 (gut)
Wie hoch ist das NO2-Niveau? (Stickstoffdioxid (NO2))
7 (gut)
Wie hoch ist der PM10-Stand heute in Zhumadian? (Feinstaub (PM10) Schwebestaub)
Der aktuelle Feinstaubgehalt PM10 in Zhumadian is:
36 (Moderate)
Die höchsten PM10-Werte treten in der Regel im Monat auf: 161 (Dezember 2018).
Der niedrigste Wert der Feinstaub-PM10-Belastung in Zhumadian ist in der Regel in: August (42).
Wie hoch ist die SO2-Belastung? (Schwefeldioxid (SO2))
8 (gut)
Aktuelle Daten Freitag, 27. Mai 2022, 15:00
PM2,5 22 (Moderate)
CO 219 (gut)
O3 0 (gut)
NO2 7 (gut)
PM10 36 (Moderate)
SO2 8 (gut)
Daten zur Luftverschmutzung der letzten Tage in Zhumadian
index
2022-05-27
pm25
23
Moderate
co
475
Good
o3
25
Good
no2
21
Good
pm10
32
Moderate
so2
4
Good
data source »
Luftverschmutzung in Zhumadian von Oktober 2018 bis Mai 2020

index
2020-05
2020-04
2020-03
2020-02
2020-01
2019-12
2019-11
2019-10
2019-09
2019-08
2019-07
2019-06
2019-05
2019-04
2019-03
2019-02
2019-01
2018-12
2018-11
2018-10
pm25
32 (Moderate)
38 (Unhealthy for Sensitive Groups)
43 (Unhealthy for Sensitive Groups)
54 (Unhealthy for Sensitive Groups)
99 (Very Unhealthy)
77 (Very Unhealthy)
66 (Unhealthy)
43 (Unhealthy for Sensitive Groups)
35 (Unhealthy for Sensitive Groups)
25 (Moderate)
22 (Moderate)
26 (Moderate)
32 (Moderate)
53 (Unhealthy for Sensitive Groups)
54 (Unhealthy for Sensitive Groups)
91 (Very Unhealthy)
106 (Very Unhealthy)
101 (Very Unhealthy)
91 (Very Unhealthy)
53 (Unhealthy for Sensitive Groups)
co
551 (Good)
666 (Good)
661 (Good)
795 (Good)
1 (Good)
866 (Good)
717 (Good)
631 (Good)
698 (Good)
705 (Good)
568 (Good)
592 (Good)
437 (Good)
675 (Good)
567 (Good)
838 (Good)
1 (Good)
1 (Good)
905 (Good)
559 (Good)
no2
17 (Good)
29 (Good)
22 (Good)
15 (Good)
33 (Good)
44 (Moderate)
41 (Moderate)
33 (Good)
26 (Good)
19 (Good)
27 (Good)
24 (Good)
24 (Good)
23 (Good)
32 (Good)
23 (Good)
41 (Moderate)
42 (Moderate)
46 (Moderate)
41 (Moderate)
o3
137 (Unhealthy for Sensitive Groups)
135 (Unhealthy for Sensitive Groups)
110 (Moderate)
94 (Moderate)
76 (Moderate)
63 (Good)
98 (Moderate)
111 (Moderate)
160 (Unhealthy)
147 (Unhealthy for Sensitive Groups)
158 (Unhealthy)
181 (Very Unhealthy)
152 (Unhealthy)
132 (Unhealthy for Sensitive Groups)
122 (Unhealthy for Sensitive Groups)
90 (Moderate)
70 (Moderate)
49 (Good)
97 (Moderate)
128 (Unhealthy for Sensitive Groups)
pm10
63 (Unhealthy for Sensitive Groups)
76 (Unhealthy for Sensitive Groups)
81 (Unhealthy)
75 (Unhealthy for Sensitive Groups)
129 (Very Unhealthy)
113 (Very Unhealthy)
117 (Very Unhealthy)
82 (Unhealthy)
73 (Unhealthy for Sensitive Groups)
42 (Moderate)
51 (Unhealthy for Sensitive Groups)
64 (Unhealthy for Sensitive Groups)
84 (Unhealthy)
92 (Unhealthy)
105 (Unhealthy)
125 (Very Unhealthy)
159 (Very bad Hazardous)
161 (Very bad Hazardous)
142 (Very Unhealthy)
92 (Unhealthy)
so2
8.5 (Good)
8.3 (Good)
6.4 (Good)
3.8 (Good)
5.4 (Good)
8.5 (Good)
9.7 (Good)
6.7 (Good)
7.9 (Good)
5.9 (Good)
6.4 (Good)
7.9 (Good)
7.8 (Good)
8.1 (Good)
9.6 (Good)
5.8 (Good)
7.9 (Good)
10 (Good)
10 (Good)
17 (Good)
data source »
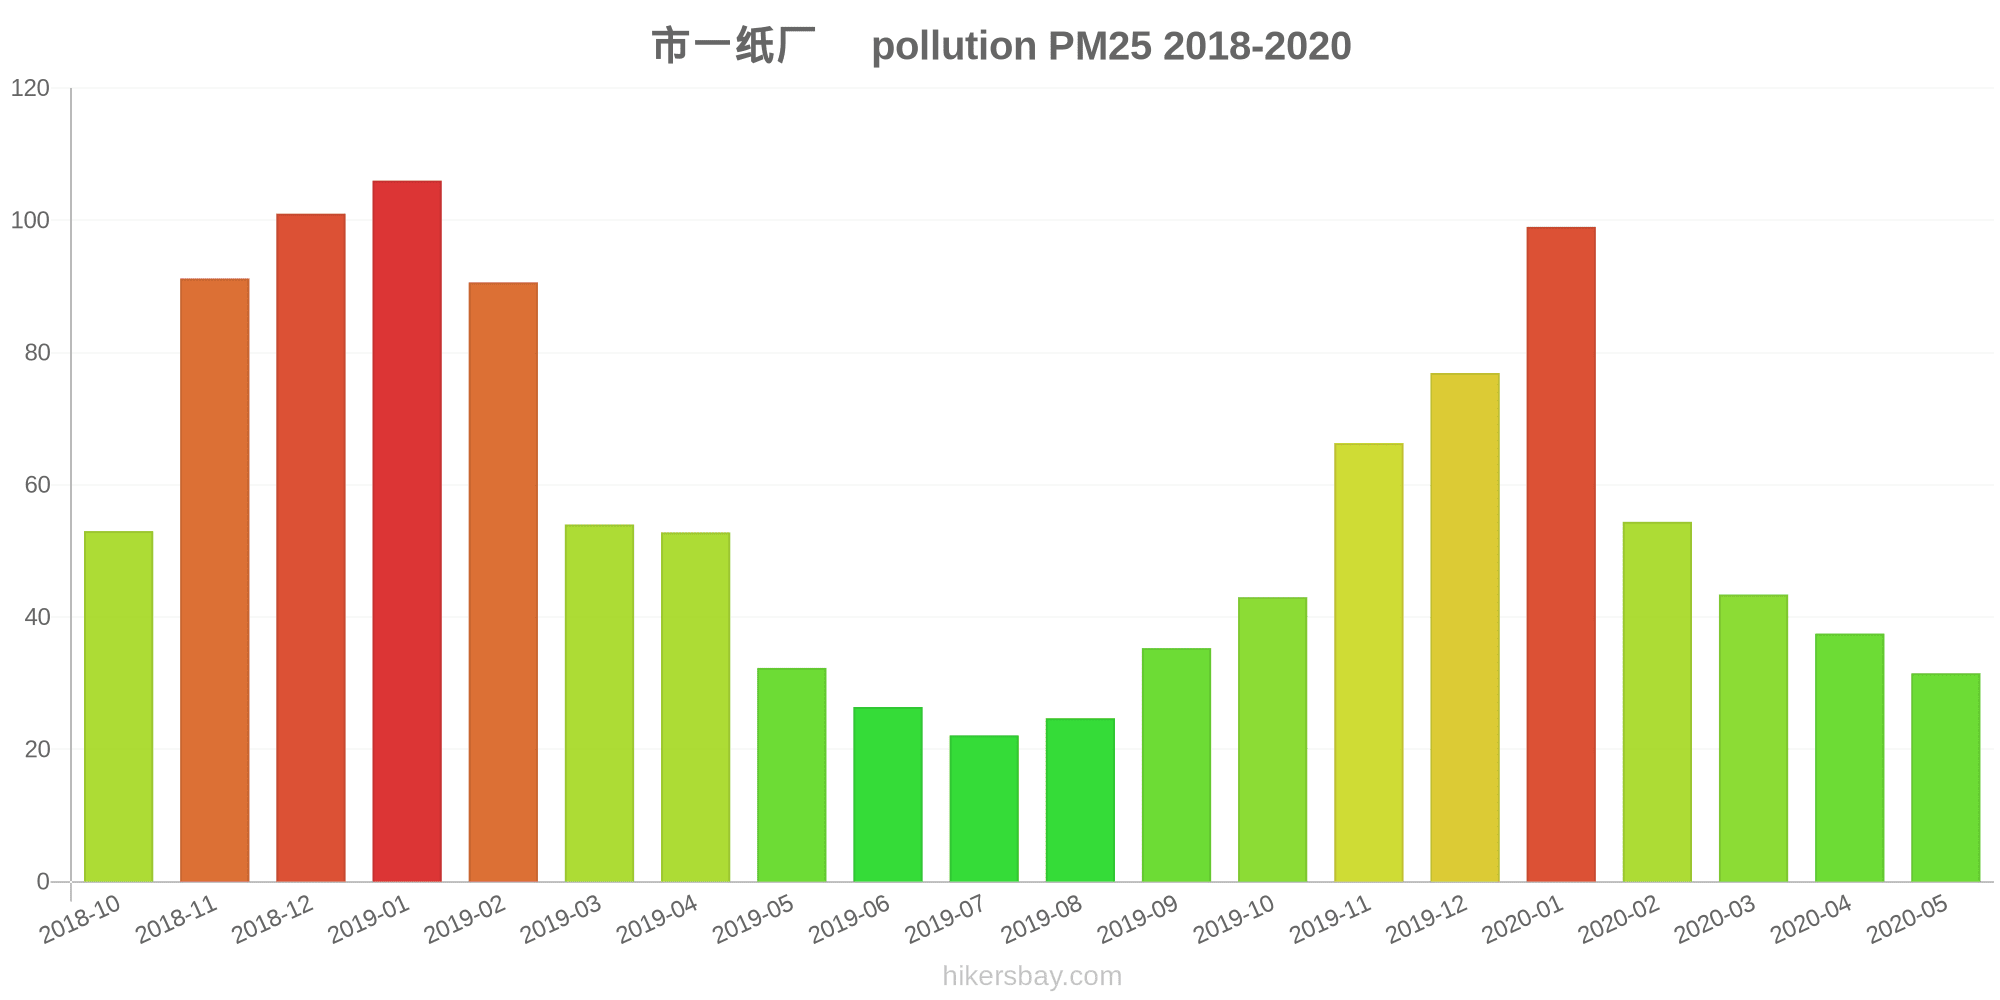
市一纸厂
Freitag, 27. Mai 2022, 15:00
PM2,5 22 (Moderate)
Feinstaub (PM2,5)
CO 219 (gut)
Kohlenmonoxid (CO)
O3 0.05 (gut)
Ozon (O3)
NO2 7 (gut)
Stickstoffdioxid (NO2)
PM10 36 (Moderate)
Feinstaub (PM10) Schwebestaub
SO2 7.7 (gut)
Schwefeldioxid (SO2)
市一纸厂
index
2022-05-27
pm25
23
co
475
o3
25
no2
21
pm10
32
so2
4.4
市一纸厂
2018-10 2020-05

index
2020-05
2020-04
2020-03
2020-02
2020-01
2019-12
2019-11
2019-10
2019-09
2019-08
2019-07
2019-06
2019-05
2019-04
2019-03
2019-02
2019-01
2018-12
2018-11
2018-10
pm25
32
38
43
54
99
77
66
43
35
25
22
26
32
53
54
91
106
101
91
53
co
551
666
661
795
1
866
717
631
698
705
568
592
437
675
567
838
1
1
905
559
no2
17
29
22
15
33
44
41
33
26
19
27
24
24
23
32
23
41
42
46
41
o3
137
135
110
94
76
63
98
111
160
147
158
181
152
132
122
90
70
49
97
128
pm10
63
76
81
75
129
113
117
82
73
42
51
64
84
92
105
125
159
161
142
92
so2
8.5
8.3
6.4
3.8
5.4
8.5
9.7
6.7
7.9
5.9
6.4
7.9
7.8
8.1
9.6
5.8
7.9
10
10
17
* Pollution data source:
https://openaq.org
(ChinaAQIData)
The data is licensed under CC-By 4.0
PM2,5 22 (Moderate)
CO 219 (gut)
O3 0 (gut)
NO2 7 (gut)
PM10 36 (Moderate)
SO2 8 (gut)
Daten zur Luftverschmutzung der letzten Tage in Zhumadian
| index | 2022-05-27 |
|---|---|
| pm25 | 23 Moderate |
| co | 475 Good |
| o3 | 25 Good |
| no2 | 21 Good |
| pm10 | 32 Moderate |
| so2 | 4 Good |
| index | 2020-05 | 2020-04 | 2020-03 | 2020-02 | 2020-01 | 2019-12 | 2019-11 | 2019-10 | 2019-09 | 2019-08 | 2019-07 | 2019-06 | 2019-05 | 2019-04 | 2019-03 | 2019-02 | 2019-01 | 2018-12 | 2018-11 | 2018-10 |
|---|---|---|---|---|---|---|---|---|---|---|---|---|---|---|---|---|---|---|---|---|
| pm25 | 32 (Moderate) | 38 (Unhealthy for Sensitive Groups) | 43 (Unhealthy for Sensitive Groups) | 54 (Unhealthy for Sensitive Groups) | 99 (Very Unhealthy) | 77 (Very Unhealthy) | 66 (Unhealthy) | 43 (Unhealthy for Sensitive Groups) | 35 (Unhealthy for Sensitive Groups) | 25 (Moderate) | 22 (Moderate) | 26 (Moderate) | 32 (Moderate) | 53 (Unhealthy for Sensitive Groups) | 54 (Unhealthy for Sensitive Groups) | 91 (Very Unhealthy) | 106 (Very Unhealthy) | 101 (Very Unhealthy) | 91 (Very Unhealthy) | 53 (Unhealthy for Sensitive Groups) |
| co | 551 (Good) | 666 (Good) | 661 (Good) | 795 (Good) | 1 (Good) | 866 (Good) | 717 (Good) | 631 (Good) | 698 (Good) | 705 (Good) | 568 (Good) | 592 (Good) | 437 (Good) | 675 (Good) | 567 (Good) | 838 (Good) | 1 (Good) | 1 (Good) | 905 (Good) | 559 (Good) |
| no2 | 17 (Good) | 29 (Good) | 22 (Good) | 15 (Good) | 33 (Good) | 44 (Moderate) | 41 (Moderate) | 33 (Good) | 26 (Good) | 19 (Good) | 27 (Good) | 24 (Good) | 24 (Good) | 23 (Good) | 32 (Good) | 23 (Good) | 41 (Moderate) | 42 (Moderate) | 46 (Moderate) | 41 (Moderate) |
| o3 | 137 (Unhealthy for Sensitive Groups) | 135 (Unhealthy for Sensitive Groups) | 110 (Moderate) | 94 (Moderate) | 76 (Moderate) | 63 (Good) | 98 (Moderate) | 111 (Moderate) | 160 (Unhealthy) | 147 (Unhealthy for Sensitive Groups) | 158 (Unhealthy) | 181 (Very Unhealthy) | 152 (Unhealthy) | 132 (Unhealthy for Sensitive Groups) | 122 (Unhealthy for Sensitive Groups) | 90 (Moderate) | 70 (Moderate) | 49 (Good) | 97 (Moderate) | 128 (Unhealthy for Sensitive Groups) |
| pm10 | 63 (Unhealthy for Sensitive Groups) | 76 (Unhealthy for Sensitive Groups) | 81 (Unhealthy) | 75 (Unhealthy for Sensitive Groups) | 129 (Very Unhealthy) | 113 (Very Unhealthy) | 117 (Very Unhealthy) | 82 (Unhealthy) | 73 (Unhealthy for Sensitive Groups) | 42 (Moderate) | 51 (Unhealthy for Sensitive Groups) | 64 (Unhealthy for Sensitive Groups) | 84 (Unhealthy) | 92 (Unhealthy) | 105 (Unhealthy) | 125 (Very Unhealthy) | 159 (Very bad Hazardous) | 161 (Very bad Hazardous) | 142 (Very Unhealthy) | 92 (Unhealthy) |
| so2 | 8.5 (Good) | 8.3 (Good) | 6.4 (Good) | 3.8 (Good) | 5.4 (Good) | 8.5 (Good) | 9.7 (Good) | 6.7 (Good) | 7.9 (Good) | 5.9 (Good) | 6.4 (Good) | 7.9 (Good) | 7.8 (Good) | 8.1 (Good) | 9.6 (Good) | 5.8 (Good) | 7.9 (Good) | 10 (Good) | 10 (Good) | 17 (Good) |
PM2,5 22 (Moderate)
Feinstaub (PM2,5)CO 219 (gut)
Kohlenmonoxid (CO)O3 0.05 (gut)
Ozon (O3)NO2 7 (gut)
Stickstoffdioxid (NO2)PM10 36 (Moderate)
Feinstaub (PM10) SchwebestaubSO2 7.7 (gut)
Schwefeldioxid (SO2)市一纸厂
| index | 2022-05-27 |
|---|---|
| pm25 | 23 |
| co | 475 |
| o3 | 25 |
| no2 | 21 |
| pm10 | 32 |
| so2 | 4.4 |
市一纸厂
| index | 2020-05 | 2020-04 | 2020-03 | 2020-02 | 2020-01 | 2019-12 | 2019-11 | 2019-10 | 2019-09 | 2019-08 | 2019-07 | 2019-06 | 2019-05 | 2019-04 | 2019-03 | 2019-02 | 2019-01 | 2018-12 | 2018-11 | 2018-10 |
|---|---|---|---|---|---|---|---|---|---|---|---|---|---|---|---|---|---|---|---|---|
| pm25 | 32 | 38 | 43 | 54 | 99 | 77 | 66 | 43 | 35 | 25 | 22 | 26 | 32 | 53 | 54 | 91 | 106 | 101 | 91 | 53 |
| co | 551 | 666 | 661 | 795 | 1 | 866 | 717 | 631 | 698 | 705 | 568 | 592 | 437 | 675 | 567 | 838 | 1 | 1 | 905 | 559 |
| no2 | 17 | 29 | 22 | 15 | 33 | 44 | 41 | 33 | 26 | 19 | 27 | 24 | 24 | 23 | 32 | 23 | 41 | 42 | 46 | 41 |
| o3 | 137 | 135 | 110 | 94 | 76 | 63 | 98 | 111 | 160 | 147 | 158 | 181 | 152 | 132 | 122 | 90 | 70 | 49 | 97 | 128 |
| pm10 | 63 | 76 | 81 | 75 | 129 | 113 | 117 | 82 | 73 | 42 | 51 | 64 | 84 | 92 | 105 | 125 | 159 | 161 | 142 | 92 |
| so2 | 8.5 | 8.3 | 6.4 | 3.8 | 5.4 | 8.5 | 9.7 | 6.7 | 7.9 | 5.9 | 6.4 | 7.9 | 7.8 | 8.1 | 9.6 | 5.8 | 7.9 | 10 | 10 | 17 |