Luftverschmutzung in Zhoukou: Echtzeit-Luft-Qualitätsindex und Smog-Alarm.
Für die Zhoukou. Heute ist Sonntag, 21. Dezember 2025. Für Zhoukou wurden folgende Luftverschmutzungswerte gemessen:- Feinstaub (PM2,5) - 22 (Moderate)
- Kohlenmonoxid (CO) - 219 (gut)
- Ozon (O3) - 0 (gut)
- Stickstoffdioxid (NO2) - 7 (gut)
- Feinstaub (PM10) Schwebestaub - 36 (Moderate)
- Schwefeldioxid (SO2) - 8 (gut)

Wie ist die Luftqualität Zhoukou heute? Ist die Luft in Zhoukou? verschmutzt. Gibt es Smog?
Wie hoch ist der aktuelle PM2,5-Wert in Zhoukou? (Feinstaub (PM2,5))
Die heutige PM2.5-Stufe ist:
22 (Moderate)
Zum Vergleich: Der höchste PM2,5-Wert in Zhoukou in den letzten 7 Tagen war: 23 (Freitag, 27. Mai 2022) und der niedrigste: 23 (Freitag, 27. Mai 2022).
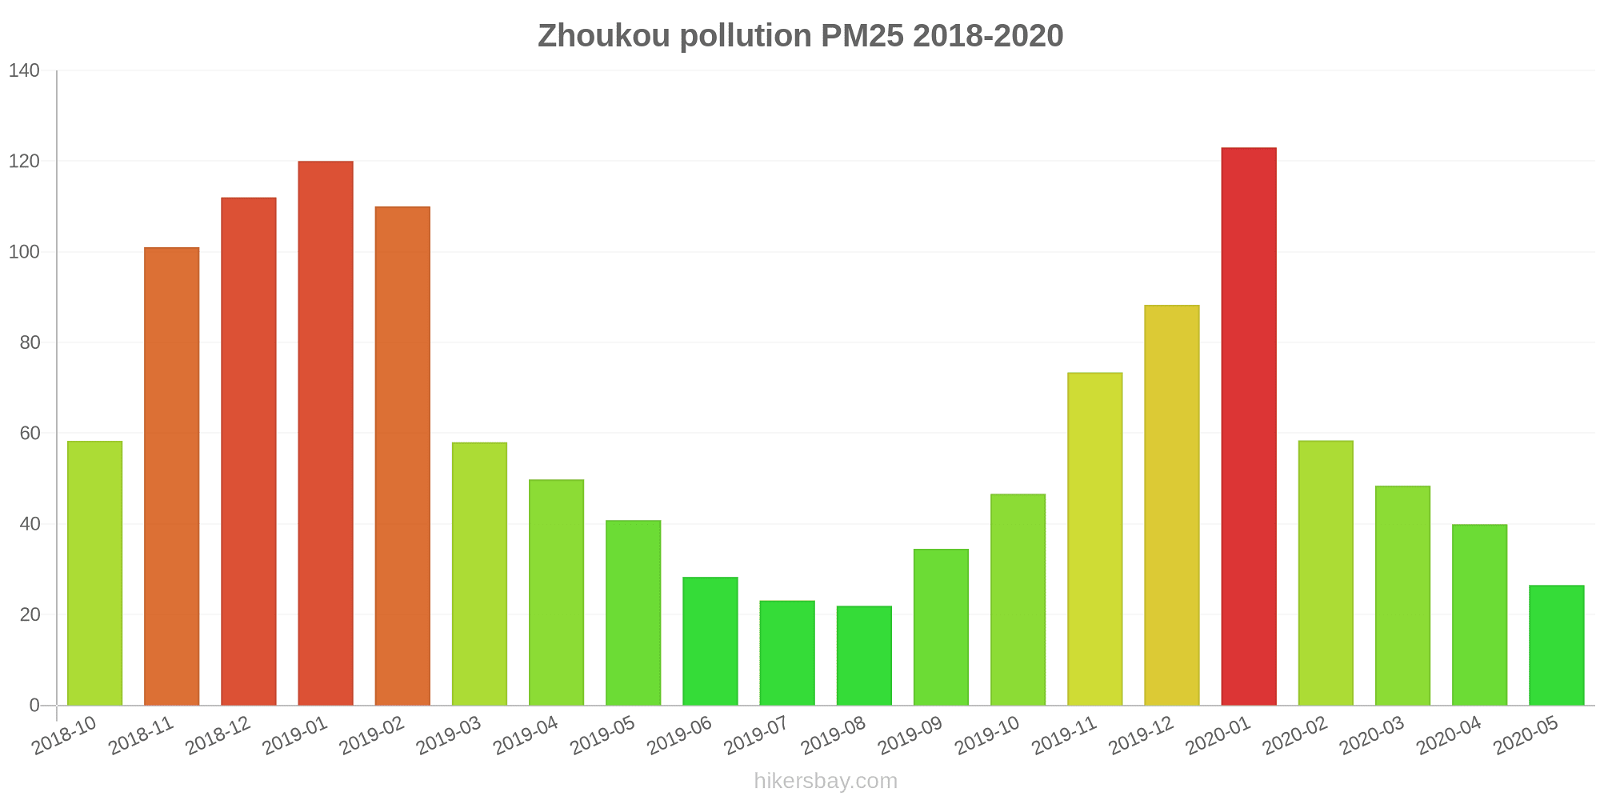
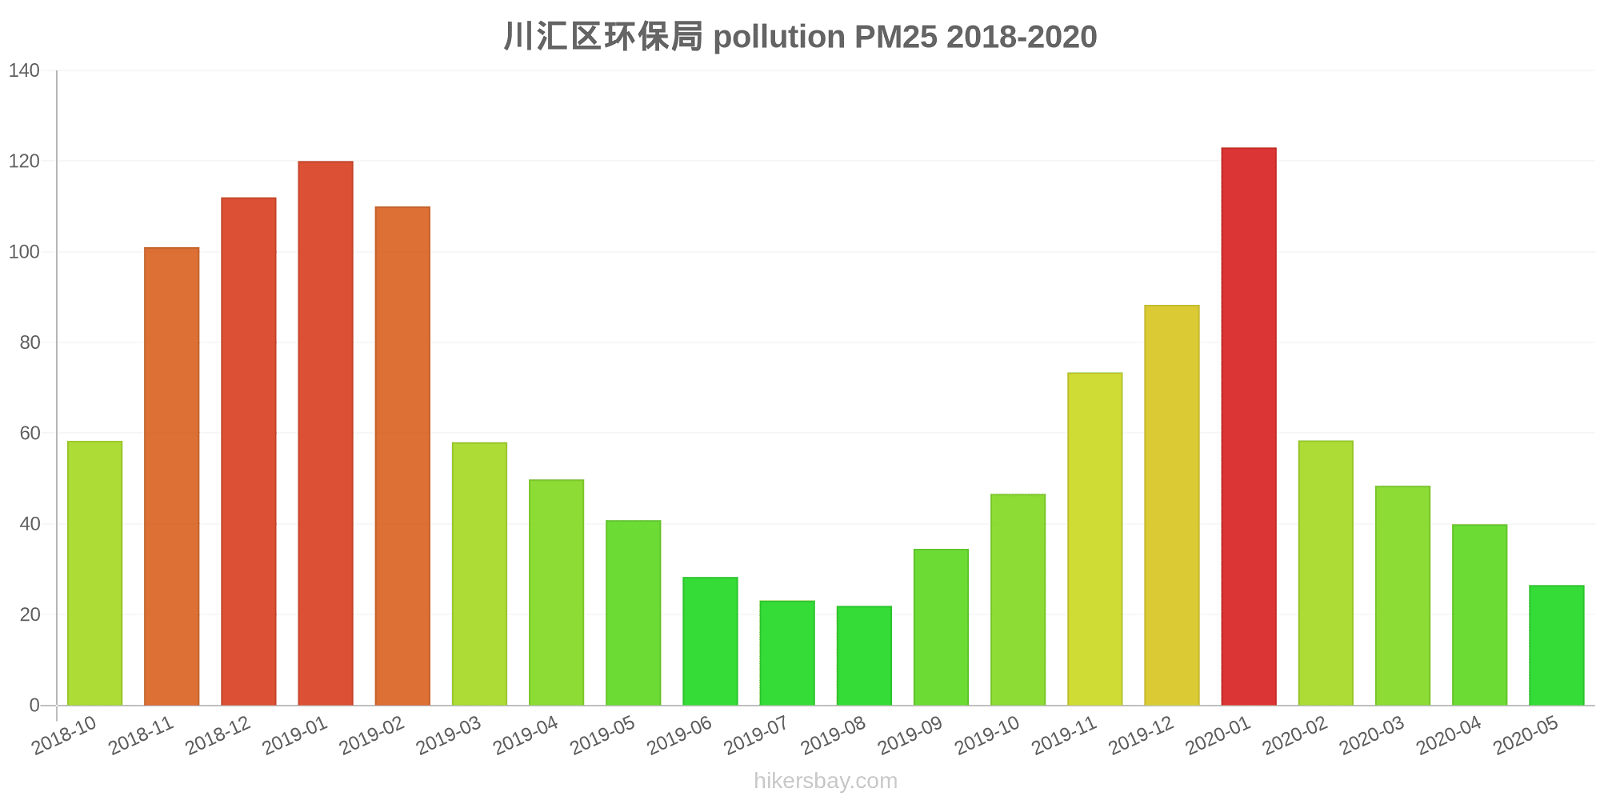
Die höchsten PM2,5-Werte wurden gemessen: 123 (Januar 2020).
Die niedrigste Feinstaubbelastung PM2,5 tritt im Monat auf: August (22).
Wie hoch ist der CO-Gehalt? (Kohlenmonoxid (CO))
219 (gut)
Wie ist das O3-Niveau heute in Zhoukou? (Ozon (O3))
0 (gut)
Wie hoch ist das NO2-Niveau? (Stickstoffdioxid (NO2))
7 (gut)
Wie hoch ist der PM10-Stand heute in Zhoukou? (Feinstaub (PM10) Schwebestaub)
Der aktuelle Feinstaubgehalt PM10 in Zhoukou is:
36 (Moderate)
Die höchsten PM10-Werte treten in der Regel im Monat auf: 173 (Dezember 2018).
Der niedrigste Wert der Feinstaub-PM10-Belastung in Zhoukou ist in der Regel in: August (46).
Wie hoch ist die SO2-Belastung? (Schwefeldioxid (SO2))
8 (gut)
Aktuelle Daten Freitag, 27. Mai 2022, 15:00
PM2,5 22 (Moderate)
CO 219 (gut)
O3 0 (gut)
NO2 7 (gut)
PM10 36 (Moderate)
SO2 8 (gut)
Daten zur Luftverschmutzung der letzten Tage in Zhoukou
index
2022-05-27
pm25
23
Moderate
co
475
Good
o3
25
Good
no2
21
Good
pm10
32
Moderate
so2
4
Good
data source »
Luftverschmutzung in Zhoukou von Oktober 2018 bis Mai 2020

index
2020-05
2020-04
2020-03
2020-02
2020-01
2019-12
2019-11
2019-10
2019-09
2019-08
2019-07
2019-06
2019-05
2019-04
2019-03
2019-02
2019-01
2018-12
2018-11
2018-10
pm25
27 (Moderate)
40 (Unhealthy for Sensitive Groups)
48 (Unhealthy for Sensitive Groups)
58 (Unhealthy)
123 (Very bad Hazardous)
88 (Very Unhealthy)
73 (Unhealthy)
47 (Unhealthy for Sensitive Groups)
35 (Moderate)
22 (Moderate)
23 (Moderate)
28 (Moderate)
41 (Unhealthy for Sensitive Groups)
50 (Unhealthy for Sensitive Groups)
58 (Unhealthy)
110 (Very bad Hazardous)
120 (Very bad Hazardous)
112 (Very bad Hazardous)
101 (Very Unhealthy)
58 (Unhealthy)
co
622 (Good)
693 (Good)
678 (Good)
769 (Good)
1 (Good)
884 (Good)
834 (Good)
747 (Good)
747 (Good)
659 (Good)
689 (Good)
734 (Good)
663 (Good)
821 (Good)
816 (Good)
1 (Good)
1 (Good)
1 (Good)
1 (Good)
912 (Good)
no2
17 (Good)
24 (Good)
25 (Good)
15 (Good)
30 (Good)
38 (Good)
36 (Good)
29 (Good)
22 (Good)
15 (Good)
13 (Good)
14 (Good)
21 (Good)
19 (Good)
30 (Good)
26 (Good)
44 (Moderate)
43 (Moderate)
36 (Good)
42 (Moderate)
o3
145 (Unhealthy for Sensitive Groups)
141 (Unhealthy for Sensitive Groups)
110 (Moderate)
93 (Moderate)
78 (Moderate)
66 (Good)
109 (Moderate)
133 (Unhealthy for Sensitive Groups)
171 (Unhealthy)
150 (Unhealthy)
168 (Unhealthy)
190 (Very Unhealthy)
156 (Unhealthy)
141 (Unhealthy for Sensitive Groups)
125 (Unhealthy for Sensitive Groups)
94 (Moderate)
71 (Moderate)
50 (Good)
96 (Moderate)
123 (Unhealthy for Sensitive Groups)
pm10
67 (Unhealthy for Sensitive Groups)
77 (Unhealthy for Sensitive Groups)
85 (Unhealthy)
73 (Unhealthy for Sensitive Groups)
136 (Very Unhealthy)
115 (Very Unhealthy)
123 (Very Unhealthy)
91 (Unhealthy)
72 (Unhealthy for Sensitive Groups)
46 (Moderate)
46 (Moderate)
59 (Unhealthy for Sensitive Groups)
96 (Unhealthy)
89 (Unhealthy)
104 (Unhealthy)
148 (Very Unhealthy)
165 (Very bad Hazardous)
173 (Very bad Hazardous)
149 (Very Unhealthy)
105 (Unhealthy)
so2
8.6 (Good)
8.9 (Good)
8.1 (Good)
6.3 (Good)
9.3 (Good)
8.5 (Good)
11 (Good)
8 (Good)
8.7 (Good)
5.8 (Good)
5.8 (Good)
7.5 (Good)
9.4 (Good)
9.3 (Good)
11 (Good)
9.4 (Good)
12 (Good)
13 (Good)
13 (Good)
17 (Good)
data source »
川汇区环保局
Freitag, 27. Mai 2022, 15:00
PM2,5 22 (Moderate)
Feinstaub (PM2,5)
CO 219 (gut)
Kohlenmonoxid (CO)
O3 0.05 (gut)
Ozon (O3)
NO2 7 (gut)
Stickstoffdioxid (NO2)
PM10 36 (Moderate)
Feinstaub (PM10) Schwebestaub
SO2 7.7 (gut)
Schwefeldioxid (SO2)
川汇区环保局
index
2022-05-27
pm25
23
co
475
o3
25
no2
21
pm10
32
so2
4.4
川汇区环保局
2018-10 2020-05

index
2020-05
2020-04
2020-03
2020-02
2020-01
2019-12
2019-11
2019-10
2019-09
2019-08
2019-07
2019-06
2019-05
2019-04
2019-03
2019-02
2019-01
2018-12
2018-11
2018-10
pm25
27
40
48
58
123
88
73
47
35
22
23
28
41
50
58
110
120
112
101
58
co
622
693
678
769
1
884
834
747
747
659
689
734
663
821
816
1
1
1
1
912
no2
17
24
25
15
30
38
36
29
22
15
13
14
21
19
30
26
44
43
36
42
o3
145
141
110
93
78
66
109
133
171
150
168
190
156
141
125
94
71
50
96
123
pm10
67
77
85
73
136
115
123
91
72
46
46
59
96
89
104
148
165
173
149
105
so2
8.6
8.9
8.1
6.3
9.3
8.5
11
8
8.7
5.8
5.8
7.5
9.4
9.3
11
9.4
12
13
13
17
* Pollution data source:
https://openaq.org
(ChinaAQIData)
The data is licensed under CC-By 4.0
PM2,5 22 (Moderate)
CO 219 (gut)
O3 0 (gut)
NO2 7 (gut)
PM10 36 (Moderate)
SO2 8 (gut)
Daten zur Luftverschmutzung der letzten Tage in Zhoukou
| index | 2022-05-27 |
|---|---|
| pm25 | 23 Moderate |
| co | 475 Good |
| o3 | 25 Good |
| no2 | 21 Good |
| pm10 | 32 Moderate |
| so2 | 4 Good |

| index | 2020-05 | 2020-04 | 2020-03 | 2020-02 | 2020-01 | 2019-12 | 2019-11 | 2019-10 | 2019-09 | 2019-08 | 2019-07 | 2019-06 | 2019-05 | 2019-04 | 2019-03 | 2019-02 | 2019-01 | 2018-12 | 2018-11 | 2018-10 |
|---|---|---|---|---|---|---|---|---|---|---|---|---|---|---|---|---|---|---|---|---|
| pm25 | 27 (Moderate) | 40 (Unhealthy for Sensitive Groups) | 48 (Unhealthy for Sensitive Groups) | 58 (Unhealthy) | 123 (Very bad Hazardous) | 88 (Very Unhealthy) | 73 (Unhealthy) | 47 (Unhealthy for Sensitive Groups) | 35 (Moderate) | 22 (Moderate) | 23 (Moderate) | 28 (Moderate) | 41 (Unhealthy for Sensitive Groups) | 50 (Unhealthy for Sensitive Groups) | 58 (Unhealthy) | 110 (Very bad Hazardous) | 120 (Very bad Hazardous) | 112 (Very bad Hazardous) | 101 (Very Unhealthy) | 58 (Unhealthy) |
| co | 622 (Good) | 693 (Good) | 678 (Good) | 769 (Good) | 1 (Good) | 884 (Good) | 834 (Good) | 747 (Good) | 747 (Good) | 659 (Good) | 689 (Good) | 734 (Good) | 663 (Good) | 821 (Good) | 816 (Good) | 1 (Good) | 1 (Good) | 1 (Good) | 1 (Good) | 912 (Good) |
| no2 | 17 (Good) | 24 (Good) | 25 (Good) | 15 (Good) | 30 (Good) | 38 (Good) | 36 (Good) | 29 (Good) | 22 (Good) | 15 (Good) | 13 (Good) | 14 (Good) | 21 (Good) | 19 (Good) | 30 (Good) | 26 (Good) | 44 (Moderate) | 43 (Moderate) | 36 (Good) | 42 (Moderate) |
| o3 | 145 (Unhealthy for Sensitive Groups) | 141 (Unhealthy for Sensitive Groups) | 110 (Moderate) | 93 (Moderate) | 78 (Moderate) | 66 (Good) | 109 (Moderate) | 133 (Unhealthy for Sensitive Groups) | 171 (Unhealthy) | 150 (Unhealthy) | 168 (Unhealthy) | 190 (Very Unhealthy) | 156 (Unhealthy) | 141 (Unhealthy for Sensitive Groups) | 125 (Unhealthy for Sensitive Groups) | 94 (Moderate) | 71 (Moderate) | 50 (Good) | 96 (Moderate) | 123 (Unhealthy for Sensitive Groups) |
| pm10 | 67 (Unhealthy for Sensitive Groups) | 77 (Unhealthy for Sensitive Groups) | 85 (Unhealthy) | 73 (Unhealthy for Sensitive Groups) | 136 (Very Unhealthy) | 115 (Very Unhealthy) | 123 (Very Unhealthy) | 91 (Unhealthy) | 72 (Unhealthy for Sensitive Groups) | 46 (Moderate) | 46 (Moderate) | 59 (Unhealthy for Sensitive Groups) | 96 (Unhealthy) | 89 (Unhealthy) | 104 (Unhealthy) | 148 (Very Unhealthy) | 165 (Very bad Hazardous) | 173 (Very bad Hazardous) | 149 (Very Unhealthy) | 105 (Unhealthy) |
| so2 | 8.6 (Good) | 8.9 (Good) | 8.1 (Good) | 6.3 (Good) | 9.3 (Good) | 8.5 (Good) | 11 (Good) | 8 (Good) | 8.7 (Good) | 5.8 (Good) | 5.8 (Good) | 7.5 (Good) | 9.4 (Good) | 9.3 (Good) | 11 (Good) | 9.4 (Good) | 12 (Good) | 13 (Good) | 13 (Good) | 17 (Good) |
PM2,5 22 (Moderate)
Feinstaub (PM2,5)CO 219 (gut)
Kohlenmonoxid (CO)O3 0.05 (gut)
Ozon (O3)NO2 7 (gut)
Stickstoffdioxid (NO2)PM10 36 (Moderate)
Feinstaub (PM10) SchwebestaubSO2 7.7 (gut)
Schwefeldioxid (SO2)川汇区环保局
| index | 2022-05-27 |
|---|---|
| pm25 | 23 |
| co | 475 |
| o3 | 25 |
| no2 | 21 |
| pm10 | 32 |
| so2 | 4.4 |
川汇区环保局

| index | 2020-05 | 2020-04 | 2020-03 | 2020-02 | 2020-01 | 2019-12 | 2019-11 | 2019-10 | 2019-09 | 2019-08 | 2019-07 | 2019-06 | 2019-05 | 2019-04 | 2019-03 | 2019-02 | 2019-01 | 2018-12 | 2018-11 | 2018-10 |
|---|---|---|---|---|---|---|---|---|---|---|---|---|---|---|---|---|---|---|---|---|
| pm25 | 27 | 40 | 48 | 58 | 123 | 88 | 73 | 47 | 35 | 22 | 23 | 28 | 41 | 50 | 58 | 110 | 120 | 112 | 101 | 58 |
| co | 622 | 693 | 678 | 769 | 1 | 884 | 834 | 747 | 747 | 659 | 689 | 734 | 663 | 821 | 816 | 1 | 1 | 1 | 1 | 912 |
| no2 | 17 | 24 | 25 | 15 | 30 | 38 | 36 | 29 | 22 | 15 | 13 | 14 | 21 | 19 | 30 | 26 | 44 | 43 | 36 | 42 |
| o3 | 145 | 141 | 110 | 93 | 78 | 66 | 109 | 133 | 171 | 150 | 168 | 190 | 156 | 141 | 125 | 94 | 71 | 50 | 96 | 123 |
| pm10 | 67 | 77 | 85 | 73 | 136 | 115 | 123 | 91 | 72 | 46 | 46 | 59 | 96 | 89 | 104 | 148 | 165 | 173 | 149 | 105 |
| so2 | 8.6 | 8.9 | 8.1 | 6.3 | 9.3 | 8.5 | 11 | 8 | 8.7 | 5.8 | 5.8 | 7.5 | 9.4 | 9.3 | 11 | 9.4 | 12 | 13 | 13 | 17 |