Luftverschmutzung in Xiaoxita: Echtzeit-Luft-Qualitätsindex und Smog-Alarm.
Für die Xiaoxita. Heute ist Donnerstag, 4. Juni 2026. Für Xiaoxita wurden folgende Luftverschmutzungswerte gemessen:- Feinstaub (PM2,5) - 61 (ungesund)
- Stickstoffdioxid (NO2) - 22 (gut)
- Feinstaub (PM10) Schwebestaub - 69 (Ungesund für sensible Gruppen)
- Kohlenmonoxid (CO) - 219 (gut)
- Ozon (O3) - 0 (gut)
- Schwefeldioxid (SO2) - 8 (gut)

Wie ist die Luftqualität Xiaoxita heute? Ist die Luft in Xiaoxita? verschmutzt. Gibt es Smog?
Wie hoch ist der aktuelle PM2,5-Wert in Xiaoxita? (Feinstaub (PM2,5))
Die heutige PM2.5-Stufe ist:
61 (ungesund)
Zum Vergleich: Der höchste PM2,5-Wert in Xiaoxita in den letzten 7 Tagen war: 28 (Freitag, 27. Mai 2022) und der niedrigste: 28 (Freitag, 27. Mai 2022).
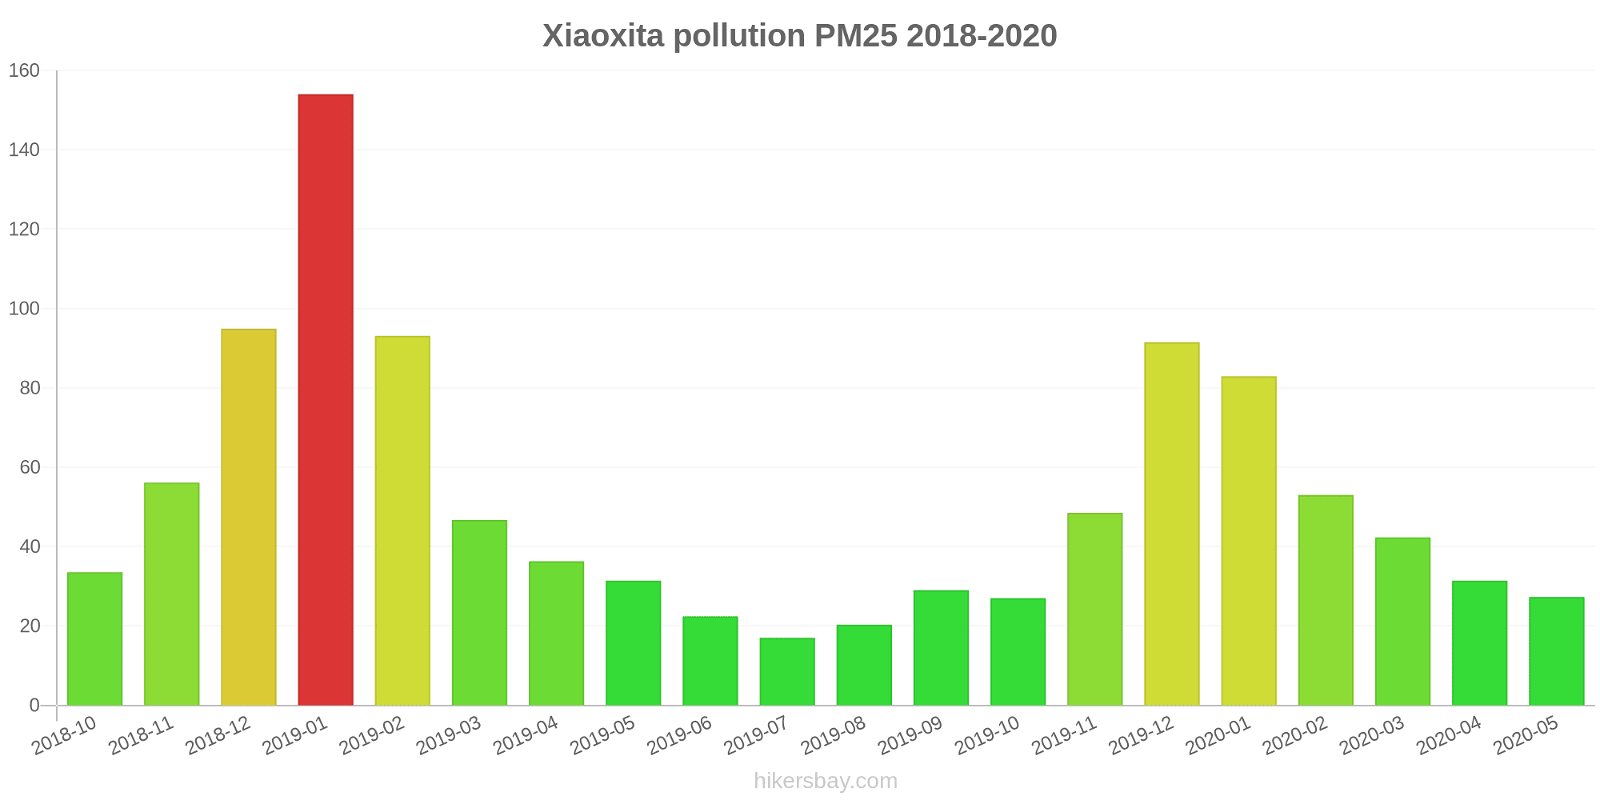
Die höchsten PM2,5-Werte wurden gemessen: 154 (Januar 2019).
Die niedrigste Feinstaubbelastung PM2,5 tritt im Monat auf: Juli (17).
Wie hoch ist das NO2-Niveau? (Stickstoffdioxid (NO2))
22 (gut)
Wie hoch ist der PM10-Stand heute in Xiaoxita? (Feinstaub (PM10) Schwebestaub)
Der aktuelle Feinstaubgehalt PM10 in Xiaoxita is:
69 (Ungesund für sensible Gruppen)
Die höchsten PM10-Werte treten in der Regel im Monat auf: 134 (Januar 2019).
Der niedrigste Wert der Feinstaub-PM10-Belastung in Xiaoxita ist in der Regel in: August (47).
Wie hoch ist der CO-Gehalt? (Kohlenmonoxid (CO))
219 (gut)
Wie ist das O3-Niveau heute in Xiaoxita? (Ozon (O3))
0 (gut)
Wie hoch ist die SO2-Belastung? (Schwefeldioxid (SO2))
8 (gut)
Aktuelle Daten Freitag, 27. Mai 2022, 15:00
PM2,5 61 (ungesund)
NO2 22 (gut)
PM10 69 (Ungesund für sensible Gruppen)
CO 219 (gut)
O3 0 (gut)
SO2 8 (gut)
Daten zur Luftverschmutzung der letzten Tage in Xiaoxita
index
2022-05-27
pm25
28
Moderate
no2
22
Good
pm10
35
Moderate
co
579
Good
o3
22
Good
so2
5
Good
data source »
Luftverschmutzung in Xiaoxita von Oktober 2018 bis Mai 2020
index
2020-05
2020-04
2020-03
2020-02
2020-01
2019-12
2019-11
2019-10
2019-09
2019-08
2019-07
2019-06
2019-05
2019-04
2019-03
2019-02
2019-01
2018-12
2018-11
2018-10
pm25
27 (Moderate)
31 (Moderate)
42 (Unhealthy for Sensitive Groups)
53 (Unhealthy for Sensitive Groups)
83 (Very Unhealthy)
92 (Very Unhealthy)
49 (Unhealthy for Sensitive Groups)
27 (Moderate)
29 (Moderate)
20 (Moderate)
17 (Moderate)
22 (Moderate)
31 (Moderate)
36 (Unhealthy for Sensitive Groups)
47 (Unhealthy for Sensitive Groups)
93 (Very Unhealthy)
154 (Very bad Hazardous)
95 (Very Unhealthy)
56 (Unhealthy)
34 (Moderate)
co
663 (Good)
585 (Good)
607 (Good)
699 (Good)
1 (Good)
1 (Good)
742 (Good)
612 (Good)
612 (Good)
580 (Good)
524 (Good)
583 (Good)
568 (Good)
682 (Good)
698 (Good)
1 (Good)
1 (Good)
1 (Good)
1 (Good)
816 (Good)
no2
21 (Good)
27 (Good)
18 (Good)
13 (Good)
29 (Good)
43 (Moderate)
39 (Good)
28 (Good)
23 (Good)
18 (Good)
20 (Good)
24 (Good)
27 (Good)
30 (Good)
36 (Good)
28 (Good)
46 (Moderate)
41 (Moderate)
39 (Good)
35 (Good)
o3
124 (Unhealthy for Sensitive Groups)
118 (Moderate)
98 (Moderate)
83 (Moderate)
59 (Good)
59 (Good)
83 (Moderate)
102 (Moderate)
165 (Unhealthy)
164 (Unhealthy)
153 (Unhealthy)
139 (Unhealthy for Sensitive Groups)
121 (Unhealthy for Sensitive Groups)
109 (Moderate)
91 (Moderate)
60 (Good)
41 (Good)
40 (Good)
70 (Good)
99 (Moderate)
pm10
49 (Moderate)
54 (Unhealthy for Sensitive Groups)
63 (Unhealthy for Sensitive Groups)
54 (Unhealthy for Sensitive Groups)
73 (Unhealthy for Sensitive Groups)
100 (Unhealthy)
81 (Unhealthy)
49 (Moderate)
58 (Unhealthy for Sensitive Groups)
47 (Moderate)
51 (Unhealthy for Sensitive Groups)
51 (Unhealthy for Sensitive Groups)
74 (Unhealthy for Sensitive Groups)
61 (Unhealthy for Sensitive Groups)
75 (Unhealthy for Sensitive Groups)
89 (Unhealthy)
134 (Very Unhealthy)
126 (Very Unhealthy)
81 (Unhealthy)
67 (Unhealthy for Sensitive Groups)
so2
4.6 (Good)
5.2 (Good)
7.5 (Good)
7.3 (Good)
7.9 (Good)
8.4 (Good)
7.8 (Good)
6.6 (Good)
6.2 (Good)
5.9 (Good)
6.6 (Good)
6.8 (Good)
8.6 (Good)
8.3 (Good)
8.8 (Good)
9.2 (Good)
12 (Good)
11 (Good)
9.9 (Good)
9.2 (Good)
data source »
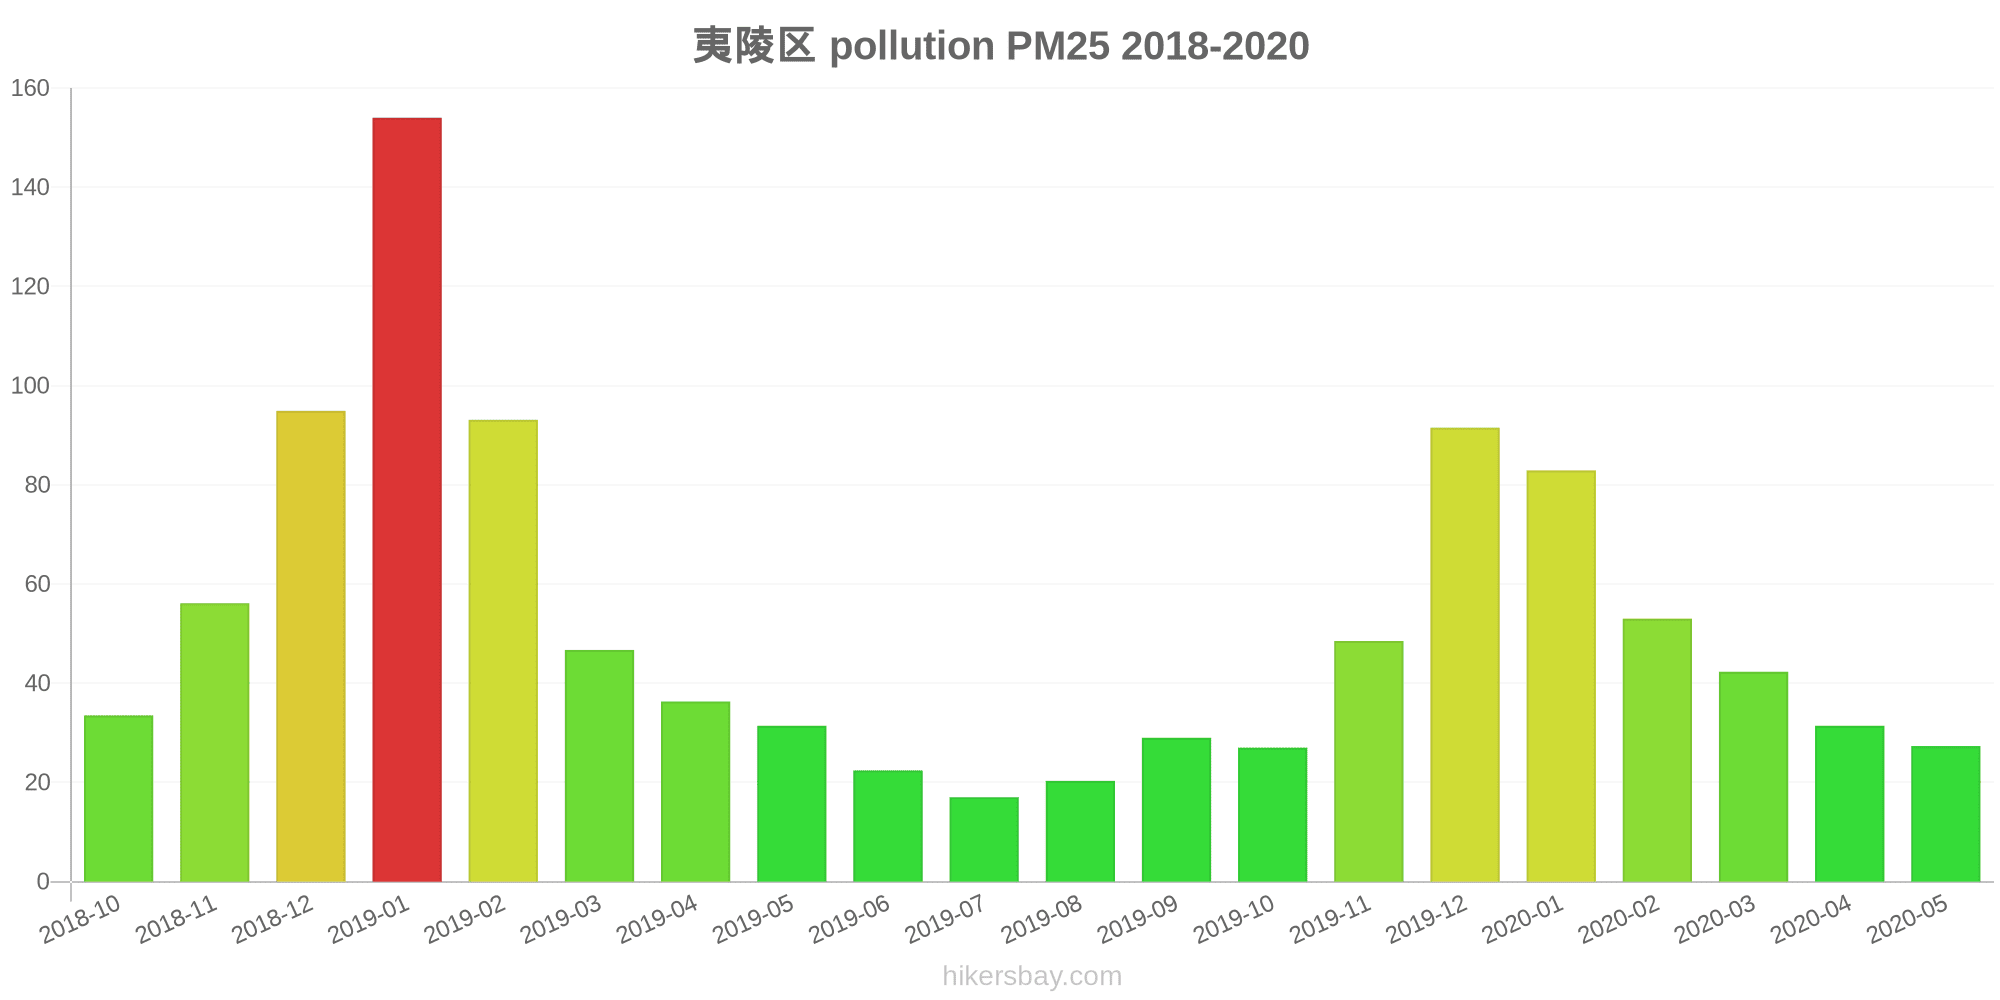
夷陵区
Freitag, 27. Mai 2022, 15:00
PM2,5 61 (ungesund)
Feinstaub (PM2,5)
NO2 22 (gut)
Stickstoffdioxid (NO2)
PM10 69 (Ungesund für sensible Gruppen)
Feinstaub (PM10) Schwebestaub
CO 219 (gut)
Kohlenmonoxid (CO)
O3 0.05 (gut)
Ozon (O3)
SO2 7.7 (gut)
Schwefeldioxid (SO2)
夷陵区
index
2022-05-27
pm25
28
no2
22
pm10
35
co
579
o3
22
so2
4.6
夷陵区
2018-10 2020-05

index
2020-05
2020-04
2020-03
2020-02
2020-01
2019-12
2019-11
2019-10
2019-09
2019-08
2019-07
2019-06
2019-05
2019-04
2019-03
2019-02
2019-01
2018-12
2018-11
2018-10
pm25
27
31
42
53
83
92
49
27
29
20
17
22
31
36
47
93
154
95
56
34
co
663
585
607
699
1
1
742
612
612
580
524
583
568
682
698
1
1
1
1
816
no2
21
27
18
13
29
43
39
28
23
18
20
24
27
30
36
28
46
41
39
35
o3
124
118
98
83
59
59
83
102
165
164
153
139
121
109
91
60
41
40
70
99
pm10
49
54
63
54
73
100
81
49
58
47
51
51
74
61
75
89
134
126
81
67
so2
4.6
5.2
7.5
7.3
7.9
8.4
7.8
6.6
6.2
5.9
6.6
6.8
8.6
8.3
8.8
9.2
12
11
9.9
9.2
* Pollution data source:
https://openaq.org
(ChinaAQIData)
The data is licensed under CC-By 4.0
PM2,5 61 (ungesund)
NO2 22 (gut)
PM10 69 (Ungesund für sensible Gruppen)
CO 219 (gut)
O3 0 (gut)
SO2 8 (gut)
Daten zur Luftverschmutzung der letzten Tage in Xiaoxita
| index | 2022-05-27 |
|---|---|
| pm25 | 28 Moderate |
| no2 | 22 Good |
| pm10 | 35 Moderate |
| co | 579 Good |
| o3 | 22 Good |
| so2 | 5 Good |

| index | 2020-05 | 2020-04 | 2020-03 | 2020-02 | 2020-01 | 2019-12 | 2019-11 | 2019-10 | 2019-09 | 2019-08 | 2019-07 | 2019-06 | 2019-05 | 2019-04 | 2019-03 | 2019-02 | 2019-01 | 2018-12 | 2018-11 | 2018-10 |
|---|---|---|---|---|---|---|---|---|---|---|---|---|---|---|---|---|---|---|---|---|
| pm25 | 27 (Moderate) | 31 (Moderate) | 42 (Unhealthy for Sensitive Groups) | 53 (Unhealthy for Sensitive Groups) | 83 (Very Unhealthy) | 92 (Very Unhealthy) | 49 (Unhealthy for Sensitive Groups) | 27 (Moderate) | 29 (Moderate) | 20 (Moderate) | 17 (Moderate) | 22 (Moderate) | 31 (Moderate) | 36 (Unhealthy for Sensitive Groups) | 47 (Unhealthy for Sensitive Groups) | 93 (Very Unhealthy) | 154 (Very bad Hazardous) | 95 (Very Unhealthy) | 56 (Unhealthy) | 34 (Moderate) |
| co | 663 (Good) | 585 (Good) | 607 (Good) | 699 (Good) | 1 (Good) | 1 (Good) | 742 (Good) | 612 (Good) | 612 (Good) | 580 (Good) | 524 (Good) | 583 (Good) | 568 (Good) | 682 (Good) | 698 (Good) | 1 (Good) | 1 (Good) | 1 (Good) | 1 (Good) | 816 (Good) |
| no2 | 21 (Good) | 27 (Good) | 18 (Good) | 13 (Good) | 29 (Good) | 43 (Moderate) | 39 (Good) | 28 (Good) | 23 (Good) | 18 (Good) | 20 (Good) | 24 (Good) | 27 (Good) | 30 (Good) | 36 (Good) | 28 (Good) | 46 (Moderate) | 41 (Moderate) | 39 (Good) | 35 (Good) |
| o3 | 124 (Unhealthy for Sensitive Groups) | 118 (Moderate) | 98 (Moderate) | 83 (Moderate) | 59 (Good) | 59 (Good) | 83 (Moderate) | 102 (Moderate) | 165 (Unhealthy) | 164 (Unhealthy) | 153 (Unhealthy) | 139 (Unhealthy for Sensitive Groups) | 121 (Unhealthy for Sensitive Groups) | 109 (Moderate) | 91 (Moderate) | 60 (Good) | 41 (Good) | 40 (Good) | 70 (Good) | 99 (Moderate) |
| pm10 | 49 (Moderate) | 54 (Unhealthy for Sensitive Groups) | 63 (Unhealthy for Sensitive Groups) | 54 (Unhealthy for Sensitive Groups) | 73 (Unhealthy for Sensitive Groups) | 100 (Unhealthy) | 81 (Unhealthy) | 49 (Moderate) | 58 (Unhealthy for Sensitive Groups) | 47 (Moderate) | 51 (Unhealthy for Sensitive Groups) | 51 (Unhealthy for Sensitive Groups) | 74 (Unhealthy for Sensitive Groups) | 61 (Unhealthy for Sensitive Groups) | 75 (Unhealthy for Sensitive Groups) | 89 (Unhealthy) | 134 (Very Unhealthy) | 126 (Very Unhealthy) | 81 (Unhealthy) | 67 (Unhealthy for Sensitive Groups) |
| so2 | 4.6 (Good) | 5.2 (Good) | 7.5 (Good) | 7.3 (Good) | 7.9 (Good) | 8.4 (Good) | 7.8 (Good) | 6.6 (Good) | 6.2 (Good) | 5.9 (Good) | 6.6 (Good) | 6.8 (Good) | 8.6 (Good) | 8.3 (Good) | 8.8 (Good) | 9.2 (Good) | 12 (Good) | 11 (Good) | 9.9 (Good) | 9.2 (Good) |
PM2,5 61 (ungesund)
Feinstaub (PM2,5)NO2 22 (gut)
Stickstoffdioxid (NO2)PM10 69 (Ungesund für sensible Gruppen)
Feinstaub (PM10) SchwebestaubCO 219 (gut)
Kohlenmonoxid (CO)O3 0.05 (gut)
Ozon (O3)SO2 7.7 (gut)
Schwefeldioxid (SO2)夷陵区
| index | 2022-05-27 |
|---|---|
| pm25 | 28 |
| no2 | 22 |
| pm10 | 35 |
| co | 579 |
| o3 | 22 |
| so2 | 4.6 |
夷陵区
| index | 2020-05 | 2020-04 | 2020-03 | 2020-02 | 2020-01 | 2019-12 | 2019-11 | 2019-10 | 2019-09 | 2019-08 | 2019-07 | 2019-06 | 2019-05 | 2019-04 | 2019-03 | 2019-02 | 2019-01 | 2018-12 | 2018-11 | 2018-10 |
|---|---|---|---|---|---|---|---|---|---|---|---|---|---|---|---|---|---|---|---|---|
| pm25 | 27 | 31 | 42 | 53 | 83 | 92 | 49 | 27 | 29 | 20 | 17 | 22 | 31 | 36 | 47 | 93 | 154 | 95 | 56 | 34 |
| co | 663 | 585 | 607 | 699 | 1 | 1 | 742 | 612 | 612 | 580 | 524 | 583 | 568 | 682 | 698 | 1 | 1 | 1 | 1 | 816 |
| no2 | 21 | 27 | 18 | 13 | 29 | 43 | 39 | 28 | 23 | 18 | 20 | 24 | 27 | 30 | 36 | 28 | 46 | 41 | 39 | 35 |
| o3 | 124 | 118 | 98 | 83 | 59 | 59 | 83 | 102 | 165 | 164 | 153 | 139 | 121 | 109 | 91 | 60 | 41 | 40 | 70 | 99 |
| pm10 | 49 | 54 | 63 | 54 | 73 | 100 | 81 | 49 | 58 | 47 | 51 | 51 | 74 | 61 | 75 | 89 | 134 | 126 | 81 | 67 |
| so2 | 4.6 | 5.2 | 7.5 | 7.3 | 7.9 | 8.4 | 7.8 | 6.6 | 6.2 | 5.9 | 6.6 | 6.8 | 8.6 | 8.3 | 8.8 | 9.2 | 12 | 11 | 9.9 | 9.2 |