Luftverschmutzung in Wangying: Echtzeit-Luft-Qualitätsindex und Smog-Alarm.
Für die Wangying. Heute ist Donnerstag, 4. Juni 2026. Für Wangying wurden folgende Luftverschmutzungswerte gemessen:- Feinstaub (PM2,5) - 61 (ungesund)
- Stickstoffdioxid (NO2) - 22 (gut)
- Feinstaub (PM10) Schwebestaub - 69 (Ungesund für sensible Gruppen)
- Kohlenmonoxid (CO) - 219 (gut)
- Ozon (O3) - 0 (gut)
- Schwefeldioxid (SO2) - 8 (gut)

Wie ist die Luftqualität Wangying heute? Ist die Luft in Wangying? verschmutzt. Gibt es Smog?
Wie hoch ist der aktuelle PM2,5-Wert in Wangying? (Feinstaub (PM2,5))
Die heutige PM2.5-Stufe ist:
61 (ungesund)
Zum Vergleich: Der höchste PM2,5-Wert in Wangying in den letzten 7 Tagen war: 28 (Freitag, 27. Mai 2022) und der niedrigste: 28 (Freitag, 27. Mai 2022).
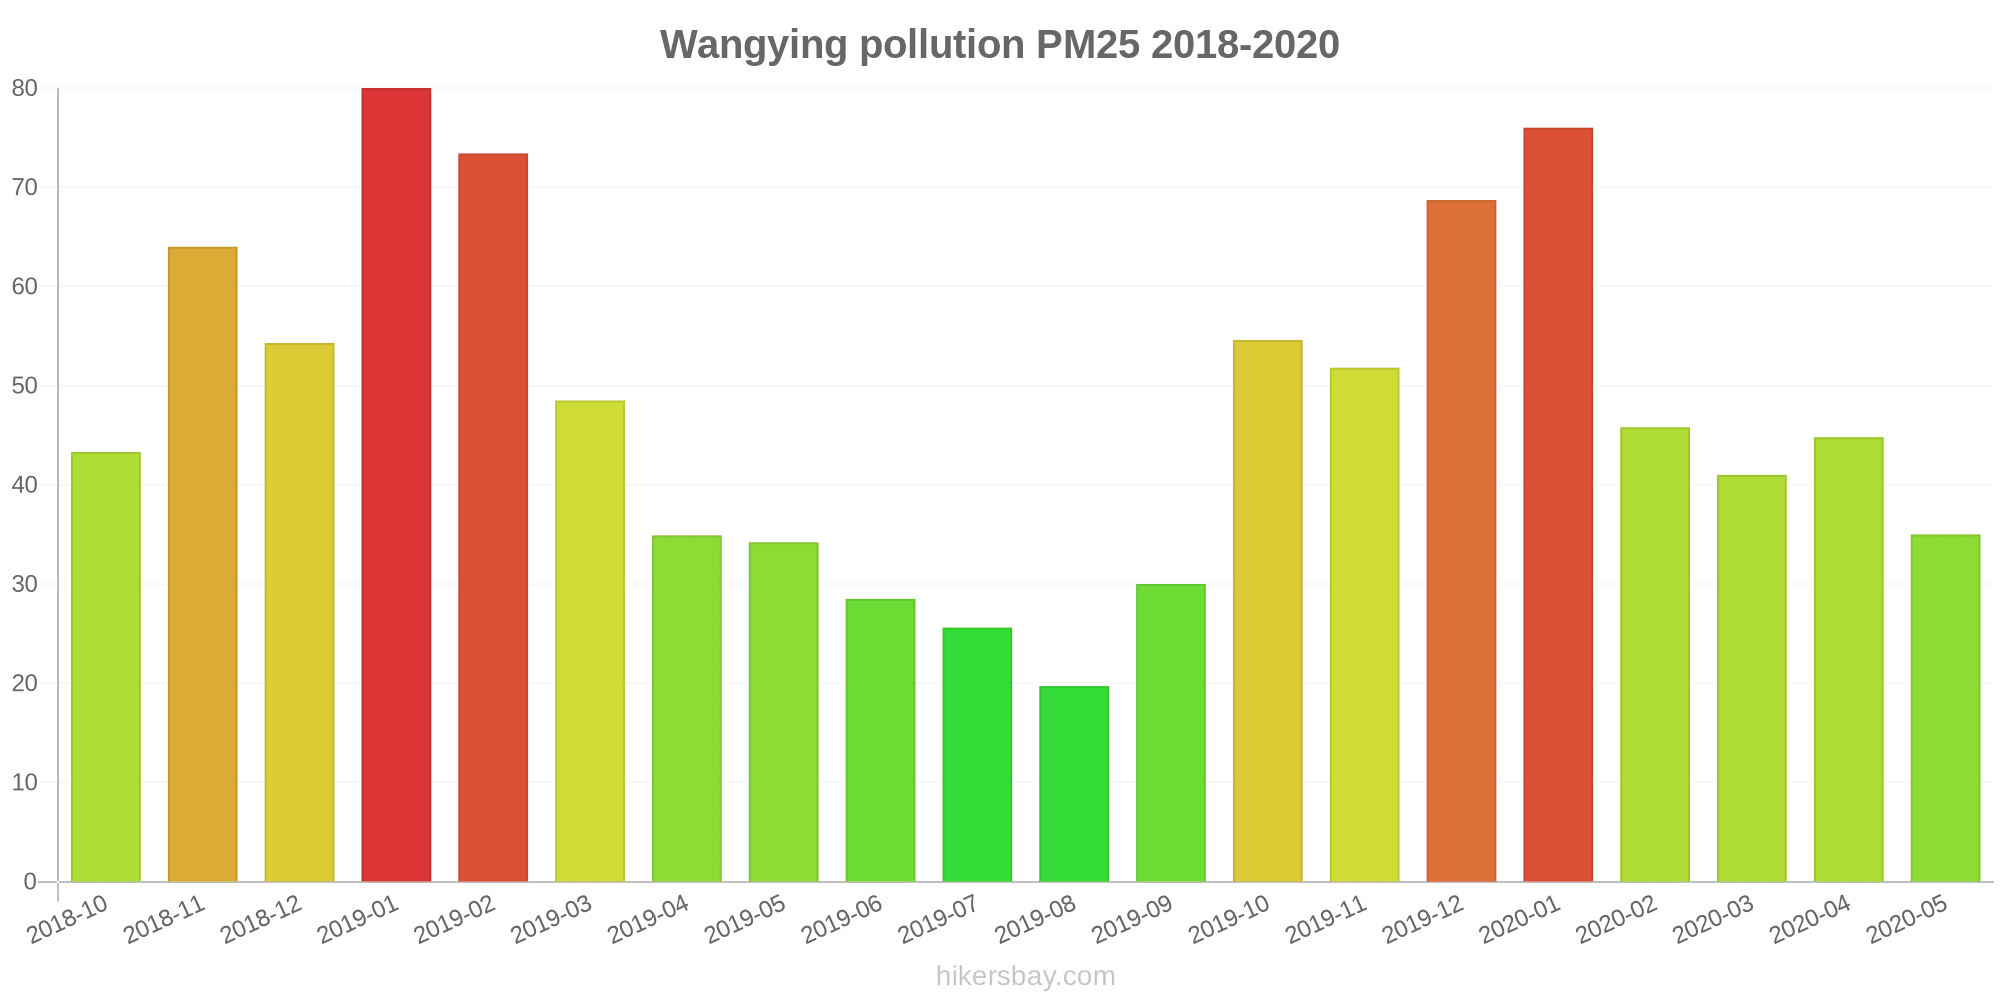
Die höchsten PM2,5-Werte wurden gemessen: 80 (Januar 2019).
Die niedrigste Feinstaubbelastung PM2,5 tritt im Monat auf: August (20).
Wie hoch ist das NO2-Niveau? (Stickstoffdioxid (NO2))
22 (gut)
Wie hoch ist der PM10-Stand heute in Wangying? (Feinstaub (PM10) Schwebestaub)
Der aktuelle Feinstaubgehalt PM10 in Wangying is:
69 (Ungesund für sensible Gruppen)
Die höchsten PM10-Werte treten in der Regel im Monat auf: 100 (Januar 2019).
Der niedrigste Wert der Feinstaub-PM10-Belastung in Wangying ist in der Regel in: August (37).
Wie hoch ist der CO-Gehalt? (Kohlenmonoxid (CO))
219 (gut)
Wie ist das O3-Niveau heute in Wangying? (Ozon (O3))
0 (gut)
Wie hoch ist die SO2-Belastung? (Schwefeldioxid (SO2))
8 (gut)
Aktuelle Daten Freitag, 27. Mai 2022, 15:00
PM2,5 61 (ungesund)
NO2 22 (gut)
PM10 69 (Ungesund für sensible Gruppen)
CO 219 (gut)
O3 0 (gut)
SO2 8 (gut)
Daten zur Luftverschmutzung der letzten Tage in Wangying
index
2022-05-27
pm25
28
Moderate
no2
22
Good
pm10
35
Moderate
co
579
Good
o3
22
Good
so2
5
Good
data source »
Luftverschmutzung in Wangying von Oktober 2018 bis Mai 2020

index
2020-05
2020-04
2020-03
2020-02
2020-01
2019-12
2019-11
2019-10
2019-09
2019-08
2019-07
2019-06
2019-05
2019-04
2019-03
2019-02
2019-01
2018-12
2018-11
2018-10
pm25
35 (Unhealthy for Sensitive Groups)
45 (Unhealthy for Sensitive Groups)
41 (Unhealthy for Sensitive Groups)
46 (Unhealthy for Sensitive Groups)
76 (Very Unhealthy)
69 (Unhealthy)
52 (Unhealthy for Sensitive Groups)
55 (Unhealthy for Sensitive Groups)
30 (Moderate)
20 (Moderate)
26 (Moderate)
29 (Moderate)
34 (Moderate)
35 (Moderate)
49 (Unhealthy for Sensitive Groups)
73 (Unhealthy)
80 (Very Unhealthy)
54 (Unhealthy for Sensitive Groups)
64 (Unhealthy)
43 (Unhealthy for Sensitive Groups)
co
470 (Good)
494 (Good)
664 (Good)
640 (Good)
869 (Good)
780 (Good)
480 (Good)
591 (Good)
482 (Good)
449 (Good)
506 (Good)
565 (Good)
559 (Good)
562 (Good)
626 (Good)
980 (Good)
975 (Good)
749 (Good)
929 (Good)
632 (Good)
no2
17 (Good)
26 (Good)
22 (Good)
13 (Good)
27 (Good)
43 (Moderate)
39 (Good)
38 (Good)
29 (Good)
18 (Good)
14 (Good)
15 (Good)
27 (Good)
31 (Good)
35 (Good)
30 (Good)
44 (Moderate)
43 (Moderate)
34 (Good)
40 (Moderate)
o3
127 (Unhealthy for Sensitive Groups)
139 (Unhealthy for Sensitive Groups)
109 (Moderate)
95 (Moderate)
81 (Moderate)
71 (Moderate)
94 (Moderate)
127 (Unhealthy for Sensitive Groups)
149 (Unhealthy for Sensitive Groups)
134 (Unhealthy for Sensitive Groups)
170 (Unhealthy)
204 (Very Unhealthy)
167 (Unhealthy)
138 (Unhealthy for Sensitive Groups)
125 (Unhealthy for Sensitive Groups)
90 (Moderate)
73 (Moderate)
61 (Good)
86 (Moderate)
111 (Moderate)
pm10
49 (Moderate)
71 (Unhealthy for Sensitive Groups)
68 (Unhealthy for Sensitive Groups)
59 (Unhealthy for Sensitive Groups)
98 (Unhealthy)
96 (Unhealthy)
94 (Unhealthy)
90 (Unhealthy)
49 (Moderate)
37 (Moderate)
45 (Moderate)
47 (Moderate)
68 (Unhealthy for Sensitive Groups)
66 (Unhealthy for Sensitive Groups)
81 (Unhealthy)
89 (Unhealthy)
100 (Unhealthy)
84 (Unhealthy)
91 (Unhealthy)
78 (Unhealthy for Sensitive Groups)
so2
4.7 (Good)
7.4 (Good)
5.3 (Good)
3.2 (Good)
4.7 (Good)
8.5 (Good)
5.5 (Good)
9 (Good)
9.9 (Good)
5.6 (Good)
6 (Good)
6.4 (Good)
8.8 (Good)
11 (Good)
12 (Good)
9.4 (Good)
13 (Good)
12 (Good)
8.2 (Good)
11 (Good)
data source »
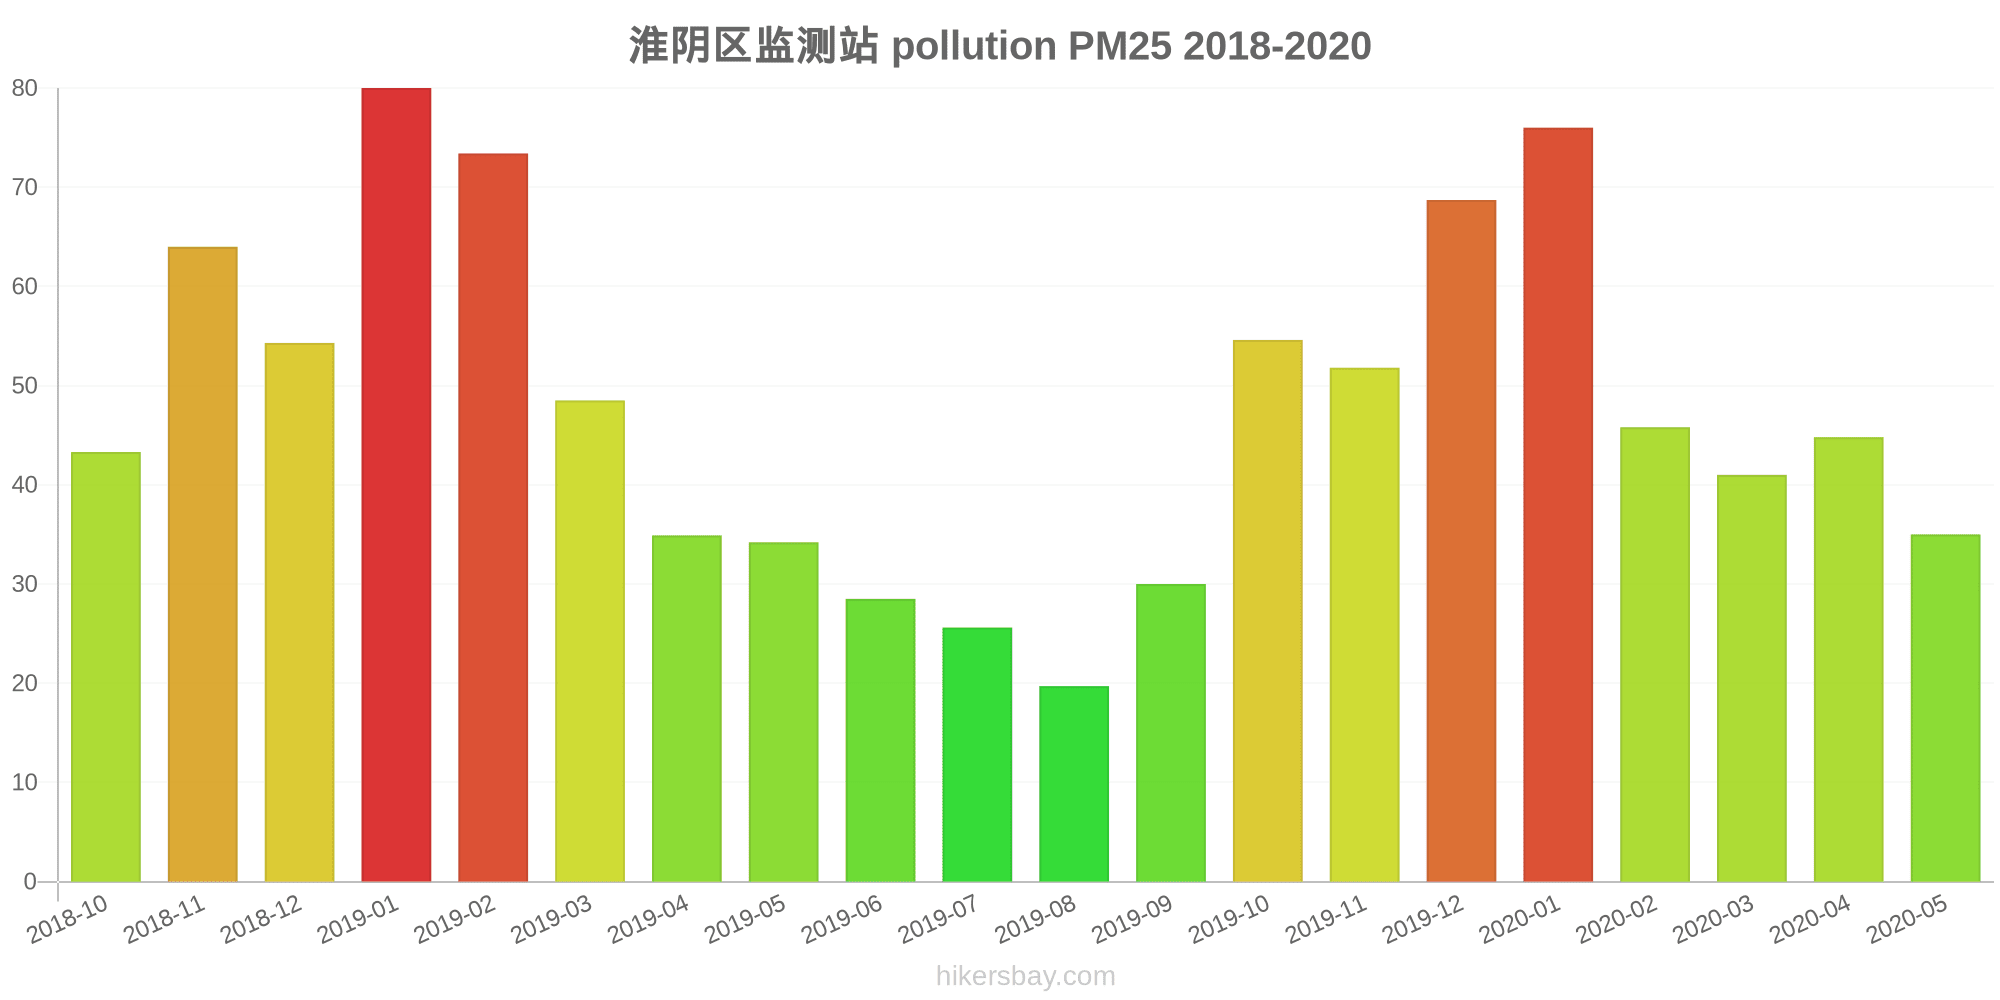
淮阴区监测站
Freitag, 27. Mai 2022, 15:00
PM2,5 61 (ungesund)
Feinstaub (PM2,5)
NO2 22 (gut)
Stickstoffdioxid (NO2)
PM10 69 (Ungesund für sensible Gruppen)
Feinstaub (PM10) Schwebestaub
CO 219 (gut)
Kohlenmonoxid (CO)
O3 0.05 (gut)
Ozon (O3)
SO2 7.7 (gut)
Schwefeldioxid (SO2)
淮阴区监测站
index
2022-05-27
pm25
28
no2
22
pm10
35
co
579
o3
22
so2
4.6
淮阴区监测站
2018-10 2020-05

index
2020-05
2020-04
2020-03
2020-02
2020-01
2019-12
2019-11
2019-10
2019-09
2019-08
2019-07
2019-06
2019-05
2019-04
2019-03
2019-02
2019-01
2018-12
2018-11
2018-10
pm25
35
45
41
46
76
69
52
55
30
20
26
29
34
35
49
73
80
54
64
43
co
470
494
664
640
869
780
480
591
482
449
506
565
559
562
626
980
975
749
929
632
no2
17
26
22
13
27
43
39
38
29
18
14
15
27
31
35
30
44
43
34
40
o3
127
139
109
95
81
71
94
127
149
134
170
204
167
138
125
90
73
61
86
111
pm10
49
71
68
59
98
96
94
90
49
37
45
47
68
66
81
89
100
84
91
78
so2
4.7
7.4
5.3
3.2
4.7
8.5
5.5
9
9.9
5.6
6
6.4
8.8
11
12
9.4
13
12
8.2
11
* Pollution data source:
https://openaq.org
(ChinaAQIData)
The data is licensed under CC-By 4.0
PM2,5 61 (ungesund)
NO2 22 (gut)
PM10 69 (Ungesund für sensible Gruppen)
CO 219 (gut)
O3 0 (gut)
SO2 8 (gut)
Daten zur Luftverschmutzung der letzten Tage in Wangying
| index | 2022-05-27 |
|---|---|
| pm25 | 28 Moderate |
| no2 | 22 Good |
| pm10 | 35 Moderate |
| co | 579 Good |
| o3 | 22 Good |
| so2 | 5 Good |
| index | 2020-05 | 2020-04 | 2020-03 | 2020-02 | 2020-01 | 2019-12 | 2019-11 | 2019-10 | 2019-09 | 2019-08 | 2019-07 | 2019-06 | 2019-05 | 2019-04 | 2019-03 | 2019-02 | 2019-01 | 2018-12 | 2018-11 | 2018-10 |
|---|---|---|---|---|---|---|---|---|---|---|---|---|---|---|---|---|---|---|---|---|
| pm25 | 35 (Unhealthy for Sensitive Groups) | 45 (Unhealthy for Sensitive Groups) | 41 (Unhealthy for Sensitive Groups) | 46 (Unhealthy for Sensitive Groups) | 76 (Very Unhealthy) | 69 (Unhealthy) | 52 (Unhealthy for Sensitive Groups) | 55 (Unhealthy for Sensitive Groups) | 30 (Moderate) | 20 (Moderate) | 26 (Moderate) | 29 (Moderate) | 34 (Moderate) | 35 (Moderate) | 49 (Unhealthy for Sensitive Groups) | 73 (Unhealthy) | 80 (Very Unhealthy) | 54 (Unhealthy for Sensitive Groups) | 64 (Unhealthy) | 43 (Unhealthy for Sensitive Groups) |
| co | 470 (Good) | 494 (Good) | 664 (Good) | 640 (Good) | 869 (Good) | 780 (Good) | 480 (Good) | 591 (Good) | 482 (Good) | 449 (Good) | 506 (Good) | 565 (Good) | 559 (Good) | 562 (Good) | 626 (Good) | 980 (Good) | 975 (Good) | 749 (Good) | 929 (Good) | 632 (Good) |
| no2 | 17 (Good) | 26 (Good) | 22 (Good) | 13 (Good) | 27 (Good) | 43 (Moderate) | 39 (Good) | 38 (Good) | 29 (Good) | 18 (Good) | 14 (Good) | 15 (Good) | 27 (Good) | 31 (Good) | 35 (Good) | 30 (Good) | 44 (Moderate) | 43 (Moderate) | 34 (Good) | 40 (Moderate) |
| o3 | 127 (Unhealthy for Sensitive Groups) | 139 (Unhealthy for Sensitive Groups) | 109 (Moderate) | 95 (Moderate) | 81 (Moderate) | 71 (Moderate) | 94 (Moderate) | 127 (Unhealthy for Sensitive Groups) | 149 (Unhealthy for Sensitive Groups) | 134 (Unhealthy for Sensitive Groups) | 170 (Unhealthy) | 204 (Very Unhealthy) | 167 (Unhealthy) | 138 (Unhealthy for Sensitive Groups) | 125 (Unhealthy for Sensitive Groups) | 90 (Moderate) | 73 (Moderate) | 61 (Good) | 86 (Moderate) | 111 (Moderate) |
| pm10 | 49 (Moderate) | 71 (Unhealthy for Sensitive Groups) | 68 (Unhealthy for Sensitive Groups) | 59 (Unhealthy for Sensitive Groups) | 98 (Unhealthy) | 96 (Unhealthy) | 94 (Unhealthy) | 90 (Unhealthy) | 49 (Moderate) | 37 (Moderate) | 45 (Moderate) | 47 (Moderate) | 68 (Unhealthy for Sensitive Groups) | 66 (Unhealthy for Sensitive Groups) | 81 (Unhealthy) | 89 (Unhealthy) | 100 (Unhealthy) | 84 (Unhealthy) | 91 (Unhealthy) | 78 (Unhealthy for Sensitive Groups) |
| so2 | 4.7 (Good) | 7.4 (Good) | 5.3 (Good) | 3.2 (Good) | 4.7 (Good) | 8.5 (Good) | 5.5 (Good) | 9 (Good) | 9.9 (Good) | 5.6 (Good) | 6 (Good) | 6.4 (Good) | 8.8 (Good) | 11 (Good) | 12 (Good) | 9.4 (Good) | 13 (Good) | 12 (Good) | 8.2 (Good) | 11 (Good) |
PM2,5 61 (ungesund)
Feinstaub (PM2,5)NO2 22 (gut)
Stickstoffdioxid (NO2)PM10 69 (Ungesund für sensible Gruppen)
Feinstaub (PM10) SchwebestaubCO 219 (gut)
Kohlenmonoxid (CO)O3 0.05 (gut)
Ozon (O3)SO2 7.7 (gut)
Schwefeldioxid (SO2)淮阴区监测站
| index | 2022-05-27 |
|---|---|
| pm25 | 28 |
| no2 | 22 |
| pm10 | 35 |
| co | 579 |
| o3 | 22 |
| so2 | 4.6 |
淮阴区监测站
| index | 2020-05 | 2020-04 | 2020-03 | 2020-02 | 2020-01 | 2019-12 | 2019-11 | 2019-10 | 2019-09 | 2019-08 | 2019-07 | 2019-06 | 2019-05 | 2019-04 | 2019-03 | 2019-02 | 2019-01 | 2018-12 | 2018-11 | 2018-10 |
|---|---|---|---|---|---|---|---|---|---|---|---|---|---|---|---|---|---|---|---|---|
| pm25 | 35 | 45 | 41 | 46 | 76 | 69 | 52 | 55 | 30 | 20 | 26 | 29 | 34 | 35 | 49 | 73 | 80 | 54 | 64 | 43 |
| co | 470 | 494 | 664 | 640 | 869 | 780 | 480 | 591 | 482 | 449 | 506 | 565 | 559 | 562 | 626 | 980 | 975 | 749 | 929 | 632 |
| no2 | 17 | 26 | 22 | 13 | 27 | 43 | 39 | 38 | 29 | 18 | 14 | 15 | 27 | 31 | 35 | 30 | 44 | 43 | 34 | 40 |
| o3 | 127 | 139 | 109 | 95 | 81 | 71 | 94 | 127 | 149 | 134 | 170 | 204 | 167 | 138 | 125 | 90 | 73 | 61 | 86 | 111 |
| pm10 | 49 | 71 | 68 | 59 | 98 | 96 | 94 | 90 | 49 | 37 | 45 | 47 | 68 | 66 | 81 | 89 | 100 | 84 | 91 | 78 |
| so2 | 4.7 | 7.4 | 5.3 | 3.2 | 4.7 | 8.5 | 5.5 | 9 | 9.9 | 5.6 | 6 | 6.4 | 8.8 | 11 | 12 | 9.4 | 13 | 12 | 8.2 | 11 |