Luftverschmutzung in Taizhou: Echtzeit-Luft-Qualitätsindex und Smog-Alarm.
Für die Taizhou. Heute ist Donnerstag, 4. Juni 2026. Für Taizhou wurden folgende Luftverschmutzungswerte gemessen:- Feinstaub (PM2,5) - 61 (ungesund)
- Stickstoffdioxid (NO2) - 22 (gut)
- Feinstaub (PM10) Schwebestaub - 69 (Ungesund für sensible Gruppen)
- Kohlenmonoxid (CO) - 219 (gut)
- Ozon (O3) - 0 (gut)
- Schwefeldioxid (SO2) - 8 (gut)

Wie ist die Luftqualität Taizhou heute? Ist die Luft in Taizhou? verschmutzt. Gibt es Smog?
Wie hoch ist der aktuelle PM2,5-Wert in Taizhou? (Feinstaub (PM2,5))
Die heutige PM2.5-Stufe ist:
61 (ungesund)
Zum Vergleich: Der höchste PM2,5-Wert in Taizhou in den letzten 7 Tagen war: 28 (Freitag, 27. Mai 2022) und der niedrigste: 28 (Freitag, 27. Mai 2022).
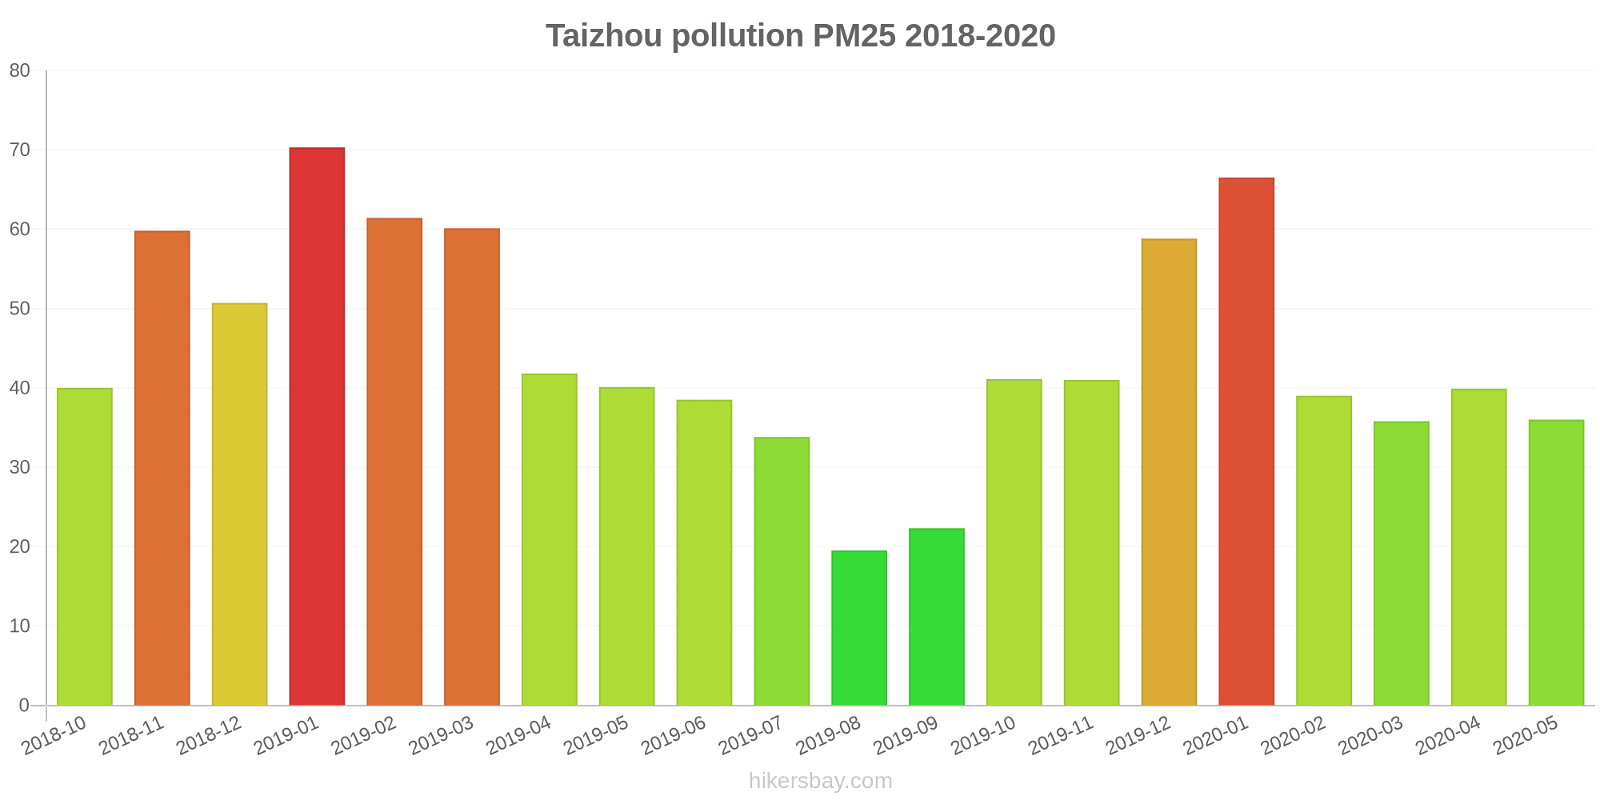
Die höchsten PM2,5-Werte wurden gemessen: 70 (Januar 2019).
Die niedrigste Feinstaubbelastung PM2,5 tritt im Monat auf: August (20).
Wie hoch ist das NO2-Niveau? (Stickstoffdioxid (NO2))
22 (gut)
Wie hoch ist der PM10-Stand heute in Taizhou? (Feinstaub (PM10) Schwebestaub)
Der aktuelle Feinstaubgehalt PM10 in Taizhou is:
69 (Ungesund für sensible Gruppen)
Die höchsten PM10-Werte treten in der Regel im Monat auf: 105 (Januar 2019).
Der niedrigste Wert der Feinstaub-PM10-Belastung in Taizhou ist in der Regel in: August (33).
Wie hoch ist der CO-Gehalt? (Kohlenmonoxid (CO))
219 (gut)
Wie ist das O3-Niveau heute in Taizhou? (Ozon (O3))
0 (gut)
Wie hoch ist die SO2-Belastung? (Schwefeldioxid (SO2))
8 (gut)
Aktuelle Daten Freitag, 27. Mai 2022, 15:00
PM2,5 61 (ungesund)
NO2 22 (gut)
PM10 69 (Ungesund für sensible Gruppen)
CO 219 (gut)
O3 0 (gut)
SO2 8 (gut)
Daten zur Luftverschmutzung der letzten Tage in Taizhou
index
2022-05-27
pm25
28
Moderate
no2
22
Good
pm10
35
Moderate
co
579
Good
o3
22
Good
so2
5
Good
data source »
Luftverschmutzung in Taizhou von Oktober 2018 bis Mai 2020
index
2020-05
2020-04
2020-03
2020-02
2020-01
2019-12
2019-11
2019-10
2019-09
2019-08
2019-07
2019-06
2019-05
2019-04
2019-03
2019-02
2019-01
2018-12
2018-11
2018-10
pm25
36 (Unhealthy for Sensitive Groups)
40 (Unhealthy for Sensitive Groups)
36 (Unhealthy for Sensitive Groups)
39 (Unhealthy for Sensitive Groups)
67 (Unhealthy)
59 (Unhealthy)
41 (Unhealthy for Sensitive Groups)
41 (Unhealthy for Sensitive Groups)
22 (Moderate)
20 (Moderate)
34 (Moderate)
39 (Unhealthy for Sensitive Groups)
40 (Unhealthy for Sensitive Groups)
42 (Unhealthy for Sensitive Groups)
60 (Unhealthy)
61 (Unhealthy)
70 (Unhealthy)
51 (Unhealthy for Sensitive Groups)
60 (Unhealthy)
40 (Unhealthy for Sensitive Groups)
co
873 (Good)
806 (Good)
640 (Good)
821 (Good)
956 (Good)
953 (Good)
605 (Good)
744 (Good)
709 (Good)
732 (Good)
836 (Good)
786 (Good)
690 (Good)
881 (Good)
900 (Good)
1 (Good)
1 (Good)
767 (Good)
1 (Good)
736 (Good)
no2
18 (Good)
25 (Good)
23 (Good)
16 (Good)
24 (Good)
40 (Moderate)
34 (Good)
27 (Good)
14 (Good)
13 (Good)
17 (Good)
16 (Good)
25 (Good)
25 (Good)
32 (Good)
22 (Good)
40 (Moderate)
33 (Good)
34 (Good)
29 (Good)
o3
136 (Unhealthy for Sensitive Groups)
139 (Unhealthy for Sensitive Groups)
113 (Moderate)
97 (Moderate)
79 (Moderate)
82 (Moderate)
108 (Moderate)
131 (Unhealthy for Sensitive Groups)
134 (Unhealthy for Sensitive Groups)
149 (Unhealthy for Sensitive Groups)
162 (Unhealthy)
166 (Unhealthy)
153 (Unhealthy)
122 (Unhealthy for Sensitive Groups)
111 (Moderate)
78 (Moderate)
69 (Good)
63 (Good)
96 (Moderate)
126 (Unhealthy for Sensitive Groups)
pm10
57 (Unhealthy for Sensitive Groups)
67 (Unhealthy for Sensitive Groups)
58 (Unhealthy for Sensitive Groups)
50 (Unhealthy for Sensitive Groups)
79 (Unhealthy for Sensitive Groups)
82 (Unhealthy)
85 (Unhealthy)
79 (Unhealthy for Sensitive Groups)
40 (Moderate)
33 (Moderate)
50 (Moderate)
59 (Unhealthy for Sensitive Groups)
74 (Unhealthy for Sensitive Groups)
67 (Unhealthy for Sensitive Groups)
97 (Unhealthy)
84 (Unhealthy)
105 (Unhealthy)
81 (Unhealthy)
85 (Unhealthy)
70 (Unhealthy for Sensitive Groups)
so2
5.8 (Good)
8.1 (Good)
7.5 (Good)
6.6 (Good)
6.6 (Good)
8.7 (Good)
8.7 (Good)
8.6 (Good)
6.8 (Good)
5.9 (Good)
6 (Good)
6.5 (Good)
8.6 (Good)
7.2 (Good)
11 (Good)
5.7 (Good)
9.7 (Good)
10 (Good)
7.8 (Good)
9.3 (Good)
data source »
公园路
Freitag, 27. Mai 2022, 15:00
PM2,5 61 (ungesund)
Feinstaub (PM2,5)
NO2 22 (gut)
Stickstoffdioxid (NO2)
PM10 69 (Ungesund für sensible Gruppen)
Feinstaub (PM10) Schwebestaub
CO 219 (gut)
Kohlenmonoxid (CO)
O3 0.05 (gut)
Ozon (O3)
SO2 7.7 (gut)
Schwefeldioxid (SO2)
公园路
index
2022-05-27
pm25
28
no2
22
pm10
35
co
579
o3
22
so2
4.6
公园路
2018-10 2020-05

index
2020-05
2020-04
2020-03
2020-02
2020-01
2019-12
2019-11
2019-10
2019-09
2019-08
2019-07
2019-06
2019-05
2019-04
2019-03
2019-02
2019-01
2018-12
2018-11
2018-10
pm25
36
40
36
39
67
59
41
41
22
20
34
39
40
42
60
61
70
51
60
40
co
873
806
640
821
956
953
605
744
709
732
836
786
690
881
900
1
1
767
1
736
no2
18
25
23
16
24
40
34
27
14
13
17
16
25
25
32
22
40
33
34
29
o3
136
139
113
97
79
82
108
131
134
149
162
166
153
122
111
78
69
63
96
126
pm10
57
67
58
50
79
82
85
79
40
33
50
59
74
67
97
84
105
81
85
70
so2
5.8
8.1
7.5
6.6
6.6
8.7
8.7
8.6
6.8
5.9
6
6.5
8.6
7.2
11
5.7
9.7
10
7.8
9.3
* Pollution data source:
https://openaq.org
(ChinaAQIData)
The data is licensed under CC-By 4.0
PM2,5 61 (ungesund)
NO2 22 (gut)
PM10 69 (Ungesund für sensible Gruppen)
CO 219 (gut)
O3 0 (gut)
SO2 8 (gut)
Daten zur Luftverschmutzung der letzten Tage in Taizhou
| index | 2022-05-27 |
|---|---|
| pm25 | 28 Moderate |
| no2 | 22 Good |
| pm10 | 35 Moderate |
| co | 579 Good |
| o3 | 22 Good |
| so2 | 5 Good |

| index | 2020-05 | 2020-04 | 2020-03 | 2020-02 | 2020-01 | 2019-12 | 2019-11 | 2019-10 | 2019-09 | 2019-08 | 2019-07 | 2019-06 | 2019-05 | 2019-04 | 2019-03 | 2019-02 | 2019-01 | 2018-12 | 2018-11 | 2018-10 |
|---|---|---|---|---|---|---|---|---|---|---|---|---|---|---|---|---|---|---|---|---|
| pm25 | 36 (Unhealthy for Sensitive Groups) | 40 (Unhealthy for Sensitive Groups) | 36 (Unhealthy for Sensitive Groups) | 39 (Unhealthy for Sensitive Groups) | 67 (Unhealthy) | 59 (Unhealthy) | 41 (Unhealthy for Sensitive Groups) | 41 (Unhealthy for Sensitive Groups) | 22 (Moderate) | 20 (Moderate) | 34 (Moderate) | 39 (Unhealthy for Sensitive Groups) | 40 (Unhealthy for Sensitive Groups) | 42 (Unhealthy for Sensitive Groups) | 60 (Unhealthy) | 61 (Unhealthy) | 70 (Unhealthy) | 51 (Unhealthy for Sensitive Groups) | 60 (Unhealthy) | 40 (Unhealthy for Sensitive Groups) |
| co | 873 (Good) | 806 (Good) | 640 (Good) | 821 (Good) | 956 (Good) | 953 (Good) | 605 (Good) | 744 (Good) | 709 (Good) | 732 (Good) | 836 (Good) | 786 (Good) | 690 (Good) | 881 (Good) | 900 (Good) | 1 (Good) | 1 (Good) | 767 (Good) | 1 (Good) | 736 (Good) |
| no2 | 18 (Good) | 25 (Good) | 23 (Good) | 16 (Good) | 24 (Good) | 40 (Moderate) | 34 (Good) | 27 (Good) | 14 (Good) | 13 (Good) | 17 (Good) | 16 (Good) | 25 (Good) | 25 (Good) | 32 (Good) | 22 (Good) | 40 (Moderate) | 33 (Good) | 34 (Good) | 29 (Good) |
| o3 | 136 (Unhealthy for Sensitive Groups) | 139 (Unhealthy for Sensitive Groups) | 113 (Moderate) | 97 (Moderate) | 79 (Moderate) | 82 (Moderate) | 108 (Moderate) | 131 (Unhealthy for Sensitive Groups) | 134 (Unhealthy for Sensitive Groups) | 149 (Unhealthy for Sensitive Groups) | 162 (Unhealthy) | 166 (Unhealthy) | 153 (Unhealthy) | 122 (Unhealthy for Sensitive Groups) | 111 (Moderate) | 78 (Moderate) | 69 (Good) | 63 (Good) | 96 (Moderate) | 126 (Unhealthy for Sensitive Groups) |
| pm10 | 57 (Unhealthy for Sensitive Groups) | 67 (Unhealthy for Sensitive Groups) | 58 (Unhealthy for Sensitive Groups) | 50 (Unhealthy for Sensitive Groups) | 79 (Unhealthy for Sensitive Groups) | 82 (Unhealthy) | 85 (Unhealthy) | 79 (Unhealthy for Sensitive Groups) | 40 (Moderate) | 33 (Moderate) | 50 (Moderate) | 59 (Unhealthy for Sensitive Groups) | 74 (Unhealthy for Sensitive Groups) | 67 (Unhealthy for Sensitive Groups) | 97 (Unhealthy) | 84 (Unhealthy) | 105 (Unhealthy) | 81 (Unhealthy) | 85 (Unhealthy) | 70 (Unhealthy for Sensitive Groups) |
| so2 | 5.8 (Good) | 8.1 (Good) | 7.5 (Good) | 6.6 (Good) | 6.6 (Good) | 8.7 (Good) | 8.7 (Good) | 8.6 (Good) | 6.8 (Good) | 5.9 (Good) | 6 (Good) | 6.5 (Good) | 8.6 (Good) | 7.2 (Good) | 11 (Good) | 5.7 (Good) | 9.7 (Good) | 10 (Good) | 7.8 (Good) | 9.3 (Good) |
PM2,5 61 (ungesund)
Feinstaub (PM2,5)NO2 22 (gut)
Stickstoffdioxid (NO2)PM10 69 (Ungesund für sensible Gruppen)
Feinstaub (PM10) SchwebestaubCO 219 (gut)
Kohlenmonoxid (CO)O3 0.05 (gut)
Ozon (O3)SO2 7.7 (gut)
Schwefeldioxid (SO2)公园路
| index | 2022-05-27 |
|---|---|
| pm25 | 28 |
| no2 | 22 |
| pm10 | 35 |
| co | 579 |
| o3 | 22 |
| so2 | 4.6 |
公园路

| index | 2020-05 | 2020-04 | 2020-03 | 2020-02 | 2020-01 | 2019-12 | 2019-11 | 2019-10 | 2019-09 | 2019-08 | 2019-07 | 2019-06 | 2019-05 | 2019-04 | 2019-03 | 2019-02 | 2019-01 | 2018-12 | 2018-11 | 2018-10 |
|---|---|---|---|---|---|---|---|---|---|---|---|---|---|---|---|---|---|---|---|---|
| pm25 | 36 | 40 | 36 | 39 | 67 | 59 | 41 | 41 | 22 | 20 | 34 | 39 | 40 | 42 | 60 | 61 | 70 | 51 | 60 | 40 |
| co | 873 | 806 | 640 | 821 | 956 | 953 | 605 | 744 | 709 | 732 | 836 | 786 | 690 | 881 | 900 | 1 | 1 | 767 | 1 | 736 |
| no2 | 18 | 25 | 23 | 16 | 24 | 40 | 34 | 27 | 14 | 13 | 17 | 16 | 25 | 25 | 32 | 22 | 40 | 33 | 34 | 29 |
| o3 | 136 | 139 | 113 | 97 | 79 | 82 | 108 | 131 | 134 | 149 | 162 | 166 | 153 | 122 | 111 | 78 | 69 | 63 | 96 | 126 |
| pm10 | 57 | 67 | 58 | 50 | 79 | 82 | 85 | 79 | 40 | 33 | 50 | 59 | 74 | 67 | 97 | 84 | 105 | 81 | 85 | 70 |
| so2 | 5.8 | 8.1 | 7.5 | 6.6 | 6.6 | 8.7 | 8.7 | 8.6 | 6.8 | 5.9 | 6 | 6.5 | 8.6 | 7.2 | 11 | 5.7 | 9.7 | 10 | 7.8 | 9.3 |