Luftverschmutzung in Houchawancun: Echtzeit-Luft-Qualitätsindex und Smog-Alarm.
Für die Houchawancun. Heute ist Donnerstag, 4. Juni 2026. Für Houchawancun wurden folgende Luftverschmutzungswerte gemessen:- Feinstaub (PM10) Schwebestaub - 53 (Ungesund für sensible Gruppen)
- Ozon (O3) - 0 (gut)
- Feinstaub (PM2,5) - 7 (gut)
- Schwefeldioxid (SO2) - 18 (gut)
- Stickstoffdioxid (NO2) - 3 (gut)
- Kohlenmonoxid (CO) - 1 (gut)

Wie ist die Luftqualität Houchawancun heute? Ist die Luft in Houchawancun? verschmutzt. Gibt es Smog?
Wie hoch ist der PM10-Stand heute in Houchawancun? (Feinstaub (PM10) Schwebestaub)
Der aktuelle Feinstaubgehalt PM10 in Houchawancun is:
53 (Ungesund für sensible Gruppen)
Die höchsten PM10-Werte treten in der Regel im Monat auf: 132 (Januar 2019).
Der niedrigste Wert der Feinstaub-PM10-Belastung in Houchawancun ist in der Regel in: August (35).
Wie ist das O3-Niveau heute in Houchawancun? (Ozon (O3))
0 (gut)
Wie hoch ist der aktuelle PM2,5-Wert in Houchawancun? (Feinstaub (PM2,5))
Die heutige PM2.5-Stufe ist:
7 (gut)
Zum Vergleich: Der höchste PM2,5-Wert in Houchawancun in den letzten 7 Tagen war: 21 (Freitag, 27. Mai 2022) und der niedrigste: 21 (Freitag, 27. Mai 2022).
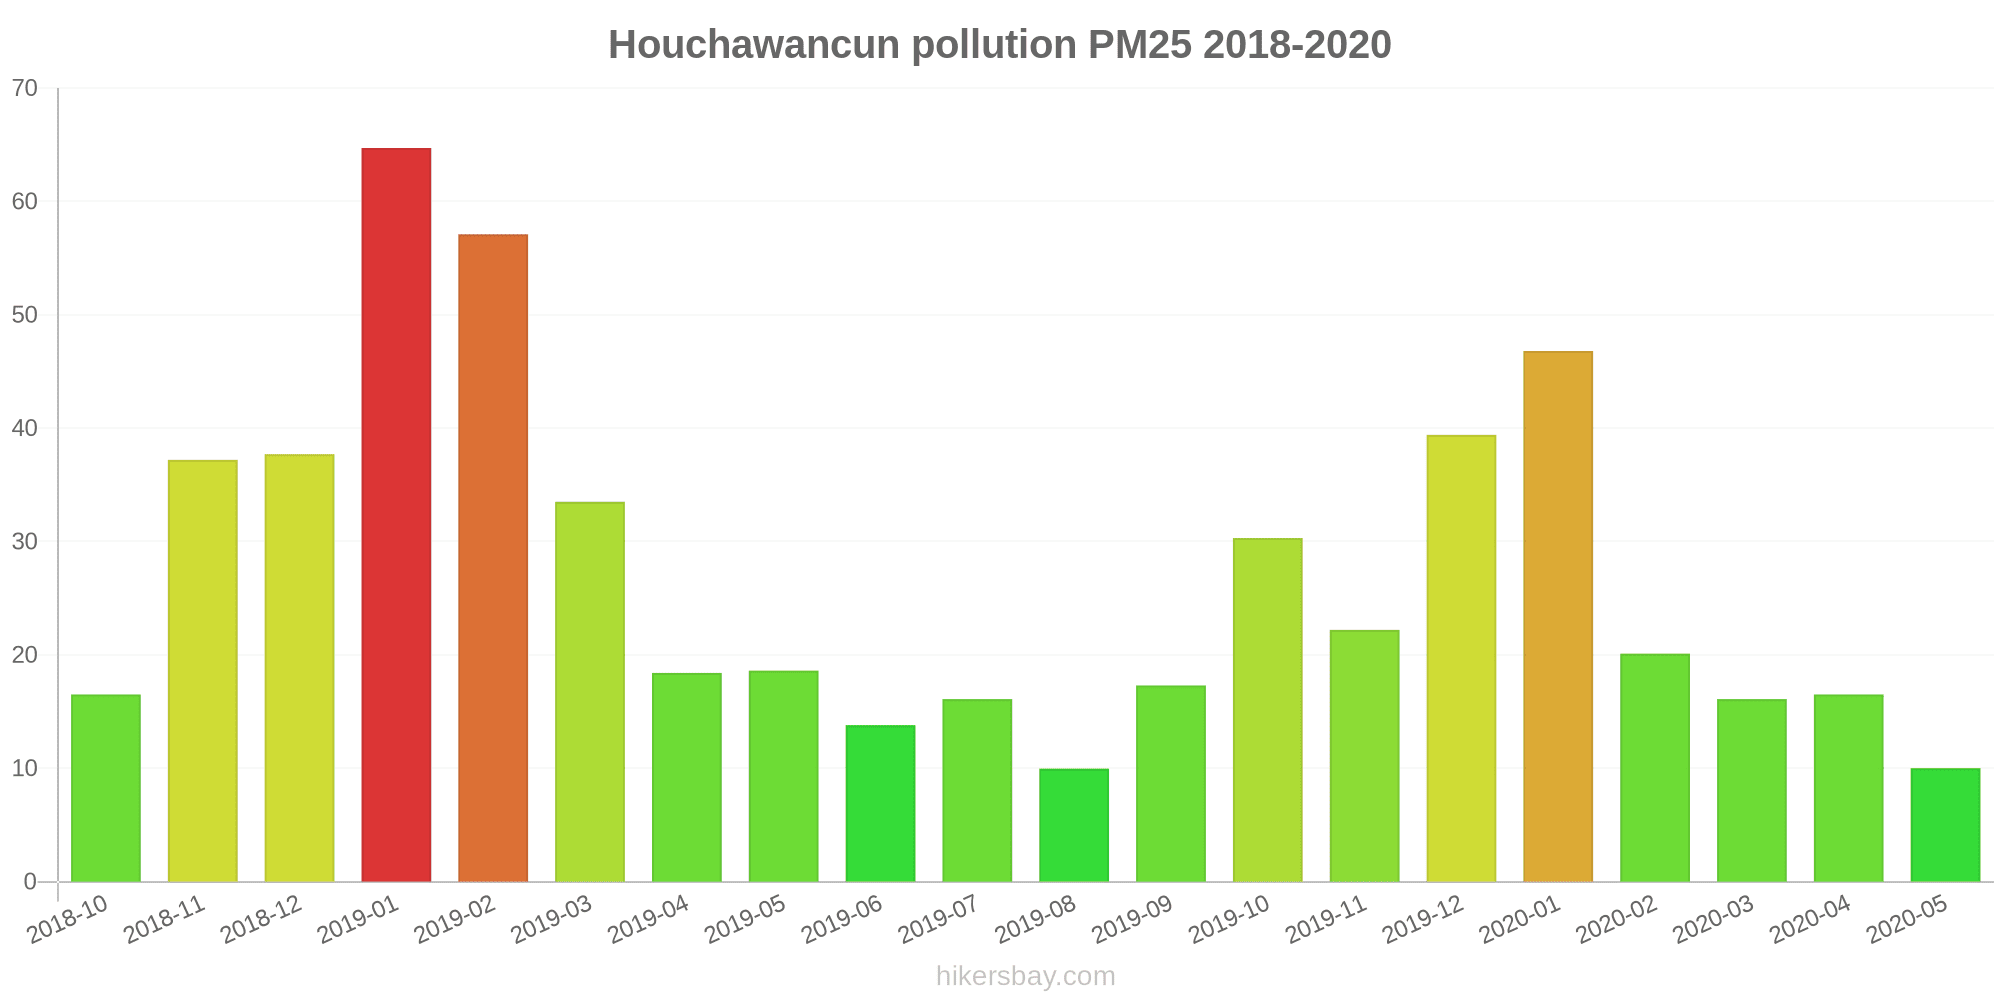
Die höchsten PM2,5-Werte wurden gemessen: 65 (Januar 2019).
Die niedrigste Feinstaubbelastung PM2,5 tritt im Monat auf: August (10).
Wie hoch ist die SO2-Belastung? (Schwefeldioxid (SO2))
18 (gut)
Wie hoch ist das NO2-Niveau? (Stickstoffdioxid (NO2))
3 (gut)
Wie hoch ist der CO-Gehalt? (Kohlenmonoxid (CO))
1 (gut)
Aktuelle Daten Freitag, 27. Mai 2022, 12:00
PM10 53 (Ungesund für sensible Gruppen)
O3 0 (gut)
PM2,5 7 (gut)
SO2 18 (gut)
NO2 3 (gut)
CO 1 (gut)
Daten zur Luftverschmutzung der letzten Tage in Houchawancun
index
2022-05-27
pm10
51
Unhealthy for Sensitive Groups
o3
0
Good
pm25
21
Moderate
so2
10
Good
no2
0
Good
co
1
Good
data source »
Luftverschmutzung in Houchawancun von Oktober 2018 bis Mai 2020

index
2020-05
2020-04
2020-03
2020-02
2020-01
2019-12
2019-11
2019-10
2019-09
2019-08
2019-07
2019-06
2019-05
2019-04
2019-03
2019-02
2019-01
2018-12
2018-11
2018-10
pm25
10 (Good)
17 (Moderate)
16 (Moderate)
20 (Moderate)
47 (Unhealthy for Sensitive Groups)
39 (Unhealthy for Sensitive Groups)
22 (Moderate)
30 (Moderate)
17 (Moderate)
10 (Good)
16 (Moderate)
14 (Moderate)
19 (Moderate)
18 (Moderate)
34 (Moderate)
57 (Unhealthy)
65 (Unhealthy)
38 (Unhealthy for Sensitive Groups)
37 (Unhealthy for Sensitive Groups)
17 (Moderate)
co
556 (Good)
643 (Good)
593 (Good)
789 (Good)
979 (Good)
892 (Good)
677 (Good)
803 (Good)
614 (Good)
474 (Good)
634 (Good)
560 (Good)
620 (Good)
584 (Good)
806 (Good)
1 (Good)
1 (Good)
996 (Good)
877 (Good)
583 (Good)
no2
23 (Good)
35 (Good)
28 (Good)
21 (Good)
45 (Moderate)
40 (Moderate)
32 (Good)
38 (Good)
22 (Good)
19 (Good)
22 (Good)
16 (Good)
28 (Good)
25 (Good)
37 (Good)
36 (Good)
53 (Moderate)
41 (Moderate)
40 (Moderate)
37 (Good)
o3
131 (Unhealthy for Sensitive Groups)
138 (Unhealthy for Sensitive Groups)
106 (Moderate)
89 (Moderate)
75 (Moderate)
65 (Good)
87 (Moderate)
127 (Unhealthy for Sensitive Groups)
164 (Unhealthy)
130 (Unhealthy for Sensitive Groups)
139 (Unhealthy for Sensitive Groups)
136 (Unhealthy for Sensitive Groups)
159 (Unhealthy)
120 (Unhealthy for Sensitive Groups)
104 (Moderate)
86 (Moderate)
72 (Moderate)
66 (Good)
101 (Moderate)
115 (Moderate)
pm10
49 (Moderate)
74 (Unhealthy for Sensitive Groups)
65 (Unhealthy for Sensitive Groups)
48 (Moderate)
105 (Unhealthy)
88 (Unhealthy)
78 (Unhealthy for Sensitive Groups)
96 (Unhealthy)
50 (Unhealthy for Sensitive Groups)
35 (Moderate)
40 (Moderate)
36 (Moderate)
67 (Unhealthy for Sensitive Groups)
58 (Unhealthy for Sensitive Groups)
86 (Unhealthy)
109 (Unhealthy)
132 (Very Unhealthy)
95 (Unhealthy)
100 (Unhealthy)
55 (Unhealthy for Sensitive Groups)
so2
5.2 (Good)
7.3 (Good)
5.6 (Good)
4.4 (Good)
10 (Good)
8.1 (Good)
6.5 (Good)
6.9 (Good)
8.2 (Good)
7.4 (Good)
6.2 (Good)
5.8 (Good)
8.1 (Good)
5.6 (Good)
8 (Good)
10 (Good)
16 (Good)
15 (Good)
13 (Good)
12 (Good)
data source »
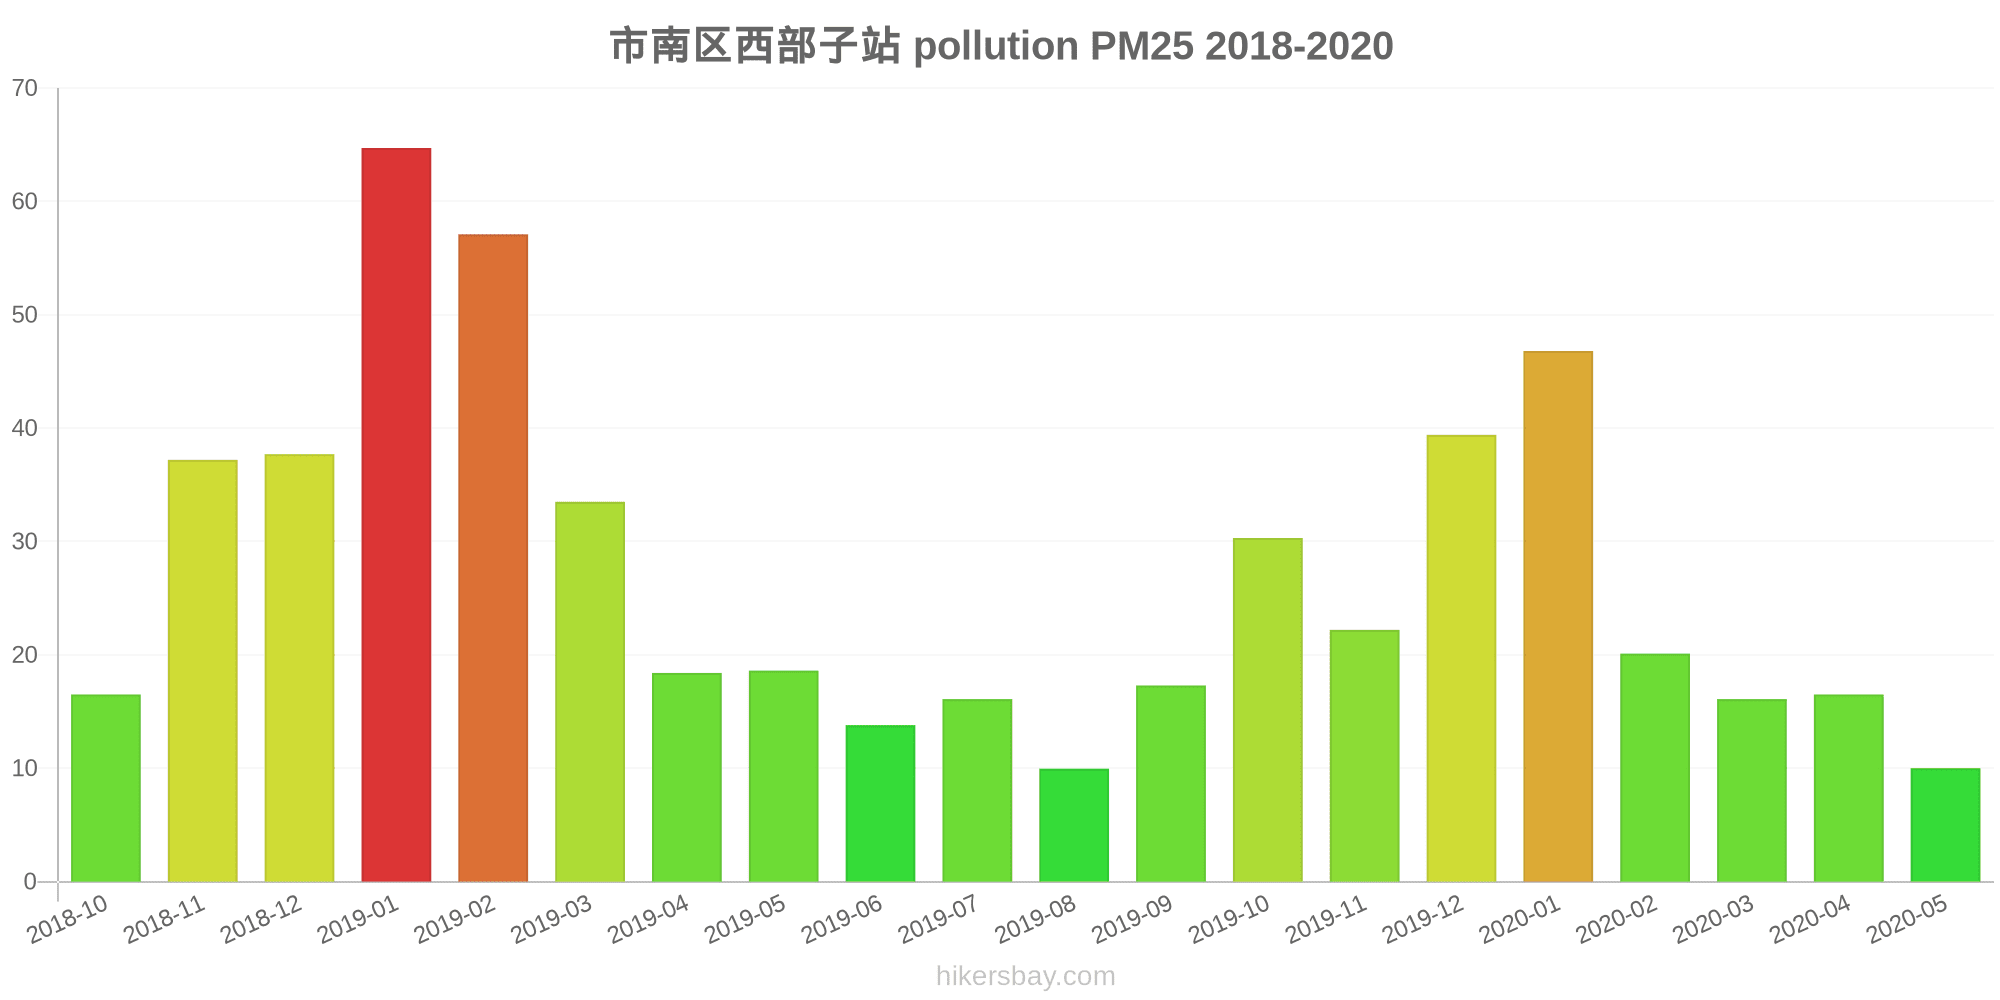
市南区西部子站
Freitag, 27. Mai 2022, 12:00
PM10 53 (Ungesund für sensible Gruppen)
Feinstaub (PM10) Schwebestaub
O3 0.02 (gut)
Ozon (O3)
PM2,5 6.6 (gut)
Feinstaub (PM2,5)
SO2 18 (gut)
Schwefeldioxid (SO2)
NO2 3 (gut)
Stickstoffdioxid (NO2)
CO 1.3 (gut)
Kohlenmonoxid (CO)
市南区西部子站
index
2022-05-27
pm10
51
o3
0.02
pm25
21
so2
9.6
no2
0.38
co
0.64
市南区西部子站
2018-10 2020-05

index
2020-05
2020-04
2020-03
2020-02
2020-01
2019-12
2019-11
2019-10
2019-09
2019-08
2019-07
2019-06
2019-05
2019-04
2019-03
2019-02
2019-01
2018-12
2018-11
2018-10
pm25
10
17
16
20
47
39
22
30
17
10
16
14
19
18
34
57
65
38
37
17
co
556
643
593
789
979
892
677
803
614
474
634
560
620
584
806
1
1
996
877
583
no2
23
35
28
21
45
40
32
38
22
19
22
16
28
25
37
36
53
41
40
37
o3
131
138
106
89
75
65
87
127
164
130
139
136
159
120
104
86
72
66
101
115
pm10
49
74
65
48
105
88
78
96
50
35
40
36
67
58
86
109
132
95
100
55
so2
5.2
7.3
5.6
4.4
10
8.1
6.5
6.9
8.2
7.4
6.2
5.8
8.1
5.6
8
10
16
15
13
12
* Pollution data source:
https://openaq.org
(ChinaAQIData)
The data is licensed under CC-By 4.0
PM10 53 (Ungesund für sensible Gruppen)
O3 0 (gut)
PM2,5 7 (gut)
SO2 18 (gut)
NO2 3 (gut)
CO 1 (gut)
Daten zur Luftverschmutzung der letzten Tage in Houchawancun
| index | 2022-05-27 |
|---|---|
| pm10 | 51 Unhealthy for Sensitive Groups |
| o3 | 0 Good |
| pm25 | 21 Moderate |
| so2 | 10 Good |
| no2 | 0 Good |
| co | 1 Good |
| index | 2020-05 | 2020-04 | 2020-03 | 2020-02 | 2020-01 | 2019-12 | 2019-11 | 2019-10 | 2019-09 | 2019-08 | 2019-07 | 2019-06 | 2019-05 | 2019-04 | 2019-03 | 2019-02 | 2019-01 | 2018-12 | 2018-11 | 2018-10 |
|---|---|---|---|---|---|---|---|---|---|---|---|---|---|---|---|---|---|---|---|---|
| pm25 | 10 (Good) | 17 (Moderate) | 16 (Moderate) | 20 (Moderate) | 47 (Unhealthy for Sensitive Groups) | 39 (Unhealthy for Sensitive Groups) | 22 (Moderate) | 30 (Moderate) | 17 (Moderate) | 10 (Good) | 16 (Moderate) | 14 (Moderate) | 19 (Moderate) | 18 (Moderate) | 34 (Moderate) | 57 (Unhealthy) | 65 (Unhealthy) | 38 (Unhealthy for Sensitive Groups) | 37 (Unhealthy for Sensitive Groups) | 17 (Moderate) |
| co | 556 (Good) | 643 (Good) | 593 (Good) | 789 (Good) | 979 (Good) | 892 (Good) | 677 (Good) | 803 (Good) | 614 (Good) | 474 (Good) | 634 (Good) | 560 (Good) | 620 (Good) | 584 (Good) | 806 (Good) | 1 (Good) | 1 (Good) | 996 (Good) | 877 (Good) | 583 (Good) |
| no2 | 23 (Good) | 35 (Good) | 28 (Good) | 21 (Good) | 45 (Moderate) | 40 (Moderate) | 32 (Good) | 38 (Good) | 22 (Good) | 19 (Good) | 22 (Good) | 16 (Good) | 28 (Good) | 25 (Good) | 37 (Good) | 36 (Good) | 53 (Moderate) | 41 (Moderate) | 40 (Moderate) | 37 (Good) |
| o3 | 131 (Unhealthy for Sensitive Groups) | 138 (Unhealthy for Sensitive Groups) | 106 (Moderate) | 89 (Moderate) | 75 (Moderate) | 65 (Good) | 87 (Moderate) | 127 (Unhealthy for Sensitive Groups) | 164 (Unhealthy) | 130 (Unhealthy for Sensitive Groups) | 139 (Unhealthy for Sensitive Groups) | 136 (Unhealthy for Sensitive Groups) | 159 (Unhealthy) | 120 (Unhealthy for Sensitive Groups) | 104 (Moderate) | 86 (Moderate) | 72 (Moderate) | 66 (Good) | 101 (Moderate) | 115 (Moderate) |
| pm10 | 49 (Moderate) | 74 (Unhealthy for Sensitive Groups) | 65 (Unhealthy for Sensitive Groups) | 48 (Moderate) | 105 (Unhealthy) | 88 (Unhealthy) | 78 (Unhealthy for Sensitive Groups) | 96 (Unhealthy) | 50 (Unhealthy for Sensitive Groups) | 35 (Moderate) | 40 (Moderate) | 36 (Moderate) | 67 (Unhealthy for Sensitive Groups) | 58 (Unhealthy for Sensitive Groups) | 86 (Unhealthy) | 109 (Unhealthy) | 132 (Very Unhealthy) | 95 (Unhealthy) | 100 (Unhealthy) | 55 (Unhealthy for Sensitive Groups) |
| so2 | 5.2 (Good) | 7.3 (Good) | 5.6 (Good) | 4.4 (Good) | 10 (Good) | 8.1 (Good) | 6.5 (Good) | 6.9 (Good) | 8.2 (Good) | 7.4 (Good) | 6.2 (Good) | 5.8 (Good) | 8.1 (Good) | 5.6 (Good) | 8 (Good) | 10 (Good) | 16 (Good) | 15 (Good) | 13 (Good) | 12 (Good) |
PM10 53 (Ungesund für sensible Gruppen)
Feinstaub (PM10) SchwebestaubO3 0.02 (gut)
Ozon (O3)PM2,5 6.6 (gut)
Feinstaub (PM2,5)SO2 18 (gut)
Schwefeldioxid (SO2)NO2 3 (gut)
Stickstoffdioxid (NO2)CO 1.3 (gut)
Kohlenmonoxid (CO)市南区西部子站
| index | 2022-05-27 |
|---|---|
| pm10 | 51 |
| o3 | 0.02 |
| pm25 | 21 |
| so2 | 9.6 |
| no2 | 0.38 |
| co | 0.64 |
市南区西部子站
| index | 2020-05 | 2020-04 | 2020-03 | 2020-02 | 2020-01 | 2019-12 | 2019-11 | 2019-10 | 2019-09 | 2019-08 | 2019-07 | 2019-06 | 2019-05 | 2019-04 | 2019-03 | 2019-02 | 2019-01 | 2018-12 | 2018-11 | 2018-10 |
|---|---|---|---|---|---|---|---|---|---|---|---|---|---|---|---|---|---|---|---|---|
| pm25 | 10 | 17 | 16 | 20 | 47 | 39 | 22 | 30 | 17 | 10 | 16 | 14 | 19 | 18 | 34 | 57 | 65 | 38 | 37 | 17 |
| co | 556 | 643 | 593 | 789 | 979 | 892 | 677 | 803 | 614 | 474 | 634 | 560 | 620 | 584 | 806 | 1 | 1 | 996 | 877 | 583 |
| no2 | 23 | 35 | 28 | 21 | 45 | 40 | 32 | 38 | 22 | 19 | 22 | 16 | 28 | 25 | 37 | 36 | 53 | 41 | 40 | 37 |
| o3 | 131 | 138 | 106 | 89 | 75 | 65 | 87 | 127 | 164 | 130 | 139 | 136 | 159 | 120 | 104 | 86 | 72 | 66 | 101 | 115 |
| pm10 | 49 | 74 | 65 | 48 | 105 | 88 | 78 | 96 | 50 | 35 | 40 | 36 | 67 | 58 | 86 | 109 | 132 | 95 | 100 | 55 |
| so2 | 5.2 | 7.3 | 5.6 | 4.4 | 10 | 8.1 | 6.5 | 6.9 | 8.2 | 7.4 | 6.2 | 5.8 | 8.1 | 5.6 | 8 | 10 | 16 | 15 | 13 | 12 |