Luftverschmutzung in Hongshan: Echtzeit-Luft-Qualitätsindex und Smog-Alarm.
Für die Hongshan. Heute ist Donnerstag, 4. Juni 2026. Für Hongshan wurden folgende Luftverschmutzungswerte gemessen:- Feinstaub (PM10) Schwebestaub - 53 (Ungesund für sensible Gruppen)
- Ozon (O3) - 0 (gut)
- Feinstaub (PM2,5) - 7 (gut)
- Schwefeldioxid (SO2) - 18 (gut)
- Stickstoffdioxid (NO2) - 3 (gut)
- Kohlenmonoxid (CO) - 1 (gut)

Wie ist die Luftqualität Hongshan heute? Ist die Luft in Hongshan? verschmutzt. Gibt es Smog?
Wie hoch ist der PM10-Stand heute in Hongshan? (Feinstaub (PM10) Schwebestaub)
Der aktuelle Feinstaubgehalt PM10 in Hongshan is:
53 (Ungesund für sensible Gruppen)
Die höchsten PM10-Werte treten in der Regel im Monat auf: 175 (Januar 2019).
Der niedrigste Wert der Feinstaub-PM10-Belastung in Hongshan ist in der Regel in: Juli (48).
Wie ist das O3-Niveau heute in Hongshan? (Ozon (O3))
0 (gut)
Wie hoch ist der aktuelle PM2,5-Wert in Hongshan? (Feinstaub (PM2,5))
Die heutige PM2.5-Stufe ist:
7 (gut)
Zum Vergleich: Der höchste PM2,5-Wert in Hongshan in den letzten 7 Tagen war: 21 (Freitag, 27. Mai 2022) und der niedrigste: 21 (Freitag, 27. Mai 2022).
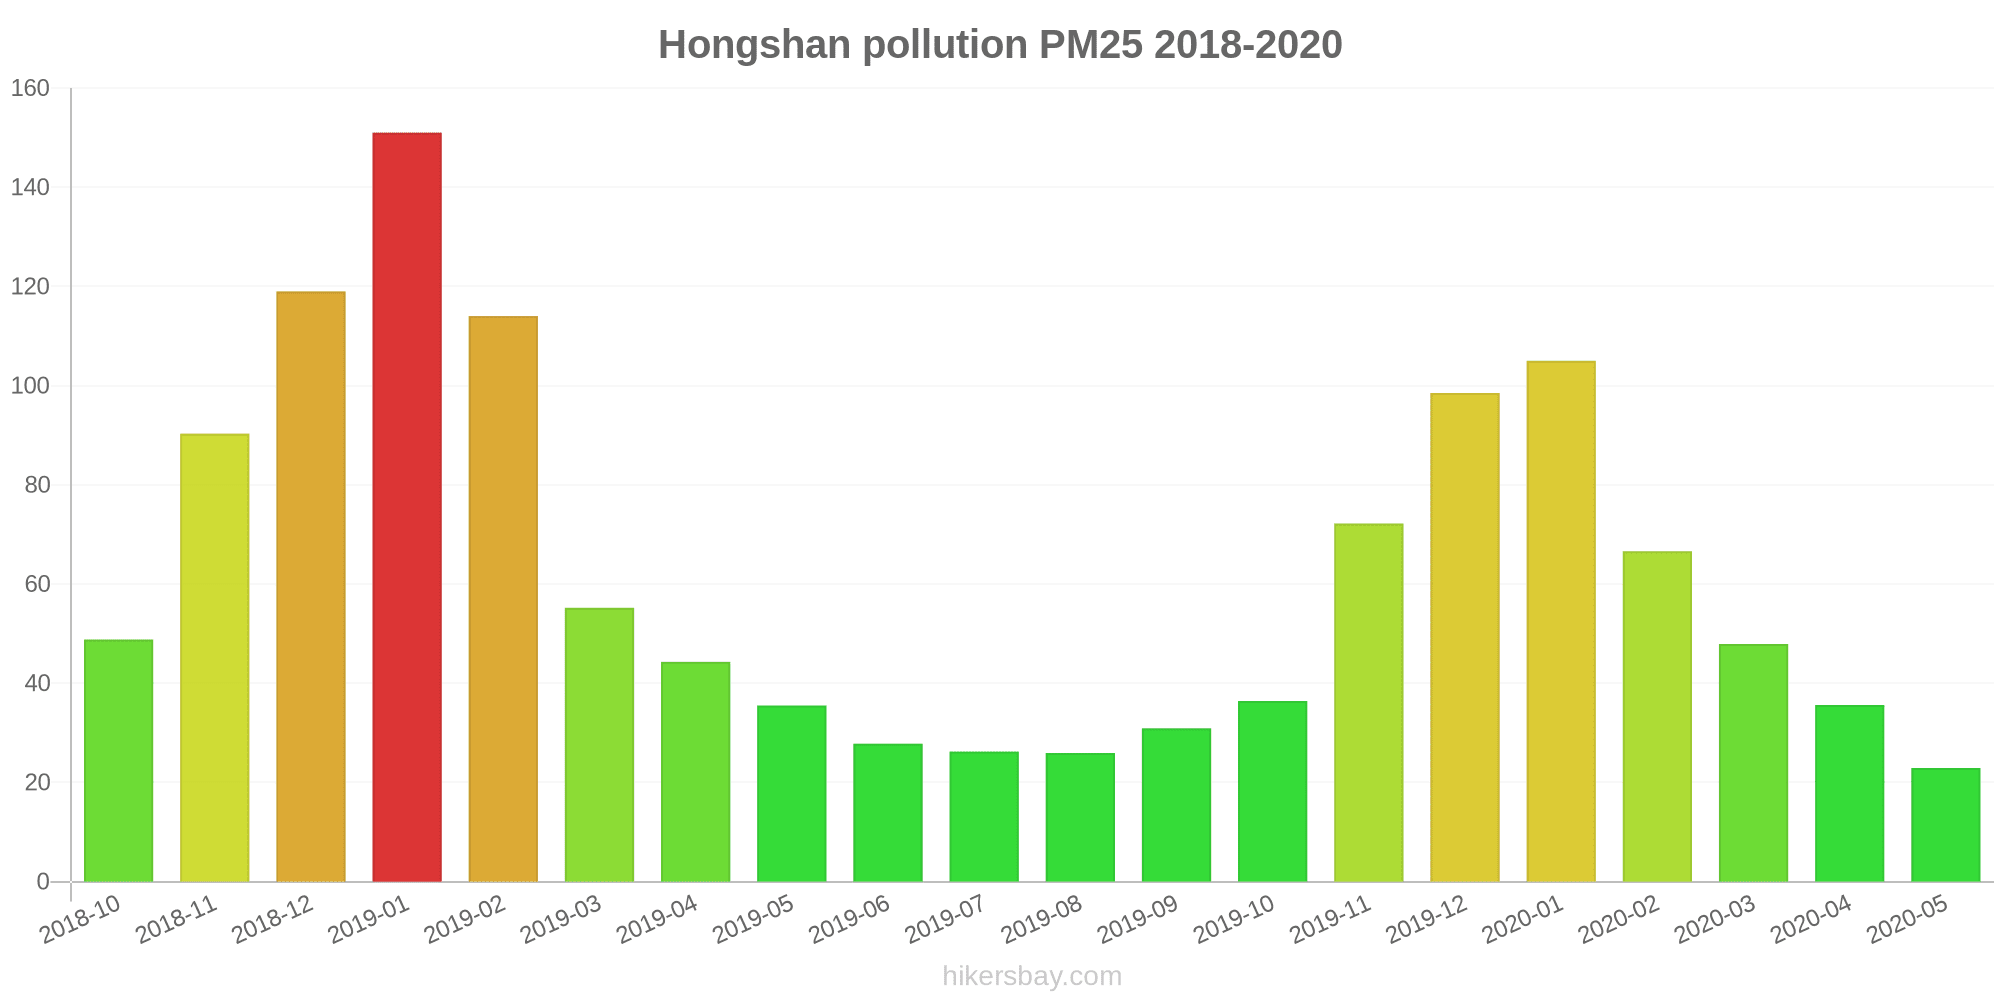
Die höchsten PM2,5-Werte wurden gemessen: 151 (Januar 2019).
Die niedrigste Feinstaubbelastung PM2,5 tritt im Monat auf: Mai (23).
Wie hoch ist die SO2-Belastung? (Schwefeldioxid (SO2))
18 (gut)
Wie hoch ist das NO2-Niveau? (Stickstoffdioxid (NO2))
3 (gut)
Wie hoch ist der CO-Gehalt? (Kohlenmonoxid (CO))
1 (gut)
Aktuelle Daten Freitag, 27. Mai 2022, 12:00
PM10 53 (Ungesund für sensible Gruppen)
O3 0 (gut)
PM2,5 7 (gut)
SO2 18 (gut)
NO2 3 (gut)
CO 1 (gut)
Daten zur Luftverschmutzung der letzten Tage in Hongshan
index
2022-05-27
pm10
51
Unhealthy for Sensitive Groups
o3
0
Good
pm25
21
Moderate
so2
10
Good
no2
0
Good
co
1
Good
data source »
Luftverschmutzung in Hongshan von Oktober 2018 bis Mai 2020

index
2020-05
2020-04
2020-03
2020-02
2020-01
2019-12
2019-11
2019-10
2019-09
2019-08
2019-07
2019-06
2019-05
2019-04
2019-03
2019-02
2019-01
2018-12
2018-11
2018-10
pm25
23 (Moderate)
36 (Unhealthy for Sensitive Groups)
48 (Unhealthy for Sensitive Groups)
67 (Unhealthy)
105 (Very Unhealthy)
99 (Very Unhealthy)
72 (Unhealthy)
36 (Unhealthy for Sensitive Groups)
31 (Moderate)
26 (Moderate)
26 (Moderate)
28 (Moderate)
36 (Unhealthy for Sensitive Groups)
44 (Unhealthy for Sensitive Groups)
55 (Unhealthy)
114 (Very bad Hazardous)
151 (Very bad Hazardous)
119 (Very bad Hazardous)
90 (Very Unhealthy)
49 (Unhealthy for Sensitive Groups)
co
725 (Good)
712 (Good)
785 (Good)
966 (Good)
1 (Good)
1 (Good)
979 (Good)
906 (Good)
701 (Good)
827 (Good)
684 (Good)
680 (Good)
784 (Good)
939 (Good)
737 (Good)
1 (Good)
1 (Good)
1 (Good)
1 (Good)
897 (Good)
no2
20 (Good)
31 (Good)
24 (Good)
14 (Good)
31 (Good)
43 (Moderate)
39 (Good)
31 (Good)
23 (Good)
17 (Good)
17 (Good)
19 (Good)
22 (Good)
26 (Good)
37 (Good)
35 (Good)
56 (Moderate)
54 (Moderate)
49 (Moderate)
47 (Moderate)
o3
142 (Unhealthy for Sensitive Groups)
136 (Unhealthy for Sensitive Groups)
113 (Moderate)
90 (Moderate)
73 (Moderate)
56 (Good)
98 (Moderate)
112 (Moderate)
165 (Unhealthy)
166 (Unhealthy)
171 (Unhealthy)
177 (Unhealthy)
152 (Unhealthy)
126 (Unhealthy for Sensitive Groups)
117 (Moderate)
86 (Moderate)
59 (Good)
54 (Good)
89 (Moderate)
120 (Unhealthy for Sensitive Groups)
pm10
63 (Unhealthy for Sensitive Groups)
82 (Unhealthy)
96 (Unhealthy)
84 (Unhealthy)
127 (Very Unhealthy)
139 (Very Unhealthy)
128 (Very Unhealthy)
77 (Unhealthy for Sensitive Groups)
59 (Unhealthy for Sensitive Groups)
51 (Unhealthy for Sensitive Groups)
48 (Moderate)
54 (Unhealthy for Sensitive Groups)
81 (Unhealthy)
86 (Unhealthy)
92 (Unhealthy)
124 (Very Unhealthy)
175 (Very bad Hazardous)
156 (Very bad Hazardous)
124 (Very Unhealthy)
90 (Unhealthy)
so2
9.3 (Good)
9.9 (Good)
8.1 (Good)
8.1 (Good)
9.3 (Good)
11 (Good)
9.5 (Good)
8.6 (Good)
7.6 (Good)
5.5 (Good)
6.2 (Good)
5.7 (Good)
5.2 (Good)
6.2 (Good)
7.3 (Good)
8 (Good)
8.7 (Good)
9.6 (Good)
9.1 (Good)
7.4 (Good)
data source »
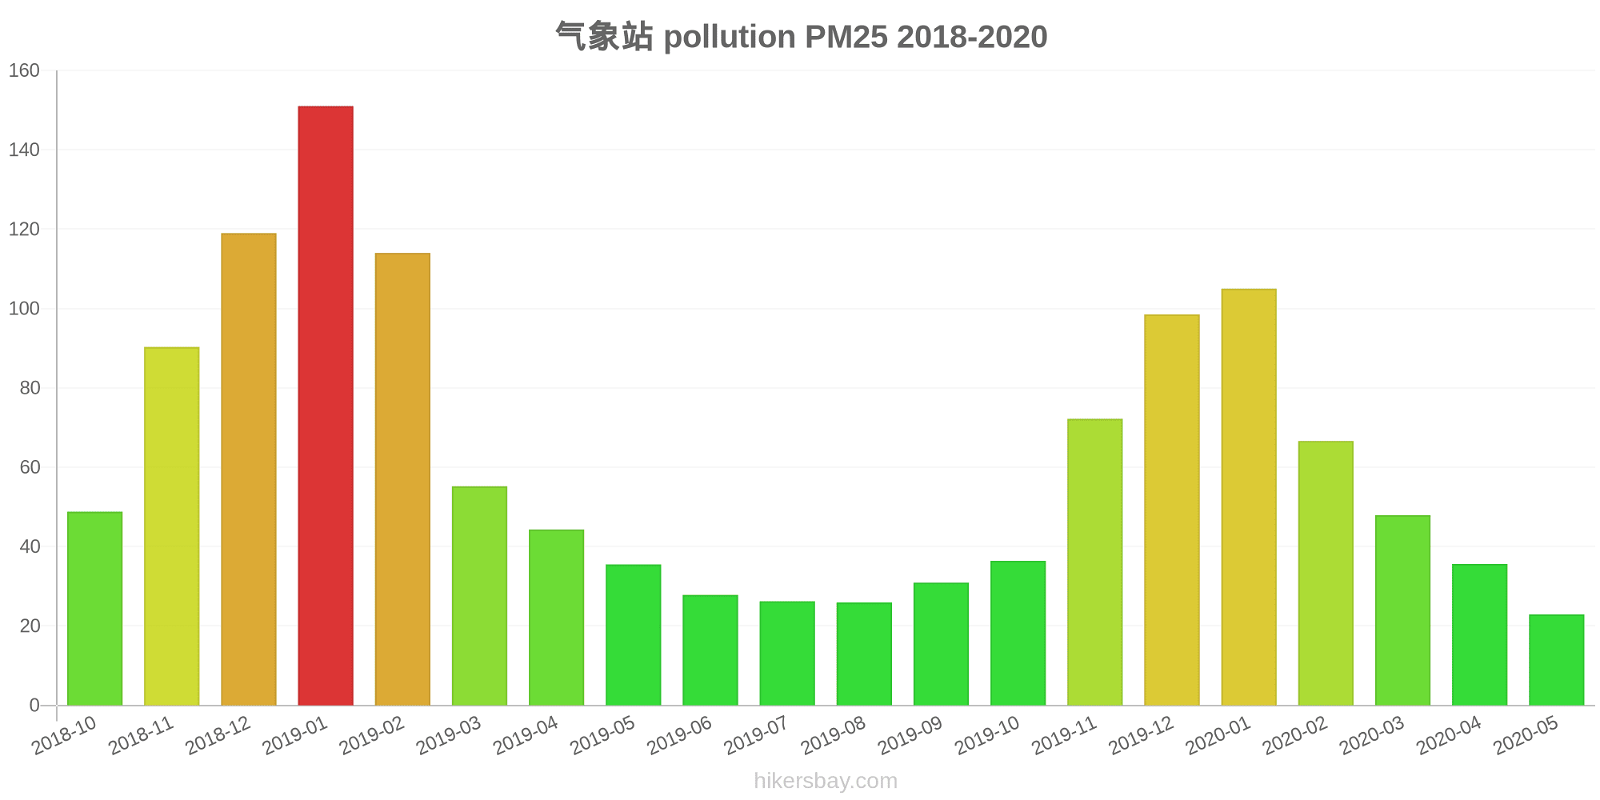
气象站
Freitag, 27. Mai 2022, 12:00
PM10 53 (Ungesund für sensible Gruppen)
Feinstaub (PM10) Schwebestaub
O3 0.02 (gut)
Ozon (O3)
PM2,5 6.6 (gut)
Feinstaub (PM2,5)
SO2 18 (gut)
Schwefeldioxid (SO2)
NO2 3 (gut)
Stickstoffdioxid (NO2)
CO 1.3 (gut)
Kohlenmonoxid (CO)
气象站
index
2022-05-27
pm10
51
o3
0.02
pm25
21
so2
9.6
no2
0.38
co
0.64
气象站
2018-10 2020-05
index
2020-05
2020-04
2020-03
2020-02
2020-01
2019-12
2019-11
2019-10
2019-09
2019-08
2019-07
2019-06
2019-05
2019-04
2019-03
2019-02
2019-01
2018-12
2018-11
2018-10
pm25
23
36
48
67
105
99
72
36
31
26
26
28
36
44
55
114
151
119
90
49
co
725
712
785
966
1
1
979
906
701
827
684
680
784
939
737
1
1
1
1
897
no2
20
31
24
14
31
43
39
31
23
17
17
19
22
26
37
35
56
54
49
47
o3
142
136
113
90
73
56
98
112
165
166
171
177
152
126
117
86
59
54
89
120
pm10
63
82
96
84
127
139
128
77
59
51
48
54
81
86
92
124
175
156
124
90
so2
9.3
9.9
8.1
8.1
9.3
11
9.5
8.6
7.6
5.5
6.2
5.7
5.2
6.2
7.3
8
8.7
9.6
9.1
7.4
* Pollution data source:
https://openaq.org
(ChinaAQIData)
The data is licensed under CC-By 4.0
PM10 53 (Ungesund für sensible Gruppen)
O3 0 (gut)
PM2,5 7 (gut)
SO2 18 (gut)
NO2 3 (gut)
CO 1 (gut)
Daten zur Luftverschmutzung der letzten Tage in Hongshan
| index | 2022-05-27 |
|---|---|
| pm10 | 51 Unhealthy for Sensitive Groups |
| o3 | 0 Good |
| pm25 | 21 Moderate |
| so2 | 10 Good |
| no2 | 0 Good |
| co | 1 Good |
| index | 2020-05 | 2020-04 | 2020-03 | 2020-02 | 2020-01 | 2019-12 | 2019-11 | 2019-10 | 2019-09 | 2019-08 | 2019-07 | 2019-06 | 2019-05 | 2019-04 | 2019-03 | 2019-02 | 2019-01 | 2018-12 | 2018-11 | 2018-10 |
|---|---|---|---|---|---|---|---|---|---|---|---|---|---|---|---|---|---|---|---|---|
| pm25 | 23 (Moderate) | 36 (Unhealthy for Sensitive Groups) | 48 (Unhealthy for Sensitive Groups) | 67 (Unhealthy) | 105 (Very Unhealthy) | 99 (Very Unhealthy) | 72 (Unhealthy) | 36 (Unhealthy for Sensitive Groups) | 31 (Moderate) | 26 (Moderate) | 26 (Moderate) | 28 (Moderate) | 36 (Unhealthy for Sensitive Groups) | 44 (Unhealthy for Sensitive Groups) | 55 (Unhealthy) | 114 (Very bad Hazardous) | 151 (Very bad Hazardous) | 119 (Very bad Hazardous) | 90 (Very Unhealthy) | 49 (Unhealthy for Sensitive Groups) |
| co | 725 (Good) | 712 (Good) | 785 (Good) | 966 (Good) | 1 (Good) | 1 (Good) | 979 (Good) | 906 (Good) | 701 (Good) | 827 (Good) | 684 (Good) | 680 (Good) | 784 (Good) | 939 (Good) | 737 (Good) | 1 (Good) | 1 (Good) | 1 (Good) | 1 (Good) | 897 (Good) |
| no2 | 20 (Good) | 31 (Good) | 24 (Good) | 14 (Good) | 31 (Good) | 43 (Moderate) | 39 (Good) | 31 (Good) | 23 (Good) | 17 (Good) | 17 (Good) | 19 (Good) | 22 (Good) | 26 (Good) | 37 (Good) | 35 (Good) | 56 (Moderate) | 54 (Moderate) | 49 (Moderate) | 47 (Moderate) |
| o3 | 142 (Unhealthy for Sensitive Groups) | 136 (Unhealthy for Sensitive Groups) | 113 (Moderate) | 90 (Moderate) | 73 (Moderate) | 56 (Good) | 98 (Moderate) | 112 (Moderate) | 165 (Unhealthy) | 166 (Unhealthy) | 171 (Unhealthy) | 177 (Unhealthy) | 152 (Unhealthy) | 126 (Unhealthy for Sensitive Groups) | 117 (Moderate) | 86 (Moderate) | 59 (Good) | 54 (Good) | 89 (Moderate) | 120 (Unhealthy for Sensitive Groups) |
| pm10 | 63 (Unhealthy for Sensitive Groups) | 82 (Unhealthy) | 96 (Unhealthy) | 84 (Unhealthy) | 127 (Very Unhealthy) | 139 (Very Unhealthy) | 128 (Very Unhealthy) | 77 (Unhealthy for Sensitive Groups) | 59 (Unhealthy for Sensitive Groups) | 51 (Unhealthy for Sensitive Groups) | 48 (Moderate) | 54 (Unhealthy for Sensitive Groups) | 81 (Unhealthy) | 86 (Unhealthy) | 92 (Unhealthy) | 124 (Very Unhealthy) | 175 (Very bad Hazardous) | 156 (Very bad Hazardous) | 124 (Very Unhealthy) | 90 (Unhealthy) |
| so2 | 9.3 (Good) | 9.9 (Good) | 8.1 (Good) | 8.1 (Good) | 9.3 (Good) | 11 (Good) | 9.5 (Good) | 8.6 (Good) | 7.6 (Good) | 5.5 (Good) | 6.2 (Good) | 5.7 (Good) | 5.2 (Good) | 6.2 (Good) | 7.3 (Good) | 8 (Good) | 8.7 (Good) | 9.6 (Good) | 9.1 (Good) | 7.4 (Good) |
PM10 53 (Ungesund für sensible Gruppen)
Feinstaub (PM10) SchwebestaubO3 0.02 (gut)
Ozon (O3)PM2,5 6.6 (gut)
Feinstaub (PM2,5)SO2 18 (gut)
Schwefeldioxid (SO2)NO2 3 (gut)
Stickstoffdioxid (NO2)CO 1.3 (gut)
Kohlenmonoxid (CO)气象站
| index | 2022-05-27 |
|---|---|
| pm10 | 51 |
| o3 | 0.02 |
| pm25 | 21 |
| so2 | 9.6 |
| no2 | 0.38 |
| co | 0.64 |
气象站

| index | 2020-05 | 2020-04 | 2020-03 | 2020-02 | 2020-01 | 2019-12 | 2019-11 | 2019-10 | 2019-09 | 2019-08 | 2019-07 | 2019-06 | 2019-05 | 2019-04 | 2019-03 | 2019-02 | 2019-01 | 2018-12 | 2018-11 | 2018-10 |
|---|---|---|---|---|---|---|---|---|---|---|---|---|---|---|---|---|---|---|---|---|
| pm25 | 23 | 36 | 48 | 67 | 105 | 99 | 72 | 36 | 31 | 26 | 26 | 28 | 36 | 44 | 55 | 114 | 151 | 119 | 90 | 49 |
| co | 725 | 712 | 785 | 966 | 1 | 1 | 979 | 906 | 701 | 827 | 684 | 680 | 784 | 939 | 737 | 1 | 1 | 1 | 1 | 897 |
| no2 | 20 | 31 | 24 | 14 | 31 | 43 | 39 | 31 | 23 | 17 | 17 | 19 | 22 | 26 | 37 | 35 | 56 | 54 | 49 | 47 |
| o3 | 142 | 136 | 113 | 90 | 73 | 56 | 98 | 112 | 165 | 166 | 171 | 177 | 152 | 126 | 117 | 86 | 59 | 54 | 89 | 120 |
| pm10 | 63 | 82 | 96 | 84 | 127 | 139 | 128 | 77 | 59 | 51 | 48 | 54 | 81 | 86 | 92 | 124 | 175 | 156 | 124 | 90 |
| so2 | 9.3 | 9.9 | 8.1 | 8.1 | 9.3 | 11 | 9.5 | 8.6 | 7.6 | 5.5 | 6.2 | 5.7 | 5.2 | 6.2 | 7.3 | 8 | 8.7 | 9.6 | 9.1 | 7.4 |