Luftverschmutzung in Heze: Echtzeit-Luft-Qualitätsindex und Smog-Alarm.
Für die Heze. Heute ist Donnerstag, 4. Juni 2026. Für Heze wurden folgende Luftverschmutzungswerte gemessen:- Feinstaub (PM10) Schwebestaub - 179 (Sehr schlecht Gefährlich)
- Feinstaub (PM2,5) - 35 (Ungesund für sensible Gruppen)
- Ozon (O3) - 0 (gut)
- Stickstoffdioxid (NO2) - 0 (gut)
- Schwefeldioxid (SO2) - 0 (gut)

Wie ist die Luftqualität Heze heute? Ist die Luft in Heze? verschmutzt. Gibt es Smog?
Wie hoch ist der PM10-Stand heute in Heze? (Feinstaub (PM10) Schwebestaub)
Der aktuelle Feinstaubgehalt PM10 in Heze is:
179 (Sehr schlecht Gefährlich)
Die höchsten PM10-Werte treten in der Regel im Monat auf: 175 (Januar 2020).
Der niedrigste Wert der Feinstaub-PM10-Belastung in Heze ist in der Regel in: August (54).
Wie hoch ist der aktuelle PM2,5-Wert in Heze? (Feinstaub (PM2,5))
Die heutige PM2.5-Stufe ist:
35 (Ungesund für sensible Gruppen)
Zum Vergleich: Der höchste PM2,5-Wert in Heze in den letzten 7 Tagen war: 56 (Freitag, 27. Mai 2022) und der niedrigste: 56 (Freitag, 27. Mai 2022).
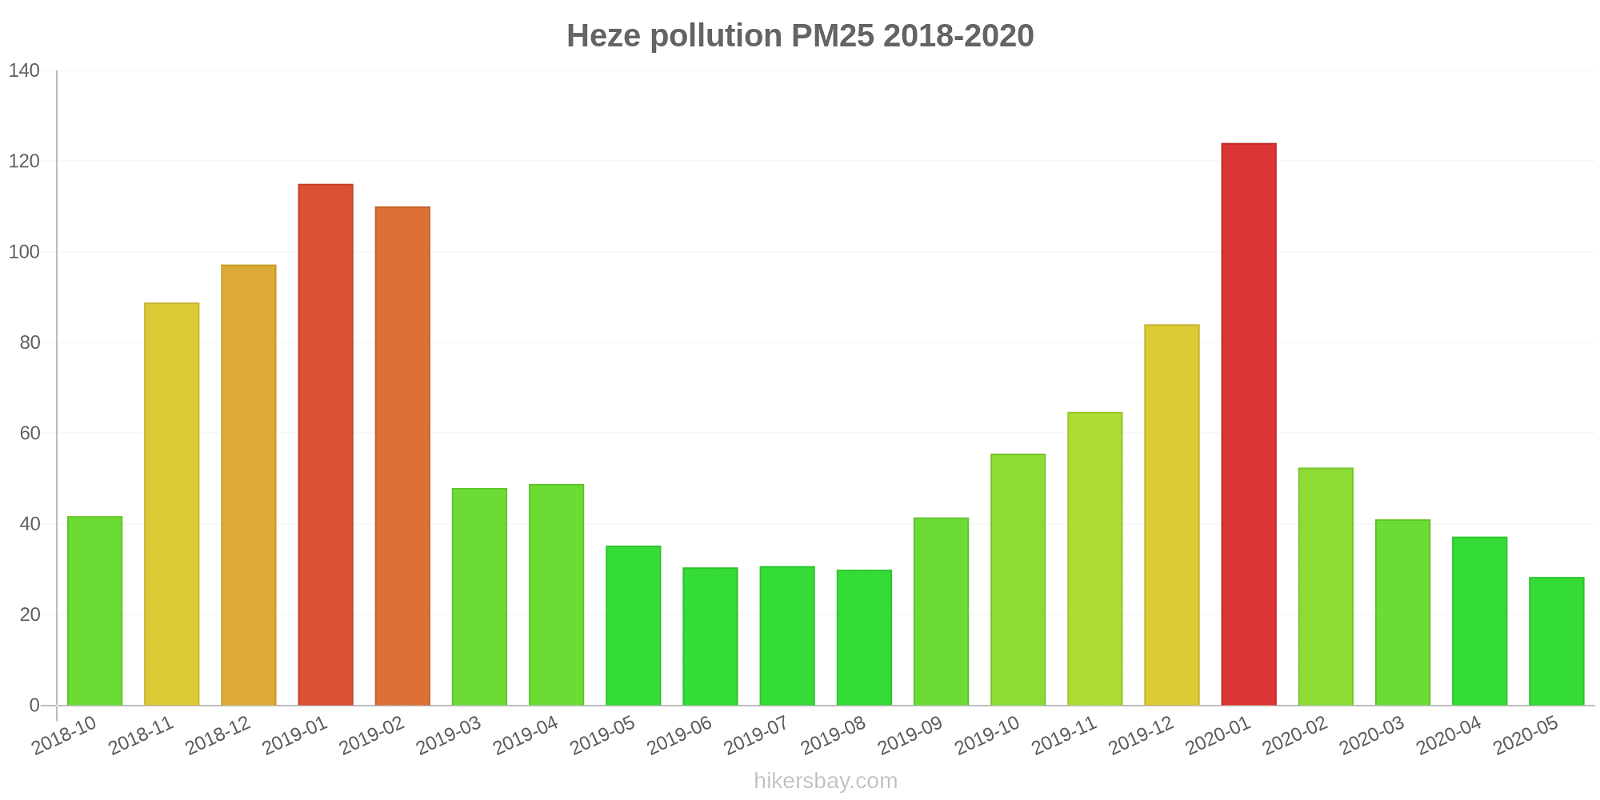
Die höchsten PM2,5-Werte wurden gemessen: 124 (Januar 2020).
Die niedrigste Feinstaubbelastung PM2,5 tritt im Monat auf: Mai (28).
Wie ist das O3-Niveau heute in Heze? (Ozon (O3))
0 (gut)
Wie hoch ist das NO2-Niveau? (Stickstoffdioxid (NO2))
0 (gut)
Wie hoch ist die SO2-Belastung? (Schwefeldioxid (SO2))
0 (gut)
Aktuelle Daten Freitag, 27. Mai 2022, 12:00
PM10 179 (Sehr schlecht Gefährlich)
PM2,5 35 (Ungesund für sensible Gruppen)
O3 0 (gut)
NO2 0 (gut)
SO2 0 (gut)
Daten zur Luftverschmutzung der letzten Tage in Heze
index
2022-05-27
pm10
56
Unhealthy for Sensitive Groups
pm25
56
Unhealthy
o3
0
Good
no2
0
Good
so2
0
Good
data source »
Luftverschmutzung in Heze von Oktober 2018 bis Mai 2020
index
2020-05
2020-04
2020-03
2020-02
2020-01
2019-12
2019-11
2019-10
2019-09
2019-08
2019-07
2019-06
2019-05
2019-04
2019-03
2019-02
2019-01
2018-12
2018-11
2018-10
pm25
28 (Moderate)
37 (Unhealthy for Sensitive Groups)
41 (Unhealthy for Sensitive Groups)
52 (Unhealthy for Sensitive Groups)
124 (Very bad Hazardous)
84 (Very Unhealthy)
65 (Unhealthy)
56 (Unhealthy)
41 (Unhealthy for Sensitive Groups)
30 (Moderate)
31 (Moderate)
30 (Moderate)
35 (Unhealthy for Sensitive Groups)
49 (Unhealthy for Sensitive Groups)
48 (Unhealthy for Sensitive Groups)
110 (Very bad Hazardous)
115 (Very bad Hazardous)
97 (Very Unhealthy)
89 (Very Unhealthy)
42 (Unhealthy for Sensitive Groups)
co
463 (Good)
446 (Good)
524 (Good)
607 (Good)
1 (Good)
889 (Good)
756 (Good)
717 (Good)
704 (Good)
768 (Good)
704 (Good)
626 (Good)
553 (Good)
769 (Good)
738 (Good)
1 (Good)
1 (Good)
1 (Good)
1 (Good)
899 (Good)
no2
19 (Good)
27 (Good)
23 (Good)
13 (Good)
39 (Good)
47 (Moderate)
44 (Moderate)
37 (Good)
31 (Good)
24 (Good)
20 (Good)
23 (Good)
27 (Good)
22 (Good)
27 (Good)
31 (Good)
46 (Moderate)
50 (Moderate)
42 (Moderate)
44 (Moderate)
o3
151 (Unhealthy)
141 (Unhealthy for Sensitive Groups)
114 (Moderate)
91 (Moderate)
75 (Moderate)
61 (Good)
99 (Moderate)
131 (Unhealthy for Sensitive Groups)
177 (Unhealthy)
155 (Unhealthy)
180 (Very Unhealthy)
185 (Very Unhealthy)
162 (Unhealthy)
123 (Unhealthy for Sensitive Groups)
126 (Unhealthy for Sensitive Groups)
98 (Moderate)
68 (Good)
50 (Good)
89 (Moderate)
116 (Moderate)
pm10
89 (Unhealthy)
101 (Unhealthy)
102 (Unhealthy)
83 (Unhealthy)
175 (Very bad Hazardous)
147 (Very Unhealthy)
155 (Very bad Hazardous)
132 (Very Unhealthy)
85 (Unhealthy)
54 (Unhealthy for Sensitive Groups)
59 (Unhealthy for Sensitive Groups)
81 (Unhealthy)
92 (Unhealthy)
106 (Unhealthy)
118 (Very Unhealthy)
154 (Very bad Hazardous)
174 (Very bad Hazardous)
171 (Very bad Hazardous)
156 (Very bad Hazardous)
109 (Unhealthy)
so2
9.9 (Good)
14 (Good)
12 (Good)
8.2 (Good)
15 (Good)
16 (Good)
19 (Good)
14 (Good)
15 (Good)
12 (Good)
9.1 (Good)
11 (Good)
13 (Good)
17 (Good)
14 (Good)
14 (Good)
18 (Good)
18 (Good)
13 (Good)
18 (Good)
data source »
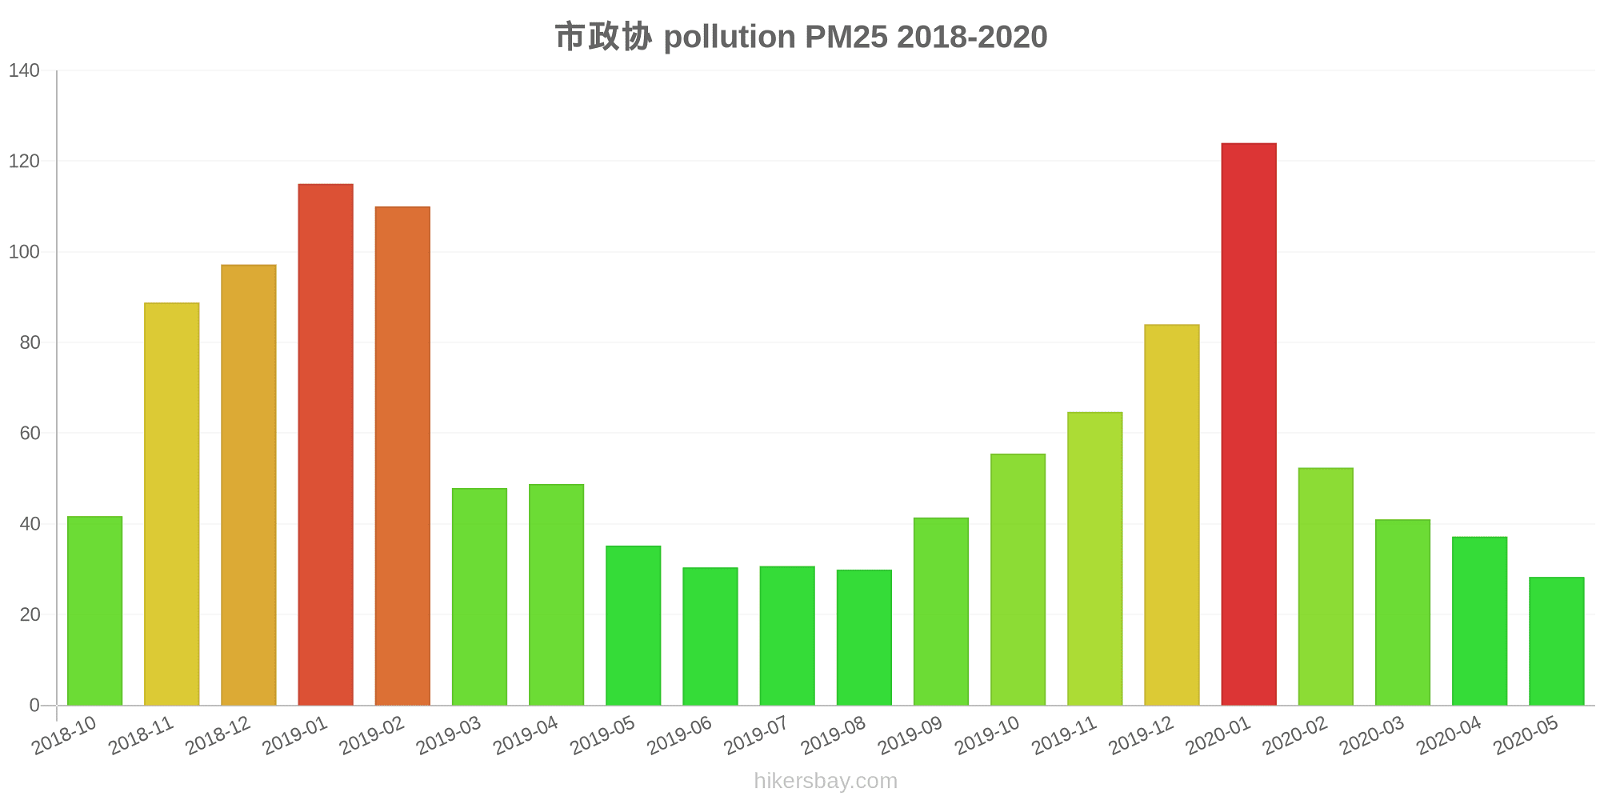
市政协
Freitag, 27. Mai 2022, 12:00
PM10 179 (Sehr schlecht Gefährlich)
Feinstaub (PM10) Schwebestaub
PM2,5 35 (Ungesund für sensible Gruppen)
Feinstaub (PM2,5)
O3 0.04 (gut)
Ozon (O3)
NO2 0 (gut)
Stickstoffdioxid (NO2)
SO2 0 (gut)
Schwefeldioxid (SO2)
市政协
index
2022-05-27
pm10
56
pm25
56
o3
0.03
no2
0
so2
0
市政协
2018-10 2020-05
index
2020-05
2020-04
2020-03
2020-02
2020-01
2019-12
2019-11
2019-10
2019-09
2019-08
2019-07
2019-06
2019-05
2019-04
2019-03
2019-02
2019-01
2018-12
2018-11
2018-10
pm25
28
37
41
52
124
84
65
56
41
30
31
30
35
49
48
110
115
97
89
42
co
463
446
524
607
1
889
756
717
704
768
704
626
553
769
738
1
1
1
1
899
no2
19
27
23
13
39
47
44
37
31
24
20
23
27
22
27
31
46
50
42
44
o3
151
141
114
91
75
61
99
131
177
155
180
185
162
123
126
98
68
50
89
116
pm10
89
101
102
83
175
147
155
132
85
54
59
81
92
106
118
154
174
171
156
109
so2
9.9
14
12
8.2
15
16
19
14
15
12
9.1
11
13
17
14
14
18
18
13
18
* Pollution data source:
https://openaq.org
(ChinaAQIData)
The data is licensed under CC-By 4.0
PM10 179 (Sehr schlecht Gefährlich)
PM2,5 35 (Ungesund für sensible Gruppen)
O3 0 (gut)
NO2 0 (gut)
SO2 0 (gut)
Daten zur Luftverschmutzung der letzten Tage in Heze
| index | 2022-05-27 |
|---|---|
| pm10 | 56 Unhealthy for Sensitive Groups |
| pm25 | 56 Unhealthy |
| o3 | 0 Good |
| no2 | 0 Good |
| so2 | 0 Good |

| index | 2020-05 | 2020-04 | 2020-03 | 2020-02 | 2020-01 | 2019-12 | 2019-11 | 2019-10 | 2019-09 | 2019-08 | 2019-07 | 2019-06 | 2019-05 | 2019-04 | 2019-03 | 2019-02 | 2019-01 | 2018-12 | 2018-11 | 2018-10 |
|---|---|---|---|---|---|---|---|---|---|---|---|---|---|---|---|---|---|---|---|---|
| pm25 | 28 (Moderate) | 37 (Unhealthy for Sensitive Groups) | 41 (Unhealthy for Sensitive Groups) | 52 (Unhealthy for Sensitive Groups) | 124 (Very bad Hazardous) | 84 (Very Unhealthy) | 65 (Unhealthy) | 56 (Unhealthy) | 41 (Unhealthy for Sensitive Groups) | 30 (Moderate) | 31 (Moderate) | 30 (Moderate) | 35 (Unhealthy for Sensitive Groups) | 49 (Unhealthy for Sensitive Groups) | 48 (Unhealthy for Sensitive Groups) | 110 (Very bad Hazardous) | 115 (Very bad Hazardous) | 97 (Very Unhealthy) | 89 (Very Unhealthy) | 42 (Unhealthy for Sensitive Groups) |
| co | 463 (Good) | 446 (Good) | 524 (Good) | 607 (Good) | 1 (Good) | 889 (Good) | 756 (Good) | 717 (Good) | 704 (Good) | 768 (Good) | 704 (Good) | 626 (Good) | 553 (Good) | 769 (Good) | 738 (Good) | 1 (Good) | 1 (Good) | 1 (Good) | 1 (Good) | 899 (Good) |
| no2 | 19 (Good) | 27 (Good) | 23 (Good) | 13 (Good) | 39 (Good) | 47 (Moderate) | 44 (Moderate) | 37 (Good) | 31 (Good) | 24 (Good) | 20 (Good) | 23 (Good) | 27 (Good) | 22 (Good) | 27 (Good) | 31 (Good) | 46 (Moderate) | 50 (Moderate) | 42 (Moderate) | 44 (Moderate) |
| o3 | 151 (Unhealthy) | 141 (Unhealthy for Sensitive Groups) | 114 (Moderate) | 91 (Moderate) | 75 (Moderate) | 61 (Good) | 99 (Moderate) | 131 (Unhealthy for Sensitive Groups) | 177 (Unhealthy) | 155 (Unhealthy) | 180 (Very Unhealthy) | 185 (Very Unhealthy) | 162 (Unhealthy) | 123 (Unhealthy for Sensitive Groups) | 126 (Unhealthy for Sensitive Groups) | 98 (Moderate) | 68 (Good) | 50 (Good) | 89 (Moderate) | 116 (Moderate) |
| pm10 | 89 (Unhealthy) | 101 (Unhealthy) | 102 (Unhealthy) | 83 (Unhealthy) | 175 (Very bad Hazardous) | 147 (Very Unhealthy) | 155 (Very bad Hazardous) | 132 (Very Unhealthy) | 85 (Unhealthy) | 54 (Unhealthy for Sensitive Groups) | 59 (Unhealthy for Sensitive Groups) | 81 (Unhealthy) | 92 (Unhealthy) | 106 (Unhealthy) | 118 (Very Unhealthy) | 154 (Very bad Hazardous) | 174 (Very bad Hazardous) | 171 (Very bad Hazardous) | 156 (Very bad Hazardous) | 109 (Unhealthy) |
| so2 | 9.9 (Good) | 14 (Good) | 12 (Good) | 8.2 (Good) | 15 (Good) | 16 (Good) | 19 (Good) | 14 (Good) | 15 (Good) | 12 (Good) | 9.1 (Good) | 11 (Good) | 13 (Good) | 17 (Good) | 14 (Good) | 14 (Good) | 18 (Good) | 18 (Good) | 13 (Good) | 18 (Good) |
PM10 179 (Sehr schlecht Gefährlich)
Feinstaub (PM10) SchwebestaubPM2,5 35 (Ungesund für sensible Gruppen)
Feinstaub (PM2,5)O3 0.04 (gut)
Ozon (O3)NO2 0 (gut)
Stickstoffdioxid (NO2)SO2 0 (gut)
Schwefeldioxid (SO2)市政协
| index | 2022-05-27 |
|---|---|
| pm10 | 56 |
| pm25 | 56 |
| o3 | 0.03 |
| no2 | 0 |
| so2 | 0 |
市政协

| index | 2020-05 | 2020-04 | 2020-03 | 2020-02 | 2020-01 | 2019-12 | 2019-11 | 2019-10 | 2019-09 | 2019-08 | 2019-07 | 2019-06 | 2019-05 | 2019-04 | 2019-03 | 2019-02 | 2019-01 | 2018-12 | 2018-11 | 2018-10 |
|---|---|---|---|---|---|---|---|---|---|---|---|---|---|---|---|---|---|---|---|---|
| pm25 | 28 | 37 | 41 | 52 | 124 | 84 | 65 | 56 | 41 | 30 | 31 | 30 | 35 | 49 | 48 | 110 | 115 | 97 | 89 | 42 |
| co | 463 | 446 | 524 | 607 | 1 | 889 | 756 | 717 | 704 | 768 | 704 | 626 | 553 | 769 | 738 | 1 | 1 | 1 | 1 | 899 |
| no2 | 19 | 27 | 23 | 13 | 39 | 47 | 44 | 37 | 31 | 24 | 20 | 23 | 27 | 22 | 27 | 31 | 46 | 50 | 42 | 44 |
| o3 | 151 | 141 | 114 | 91 | 75 | 61 | 99 | 131 | 177 | 155 | 180 | 185 | 162 | 123 | 126 | 98 | 68 | 50 | 89 | 116 |
| pm10 | 89 | 101 | 102 | 83 | 175 | 147 | 155 | 132 | 85 | 54 | 59 | 81 | 92 | 106 | 118 | 154 | 174 | 171 | 156 | 109 |
| so2 | 9.9 | 14 | 12 | 8.2 | 15 | 16 | 19 | 14 | 15 | 12 | 9.1 | 11 | 13 | 17 | 14 | 14 | 18 | 18 | 13 | 18 |