Luftverschmutzung in Hanting: Echtzeit-Luft-Qualitätsindex und Smog-Alarm.
Für die Hanting. Heute ist Donnerstag, 4. Juni 2026. Für Hanting wurden folgende Luftverschmutzungswerte gemessen:- Feinstaub (PM10) Schwebestaub - 53 (Ungesund für sensible Gruppen)
- Ozon (O3) - 0 (gut)
- Feinstaub (PM2,5) - 7 (gut)
- Schwefeldioxid (SO2) - 18 (gut)
- Stickstoffdioxid (NO2) - 3 (gut)
- Kohlenmonoxid (CO) - 1 (gut)

Wie ist die Luftqualität Hanting heute? Ist die Luft in Hanting? verschmutzt. Gibt es Smog?
Wie hoch ist der PM10-Stand heute in Hanting? (Feinstaub (PM10) Schwebestaub)
Der aktuelle Feinstaubgehalt PM10 in Hanting is:
53 (Ungesund für sensible Gruppen)
Die höchsten PM10-Werte treten in der Regel im Monat auf: 188 (Januar 2019).
Der niedrigste Wert der Feinstaub-PM10-Belastung in Hanting ist in der Regel in: August (56).
Wie ist das O3-Niveau heute in Hanting? (Ozon (O3))
0 (gut)
Wie hoch ist der aktuelle PM2,5-Wert in Hanting? (Feinstaub (PM2,5))
Die heutige PM2.5-Stufe ist:
7 (gut)
Zum Vergleich: Der höchste PM2,5-Wert in Hanting in den letzten 7 Tagen war: 21 (Freitag, 27. Mai 2022) und der niedrigste: 21 (Freitag, 27. Mai 2022).
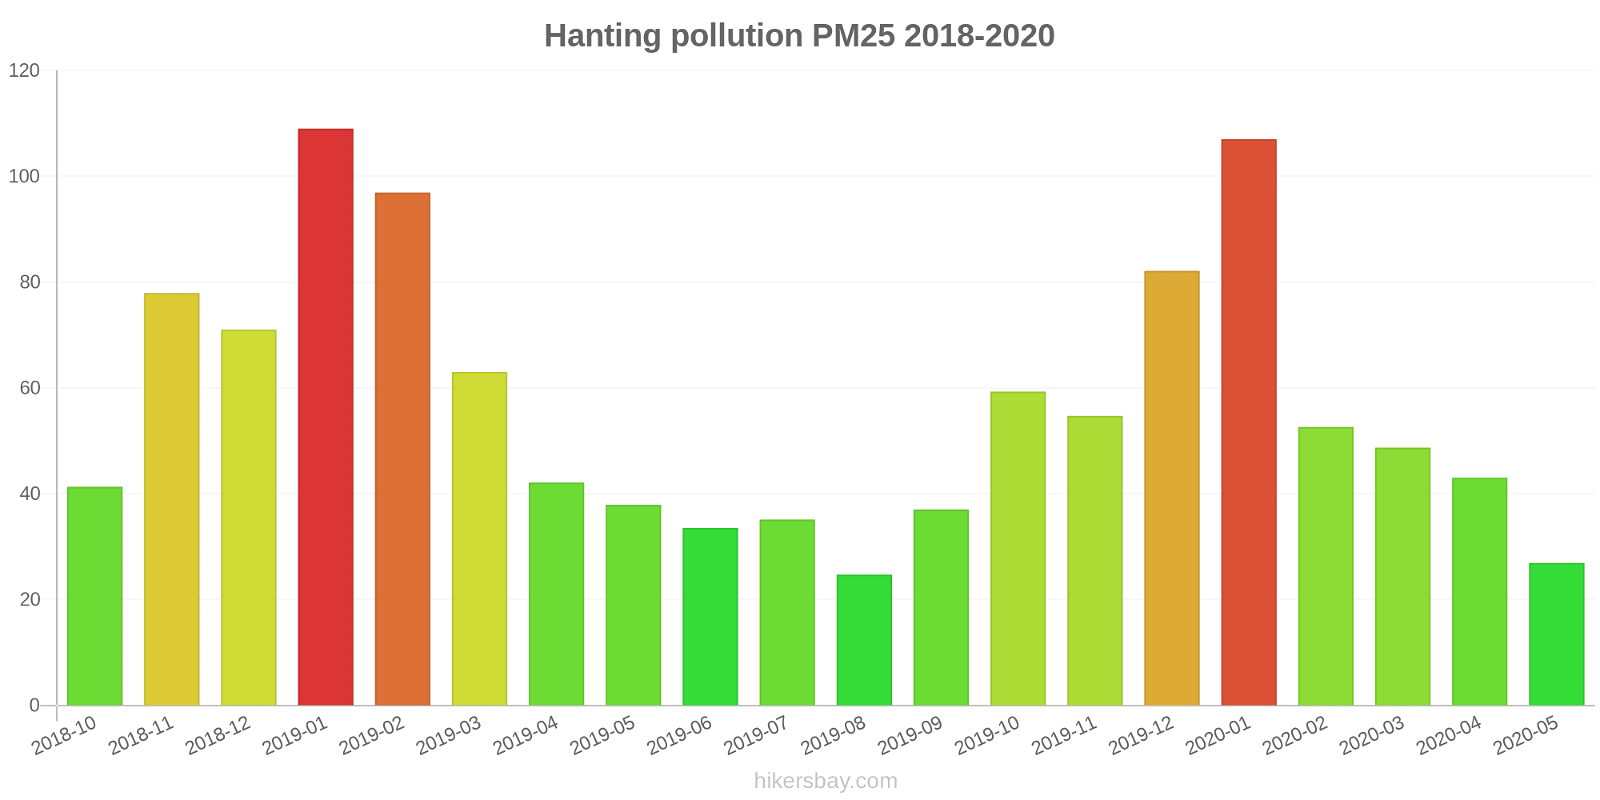
Die höchsten PM2,5-Werte wurden gemessen: 109 (Januar 2019).
Die niedrigste Feinstaubbelastung PM2,5 tritt im Monat auf: August (25).
Wie hoch ist die SO2-Belastung? (Schwefeldioxid (SO2))
18 (gut)
Wie hoch ist das NO2-Niveau? (Stickstoffdioxid (NO2))
3 (gut)
Wie hoch ist der CO-Gehalt? (Kohlenmonoxid (CO))
1 (gut)
Aktuelle Daten Freitag, 27. Mai 2022, 12:00
PM10 53 (Ungesund für sensible Gruppen)
O3 0 (gut)
PM2,5 7 (gut)
SO2 18 (gut)
NO2 3 (gut)
CO 1 (gut)
Daten zur Luftverschmutzung der letzten Tage in Hanting
index
2022-05-27
pm10
51
Unhealthy for Sensitive Groups
o3
0
Good
pm25
21
Moderate
so2
10
Good
no2
0
Good
co
1
Good
data source »
Luftverschmutzung in Hanting von Oktober 2018 bis Mai 2020
index
2020-05
2020-04
2020-03
2020-02
2020-01
2019-12
2019-11
2019-10
2019-09
2019-08
2019-07
2019-06
2019-05
2019-04
2019-03
2019-02
2019-01
2018-12
2018-11
2018-10
pm25
27 (Moderate)
43 (Unhealthy for Sensitive Groups)
49 (Unhealthy for Sensitive Groups)
53 (Unhealthy for Sensitive Groups)
107 (Very Unhealthy)
82 (Very Unhealthy)
55 (Unhealthy for Sensitive Groups)
59 (Unhealthy)
37 (Unhealthy for Sensitive Groups)
25 (Moderate)
35 (Unhealthy for Sensitive Groups)
34 (Moderate)
38 (Unhealthy for Sensitive Groups)
42 (Unhealthy for Sensitive Groups)
63 (Unhealthy)
97 (Very Unhealthy)
109 (Very Unhealthy)
71 (Unhealthy)
78 (Very Unhealthy)
41 (Unhealthy for Sensitive Groups)
co
272 (Good)
570 (Good)
680 (Good)
721 (Good)
1 (Good)
1 (Good)
818 (Good)
666 (Good)
571 (Good)
564 (Good)
520 (Good)
488 (Good)
527 (Good)
532 (Good)
889 (Good)
1 (Good)
1 (Good)
1 (Good)
1 (Good)
727 (Good)
no2
18 (Good)
39 (Good)
32 (Good)
20 (Good)
47 (Moderate)
50 (Moderate)
46 (Moderate)
42 (Moderate)
35 (Good)
28 (Good)
25 (Good)
22 (Good)
32 (Good)
33 (Good)
44 (Moderate)
42 (Moderate)
64 (Moderate)
49 (Moderate)
52 (Moderate)
47 (Moderate)
o3
137 (Unhealthy for Sensitive Groups)
136 (Unhealthy for Sensitive Groups)
110 (Moderate)
93 (Moderate)
72 (Moderate)
56 (Good)
79 (Moderate)
120 (Unhealthy for Sensitive Groups)
156 (Unhealthy)
123 (Unhealthy for Sensitive Groups)
167 (Unhealthy)
185 (Very Unhealthy)
168 (Unhealthy)
134 (Unhealthy for Sensitive Groups)
125 (Unhealthy for Sensitive Groups)
93 (Moderate)
58 (Good)
54 (Good)
81 (Moderate)
98 (Moderate)
pm10
63 (Unhealthy for Sensitive Groups)
92 (Unhealthy)
100 (Unhealthy)
69 (Unhealthy for Sensitive Groups)
140 (Very Unhealthy)
116 (Very Unhealthy)
117 (Very Unhealthy)
123 (Very Unhealthy)
85 (Unhealthy)
56 (Unhealthy for Sensitive Groups)
74 (Unhealthy for Sensitive Groups)
83 (Unhealthy)
112 (Very Unhealthy)
107 (Unhealthy)
133 (Very Unhealthy)
150 (Very bad Hazardous)
188 (Very bad Hazardous)
141 (Very Unhealthy)
165 (Very bad Hazardous)
107 (Unhealthy)
so2
7.1 (Good)
11 (Good)
10 (Good)
8.8 (Good)
19 (Good)
14 (Good)
9.9 (Good)
10 (Good)
9.6 (Good)
8 (Good)
6.4 (Good)
9.1 (Good)
12 (Good)
9 (Good)
16 (Good)
20 (Good)
32 (Good)
24 (Good)
15 (Good)
16 (Good)
data source »
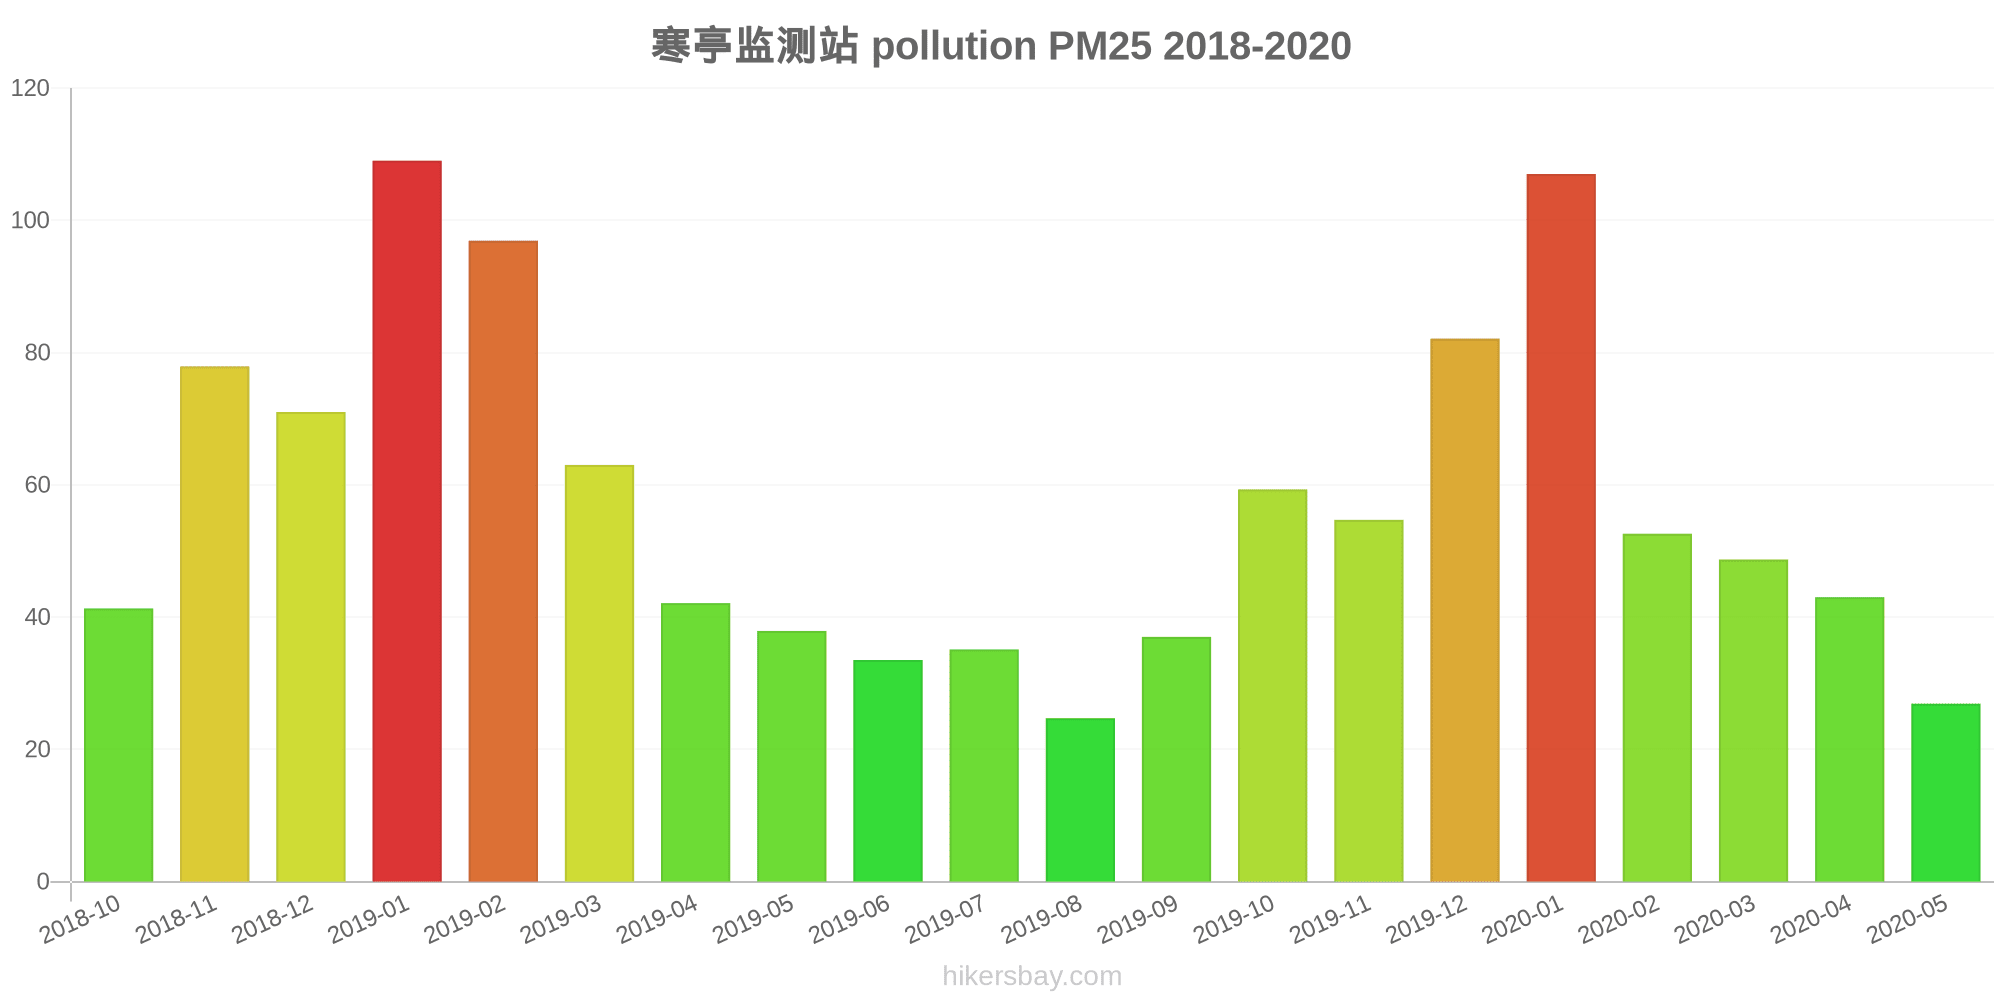
寒亭监测站
Freitag, 27. Mai 2022, 12:00
PM10 53 (Ungesund für sensible Gruppen)
Feinstaub (PM10) Schwebestaub
O3 0.02 (gut)
Ozon (O3)
PM2,5 6.6 (gut)
Feinstaub (PM2,5)
SO2 18 (gut)
Schwefeldioxid (SO2)
NO2 3 (gut)
Stickstoffdioxid (NO2)
CO 1.3 (gut)
Kohlenmonoxid (CO)
寒亭监测站
index
2022-05-27
pm10
51
o3
0.02
pm25
21
so2
9.6
no2
0.38
co
0.64
寒亭监测站
2018-10 2020-05

index
2020-05
2020-04
2020-03
2020-02
2020-01
2019-12
2019-11
2019-10
2019-09
2019-08
2019-07
2019-06
2019-05
2019-04
2019-03
2019-02
2019-01
2018-12
2018-11
2018-10
pm25
27
43
49
53
107
82
55
59
37
25
35
34
38
42
63
97
109
71
78
41
co
272
570
680
721
1
1
818
666
571
564
520
488
527
532
889
1
1
1
1
727
no2
18
39
32
20
47
50
46
42
35
28
25
22
32
33
44
42
64
49
52
47
o3
137
136
110
93
72
56
79
120
156
123
167
185
168
134
125
93
58
54
81
98
pm10
63
92
100
69
140
116
117
123
85
56
74
83
112
107
133
150
188
141
165
107
so2
7.1
11
10
8.8
19
14
9.9
10
9.6
8
6.4
9.1
12
9
16
20
32
24
15
16
* Pollution data source:
https://openaq.org
(ChinaAQIData)
The data is licensed under CC-By 4.0
PM10 53 (Ungesund für sensible Gruppen)
O3 0 (gut)
PM2,5 7 (gut)
SO2 18 (gut)
NO2 3 (gut)
CO 1 (gut)
Daten zur Luftverschmutzung der letzten Tage in Hanting
| index | 2022-05-27 |
|---|---|
| pm10 | 51 Unhealthy for Sensitive Groups |
| o3 | 0 Good |
| pm25 | 21 Moderate |
| so2 | 10 Good |
| no2 | 0 Good |
| co | 1 Good |

| index | 2020-05 | 2020-04 | 2020-03 | 2020-02 | 2020-01 | 2019-12 | 2019-11 | 2019-10 | 2019-09 | 2019-08 | 2019-07 | 2019-06 | 2019-05 | 2019-04 | 2019-03 | 2019-02 | 2019-01 | 2018-12 | 2018-11 | 2018-10 |
|---|---|---|---|---|---|---|---|---|---|---|---|---|---|---|---|---|---|---|---|---|
| pm25 | 27 (Moderate) | 43 (Unhealthy for Sensitive Groups) | 49 (Unhealthy for Sensitive Groups) | 53 (Unhealthy for Sensitive Groups) | 107 (Very Unhealthy) | 82 (Very Unhealthy) | 55 (Unhealthy for Sensitive Groups) | 59 (Unhealthy) | 37 (Unhealthy for Sensitive Groups) | 25 (Moderate) | 35 (Unhealthy for Sensitive Groups) | 34 (Moderate) | 38 (Unhealthy for Sensitive Groups) | 42 (Unhealthy for Sensitive Groups) | 63 (Unhealthy) | 97 (Very Unhealthy) | 109 (Very Unhealthy) | 71 (Unhealthy) | 78 (Very Unhealthy) | 41 (Unhealthy for Sensitive Groups) |
| co | 272 (Good) | 570 (Good) | 680 (Good) | 721 (Good) | 1 (Good) | 1 (Good) | 818 (Good) | 666 (Good) | 571 (Good) | 564 (Good) | 520 (Good) | 488 (Good) | 527 (Good) | 532 (Good) | 889 (Good) | 1 (Good) | 1 (Good) | 1 (Good) | 1 (Good) | 727 (Good) |
| no2 | 18 (Good) | 39 (Good) | 32 (Good) | 20 (Good) | 47 (Moderate) | 50 (Moderate) | 46 (Moderate) | 42 (Moderate) | 35 (Good) | 28 (Good) | 25 (Good) | 22 (Good) | 32 (Good) | 33 (Good) | 44 (Moderate) | 42 (Moderate) | 64 (Moderate) | 49 (Moderate) | 52 (Moderate) | 47 (Moderate) |
| o3 | 137 (Unhealthy for Sensitive Groups) | 136 (Unhealthy for Sensitive Groups) | 110 (Moderate) | 93 (Moderate) | 72 (Moderate) | 56 (Good) | 79 (Moderate) | 120 (Unhealthy for Sensitive Groups) | 156 (Unhealthy) | 123 (Unhealthy for Sensitive Groups) | 167 (Unhealthy) | 185 (Very Unhealthy) | 168 (Unhealthy) | 134 (Unhealthy for Sensitive Groups) | 125 (Unhealthy for Sensitive Groups) | 93 (Moderate) | 58 (Good) | 54 (Good) | 81 (Moderate) | 98 (Moderate) |
| pm10 | 63 (Unhealthy for Sensitive Groups) | 92 (Unhealthy) | 100 (Unhealthy) | 69 (Unhealthy for Sensitive Groups) | 140 (Very Unhealthy) | 116 (Very Unhealthy) | 117 (Very Unhealthy) | 123 (Very Unhealthy) | 85 (Unhealthy) | 56 (Unhealthy for Sensitive Groups) | 74 (Unhealthy for Sensitive Groups) | 83 (Unhealthy) | 112 (Very Unhealthy) | 107 (Unhealthy) | 133 (Very Unhealthy) | 150 (Very bad Hazardous) | 188 (Very bad Hazardous) | 141 (Very Unhealthy) | 165 (Very bad Hazardous) | 107 (Unhealthy) |
| so2 | 7.1 (Good) | 11 (Good) | 10 (Good) | 8.8 (Good) | 19 (Good) | 14 (Good) | 9.9 (Good) | 10 (Good) | 9.6 (Good) | 8 (Good) | 6.4 (Good) | 9.1 (Good) | 12 (Good) | 9 (Good) | 16 (Good) | 20 (Good) | 32 (Good) | 24 (Good) | 15 (Good) | 16 (Good) |
PM10 53 (Ungesund für sensible Gruppen)
Feinstaub (PM10) SchwebestaubO3 0.02 (gut)
Ozon (O3)PM2,5 6.6 (gut)
Feinstaub (PM2,5)SO2 18 (gut)
Schwefeldioxid (SO2)NO2 3 (gut)
Stickstoffdioxid (NO2)CO 1.3 (gut)
Kohlenmonoxid (CO)寒亭监测站
| index | 2022-05-27 |
|---|---|
| pm10 | 51 |
| o3 | 0.02 |
| pm25 | 21 |
| so2 | 9.6 |
| no2 | 0.38 |
| co | 0.64 |
寒亭监测站
| index | 2020-05 | 2020-04 | 2020-03 | 2020-02 | 2020-01 | 2019-12 | 2019-11 | 2019-10 | 2019-09 | 2019-08 | 2019-07 | 2019-06 | 2019-05 | 2019-04 | 2019-03 | 2019-02 | 2019-01 | 2018-12 | 2018-11 | 2018-10 |
|---|---|---|---|---|---|---|---|---|---|---|---|---|---|---|---|---|---|---|---|---|
| pm25 | 27 | 43 | 49 | 53 | 107 | 82 | 55 | 59 | 37 | 25 | 35 | 34 | 38 | 42 | 63 | 97 | 109 | 71 | 78 | 41 |
| co | 272 | 570 | 680 | 721 | 1 | 1 | 818 | 666 | 571 | 564 | 520 | 488 | 527 | 532 | 889 | 1 | 1 | 1 | 1 | 727 |
| no2 | 18 | 39 | 32 | 20 | 47 | 50 | 46 | 42 | 35 | 28 | 25 | 22 | 32 | 33 | 44 | 42 | 64 | 49 | 52 | 47 |
| o3 | 137 | 136 | 110 | 93 | 72 | 56 | 79 | 120 | 156 | 123 | 167 | 185 | 168 | 134 | 125 | 93 | 58 | 54 | 81 | 98 |
| pm10 | 63 | 92 | 100 | 69 | 140 | 116 | 117 | 123 | 85 | 56 | 74 | 83 | 112 | 107 | 133 | 150 | 188 | 141 | 165 | 107 |
| so2 | 7.1 | 11 | 10 | 8.8 | 19 | 14 | 9.9 | 10 | 9.6 | 8 | 6.4 | 9.1 | 12 | 9 | 16 | 20 | 32 | 24 | 15 | 16 |