Luftverschmutzung in Gaoping: Echtzeit-Luft-Qualitätsindex und Smog-Alarm.
Für die Gaoping. Heute ist Donnerstag, 4. Juni 2026. Für Gaoping wurden folgende Luftverschmutzungswerte gemessen:- Feinstaub (PM2,5) - 61 (ungesund)
- Stickstoffdioxid (NO2) - 22 (gut)
- Feinstaub (PM10) Schwebestaub - 69 (Ungesund für sensible Gruppen)
- Kohlenmonoxid (CO) - 219 (gut)
- Ozon (O3) - 0 (gut)
- Schwefeldioxid (SO2) - 8 (gut)

Wie ist die Luftqualität Gaoping heute? Ist die Luft in Gaoping? verschmutzt. Gibt es Smog?
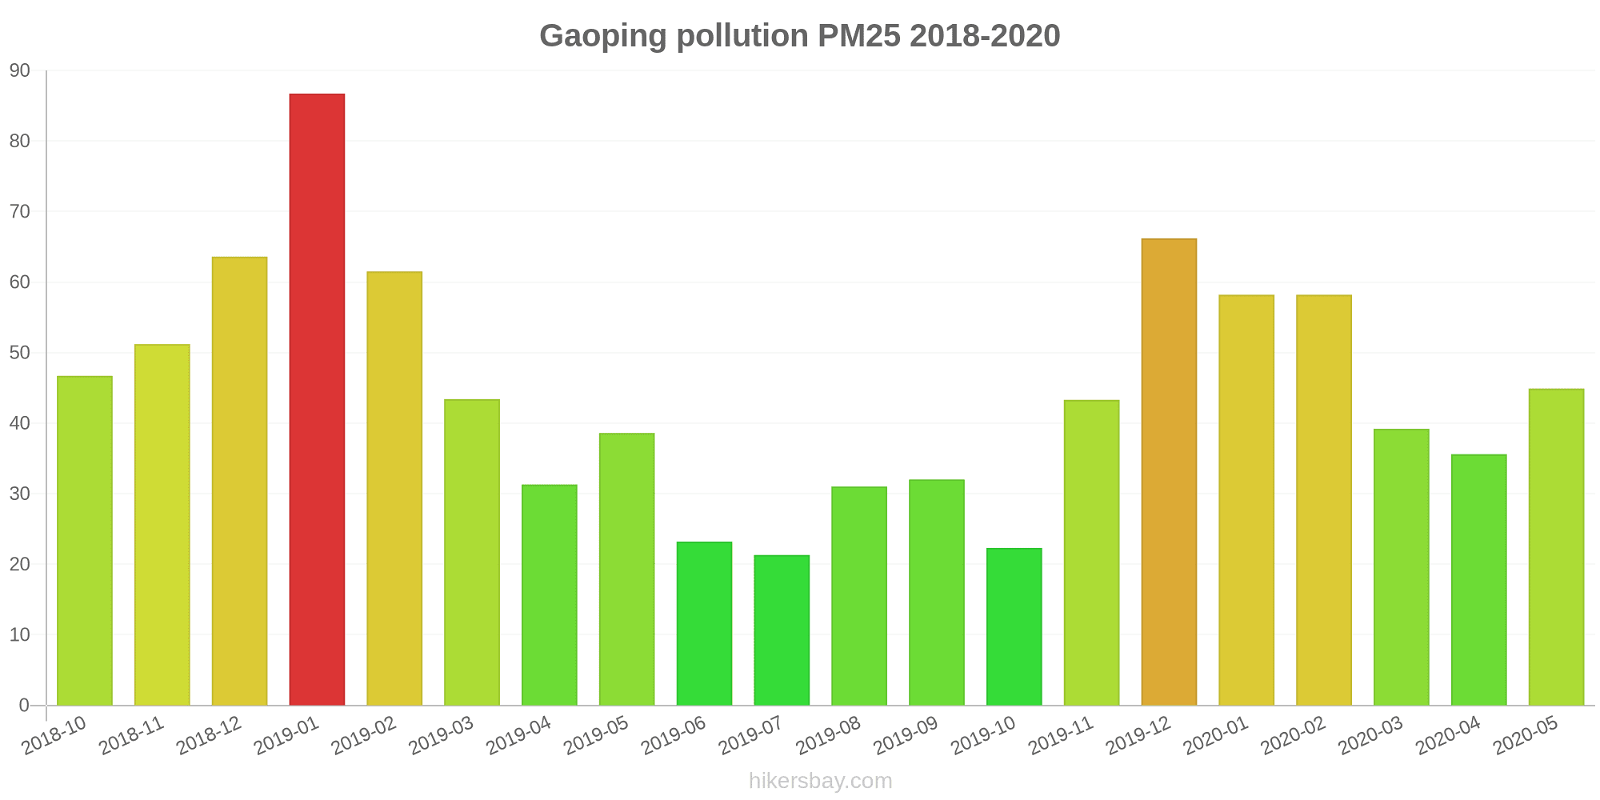
Wie hoch ist der aktuelle PM2,5-Wert in Gaoping? (Feinstaub (PM2,5))
Die heutige PM2.5-Stufe ist:
61 (ungesund)
Zum Vergleich: Der höchste PM2,5-Wert in Gaoping in den letzten 7 Tagen war: 28 (Freitag, 27. Mai 2022) und der niedrigste: 28 (Freitag, 27. Mai 2022).
Die höchsten PM2,5-Werte wurden gemessen: 87 (Januar 2019).
Die niedrigste Feinstaubbelastung PM2,5 tritt im Monat auf: Juli (21).
Wie hoch ist das NO2-Niveau? (Stickstoffdioxid (NO2))
22 (gut)
Wie hoch ist der PM10-Stand heute in Gaoping? (Feinstaub (PM10) Schwebestaub)
Der aktuelle Feinstaubgehalt PM10 in Gaoping is:
69 (Ungesund für sensible Gruppen)
Die höchsten PM10-Werte treten in der Regel im Monat auf: 118 (Januar 2019).
Der niedrigste Wert der Feinstaub-PM10-Belastung in Gaoping ist in der Regel in: Oktober (45).
Wie hoch ist der CO-Gehalt? (Kohlenmonoxid (CO))
219 (gut)
Wie ist das O3-Niveau heute in Gaoping? (Ozon (O3))
0 (gut)
Wie hoch ist die SO2-Belastung? (Schwefeldioxid (SO2))
8 (gut)
Aktuelle Daten Freitag, 27. Mai 2022, 15:00
PM2,5 61 (ungesund)
NO2 22 (gut)
PM10 69 (Ungesund für sensible Gruppen)
CO 219 (gut)
O3 0 (gut)
SO2 8 (gut)
Daten zur Luftverschmutzung der letzten Tage in Gaoping
index
2022-05-27
pm25
28
Moderate
no2
22
Good
pm10
35
Moderate
co
579
Good
o3
22
Good
so2
5
Good
data source »
Luftverschmutzung in Gaoping von Oktober 2018 bis Mai 2020
index
2020-05
2020-04
2020-03
2020-02
2020-01
2019-12
2019-11
2019-10
2019-09
2019-08
2019-07
2019-06
2019-05
2019-04
2019-03
2019-02
2019-01
2018-12
2018-11
2018-10
pm25
45 (Unhealthy for Sensitive Groups)
36 (Unhealthy for Sensitive Groups)
39 (Unhealthy for Sensitive Groups)
58 (Unhealthy)
58 (Unhealthy)
66 (Unhealthy)
43 (Unhealthy for Sensitive Groups)
22 (Moderate)
32 (Moderate)
31 (Moderate)
21 (Moderate)
23 (Moderate)
39 (Unhealthy for Sensitive Groups)
31 (Moderate)
43 (Unhealthy for Sensitive Groups)
62 (Unhealthy)
87 (Very Unhealthy)
64 (Unhealthy)
51 (Unhealthy for Sensitive Groups)
47 (Unhealthy for Sensitive Groups)
co
635 (Good)
565 (Good)
557 (Good)
714 (Good)
941 (Good)
848 (Good)
658 (Good)
554 (Good)
588 (Good)
536 (Good)
550 (Good)
567 (Good)
551 (Good)
636 (Good)
664 (Good)
902 (Good)
1 (Good)
754 (Good)
655 (Good)
692 (Good)
no2
35 (Good)
30 (Good)
26 (Good)
20 (Good)
30 (Good)
33 (Good)
34 (Good)
24 (Good)
22 (Good)
21 (Good)
20 (Good)
25 (Good)
26 (Good)
34 (Good)
36 (Good)
29 (Good)
42 (Moderate)
27 (Good)
30 (Good)
24 (Good)
o3
137 (Unhealthy for Sensitive Groups)
113 (Moderate)
99 (Moderate)
79 (Moderate)
64 (Good)
49 (Good)
45 (Good)
72 (Moderate)
94 (Moderate)
127 (Unhealthy for Sensitive Groups)
97 (Moderate)
101 (Moderate)
107 (Moderate)
107 (Moderate)
86 (Moderate)
71 (Moderate)
53 (Good)
43 (Good)
62 (Good)
76 (Moderate)
pm10
82 (Unhealthy)
63 (Unhealthy for Sensitive Groups)
70 (Unhealthy for Sensitive Groups)
80 (Unhealthy)
83 (Unhealthy)
103 (Unhealthy)
84 (Unhealthy)
45 (Moderate)
61 (Unhealthy for Sensitive Groups)
68 (Unhealthy for Sensitive Groups)
51 (Unhealthy for Sensitive Groups)
52 (Unhealthy for Sensitive Groups)
74 (Unhealthy for Sensitive Groups)
65 (Unhealthy for Sensitive Groups)
74 (Unhealthy for Sensitive Groups)
90 (Unhealthy)
118 (Very Unhealthy)
96 (Unhealthy)
77 (Unhealthy for Sensitive Groups)
75 (Unhealthy for Sensitive Groups)
so2
4.7 (Good)
4.9 (Good)
4.5 (Good)
4.8 (Good)
8.4 (Good)
8.7 (Good)
4.3 (Good)
4.8 (Good)
2.2 (Good)
4.2 (Good)
6.5 (Good)
9.5 (Good)
6 (Good)
4.7 (Good)
6.7 (Good)
5.4 (Good)
3.9 (Good)
6.8 (Good)
6.9 (Good)
6.3 (Good)
data source »
高坪区监测站
Freitag, 27. Mai 2022, 15:00
PM2,5 61 (ungesund)
Feinstaub (PM2,5)
NO2 22 (gut)
Stickstoffdioxid (NO2)
PM10 69 (Ungesund für sensible Gruppen)
Feinstaub (PM10) Schwebestaub
CO 219 (gut)
Kohlenmonoxid (CO)
O3 0.05 (gut)
Ozon (O3)
SO2 7.7 (gut)
Schwefeldioxid (SO2)
高坪区监测站
index
2022-05-27
pm25
28
no2
22
pm10
35
co
579
o3
22
so2
4.6
高坪区监测站
2018-10 2020-05

index
2020-05
2020-04
2020-03
2020-02
2020-01
2019-12
2019-11
2019-10
2019-09
2019-08
2019-07
2019-06
2019-05
2019-04
2019-03
2019-02
2019-01
2018-12
2018-11
2018-10
pm25
45
36
39
58
58
66
43
22
32
31
21
23
39
31
43
62
87
64
51
47
co
635
565
557
714
941
848
658
554
588
536
550
567
551
636
664
902
1
754
655
692
no2
35
30
26
20
30
33
34
24
22
21
20
25
26
34
36
29
42
27
30
24
o3
137
113
99
79
64
49
45
72
94
127
97
101
107
107
86
71
53
43
62
76
pm10
82
63
70
80
83
103
84
45
61
68
51
52
74
65
74
90
118
96
77
75
so2
4.7
4.9
4.5
4.8
8.4
8.7
4.3
4.8
2.2
4.2
6.5
9.5
6
4.7
6.7
5.4
3.9
6.8
6.9
6.3
* Pollution data source:
https://openaq.org
(ChinaAQIData)
The data is licensed under CC-By 4.0
PM2,5 61 (ungesund)
NO2 22 (gut)
PM10 69 (Ungesund für sensible Gruppen)
CO 219 (gut)
O3 0 (gut)
SO2 8 (gut)
Daten zur Luftverschmutzung der letzten Tage in Gaoping
| index | 2022-05-27 |
|---|---|
| pm25 | 28 Moderate |
| no2 | 22 Good |
| pm10 | 35 Moderate |
| co | 579 Good |
| o3 | 22 Good |
| so2 | 5 Good |

| index | 2020-05 | 2020-04 | 2020-03 | 2020-02 | 2020-01 | 2019-12 | 2019-11 | 2019-10 | 2019-09 | 2019-08 | 2019-07 | 2019-06 | 2019-05 | 2019-04 | 2019-03 | 2019-02 | 2019-01 | 2018-12 | 2018-11 | 2018-10 |
|---|---|---|---|---|---|---|---|---|---|---|---|---|---|---|---|---|---|---|---|---|
| pm25 | 45 (Unhealthy for Sensitive Groups) | 36 (Unhealthy for Sensitive Groups) | 39 (Unhealthy for Sensitive Groups) | 58 (Unhealthy) | 58 (Unhealthy) | 66 (Unhealthy) | 43 (Unhealthy for Sensitive Groups) | 22 (Moderate) | 32 (Moderate) | 31 (Moderate) | 21 (Moderate) | 23 (Moderate) | 39 (Unhealthy for Sensitive Groups) | 31 (Moderate) | 43 (Unhealthy for Sensitive Groups) | 62 (Unhealthy) | 87 (Very Unhealthy) | 64 (Unhealthy) | 51 (Unhealthy for Sensitive Groups) | 47 (Unhealthy for Sensitive Groups) |
| co | 635 (Good) | 565 (Good) | 557 (Good) | 714 (Good) | 941 (Good) | 848 (Good) | 658 (Good) | 554 (Good) | 588 (Good) | 536 (Good) | 550 (Good) | 567 (Good) | 551 (Good) | 636 (Good) | 664 (Good) | 902 (Good) | 1 (Good) | 754 (Good) | 655 (Good) | 692 (Good) |
| no2 | 35 (Good) | 30 (Good) | 26 (Good) | 20 (Good) | 30 (Good) | 33 (Good) | 34 (Good) | 24 (Good) | 22 (Good) | 21 (Good) | 20 (Good) | 25 (Good) | 26 (Good) | 34 (Good) | 36 (Good) | 29 (Good) | 42 (Moderate) | 27 (Good) | 30 (Good) | 24 (Good) |
| o3 | 137 (Unhealthy for Sensitive Groups) | 113 (Moderate) | 99 (Moderate) | 79 (Moderate) | 64 (Good) | 49 (Good) | 45 (Good) | 72 (Moderate) | 94 (Moderate) | 127 (Unhealthy for Sensitive Groups) | 97 (Moderate) | 101 (Moderate) | 107 (Moderate) | 107 (Moderate) | 86 (Moderate) | 71 (Moderate) | 53 (Good) | 43 (Good) | 62 (Good) | 76 (Moderate) |
| pm10 | 82 (Unhealthy) | 63 (Unhealthy for Sensitive Groups) | 70 (Unhealthy for Sensitive Groups) | 80 (Unhealthy) | 83 (Unhealthy) | 103 (Unhealthy) | 84 (Unhealthy) | 45 (Moderate) | 61 (Unhealthy for Sensitive Groups) | 68 (Unhealthy for Sensitive Groups) | 51 (Unhealthy for Sensitive Groups) | 52 (Unhealthy for Sensitive Groups) | 74 (Unhealthy for Sensitive Groups) | 65 (Unhealthy for Sensitive Groups) | 74 (Unhealthy for Sensitive Groups) | 90 (Unhealthy) | 118 (Very Unhealthy) | 96 (Unhealthy) | 77 (Unhealthy for Sensitive Groups) | 75 (Unhealthy for Sensitive Groups) |
| so2 | 4.7 (Good) | 4.9 (Good) | 4.5 (Good) | 4.8 (Good) | 8.4 (Good) | 8.7 (Good) | 4.3 (Good) | 4.8 (Good) | 2.2 (Good) | 4.2 (Good) | 6.5 (Good) | 9.5 (Good) | 6 (Good) | 4.7 (Good) | 6.7 (Good) | 5.4 (Good) | 3.9 (Good) | 6.8 (Good) | 6.9 (Good) | 6.3 (Good) |
PM2,5 61 (ungesund)
Feinstaub (PM2,5)NO2 22 (gut)
Stickstoffdioxid (NO2)PM10 69 (Ungesund für sensible Gruppen)
Feinstaub (PM10) SchwebestaubCO 219 (gut)
Kohlenmonoxid (CO)O3 0.05 (gut)
Ozon (O3)SO2 7.7 (gut)
Schwefeldioxid (SO2)高坪区监测站
| index | 2022-05-27 |
|---|---|
| pm25 | 28 |
| no2 | 22 |
| pm10 | 35 |
| co | 579 |
| o3 | 22 |
| so2 | 4.6 |
高坪区监测站

| index | 2020-05 | 2020-04 | 2020-03 | 2020-02 | 2020-01 | 2019-12 | 2019-11 | 2019-10 | 2019-09 | 2019-08 | 2019-07 | 2019-06 | 2019-05 | 2019-04 | 2019-03 | 2019-02 | 2019-01 | 2018-12 | 2018-11 | 2018-10 |
|---|---|---|---|---|---|---|---|---|---|---|---|---|---|---|---|---|---|---|---|---|
| pm25 | 45 | 36 | 39 | 58 | 58 | 66 | 43 | 22 | 32 | 31 | 21 | 23 | 39 | 31 | 43 | 62 | 87 | 64 | 51 | 47 |
| co | 635 | 565 | 557 | 714 | 941 | 848 | 658 | 554 | 588 | 536 | 550 | 567 | 551 | 636 | 664 | 902 | 1 | 754 | 655 | 692 |
| no2 | 35 | 30 | 26 | 20 | 30 | 33 | 34 | 24 | 22 | 21 | 20 | 25 | 26 | 34 | 36 | 29 | 42 | 27 | 30 | 24 |
| o3 | 137 | 113 | 99 | 79 | 64 | 49 | 45 | 72 | 94 | 127 | 97 | 101 | 107 | 107 | 86 | 71 | 53 | 43 | 62 | 76 |
| pm10 | 82 | 63 | 70 | 80 | 83 | 103 | 84 | 45 | 61 | 68 | 51 | 52 | 74 | 65 | 74 | 90 | 118 | 96 | 77 | 75 |
| so2 | 4.7 | 4.9 | 4.5 | 4.8 | 8.4 | 8.7 | 4.3 | 4.8 | 2.2 | 4.2 | 6.5 | 9.5 | 6 | 4.7 | 6.7 | 5.4 | 3.9 | 6.8 | 6.9 | 6.3 |