Luftverschmutzung in Changning: Echtzeit-Luft-Qualitätsindex und Smog-Alarm.
Für die Changning. Heute ist Donnerstag, 4. Juni 2026. Für Changning wurden folgende Luftverschmutzungswerte gemessen:- Feinstaub (PM10) Schwebestaub - 53 (Ungesund für sensible Gruppen)
- Ozon (O3) - 0 (gut)
- Feinstaub (PM2,5) - 7 (gut)
- Schwefeldioxid (SO2) - 18 (gut)
- Stickstoffdioxid (NO2) - 3 (gut)
- Kohlenmonoxid (CO) - 1 (gut)

Wie ist die Luftqualität Changning heute? Ist die Luft in Changning? verschmutzt. Gibt es Smog?
Wie hoch ist der PM10-Stand heute in Changning? (Feinstaub (PM10) Schwebestaub)
Der aktuelle Feinstaubgehalt PM10 in Changning is:
53 (Ungesund für sensible Gruppen)
Die höchsten PM10-Werte treten in der Regel im Monat auf: 72 (März 2019).
Der niedrigste Wert der Feinstaub-PM10-Belastung in Changning ist in der Regel in: Februar (35).
Wie ist das O3-Niveau heute in Changning? (Ozon (O3))
0 (gut)
Wie hoch ist der aktuelle PM2,5-Wert in Changning? (Feinstaub (PM2,5))
Die heutige PM2.5-Stufe ist:
7 (gut)
Zum Vergleich: Der höchste PM2,5-Wert in Changning in den letzten 7 Tagen war: 21 (Freitag, 27. Mai 2022) und der niedrigste: 21 (Freitag, 27. Mai 2022).
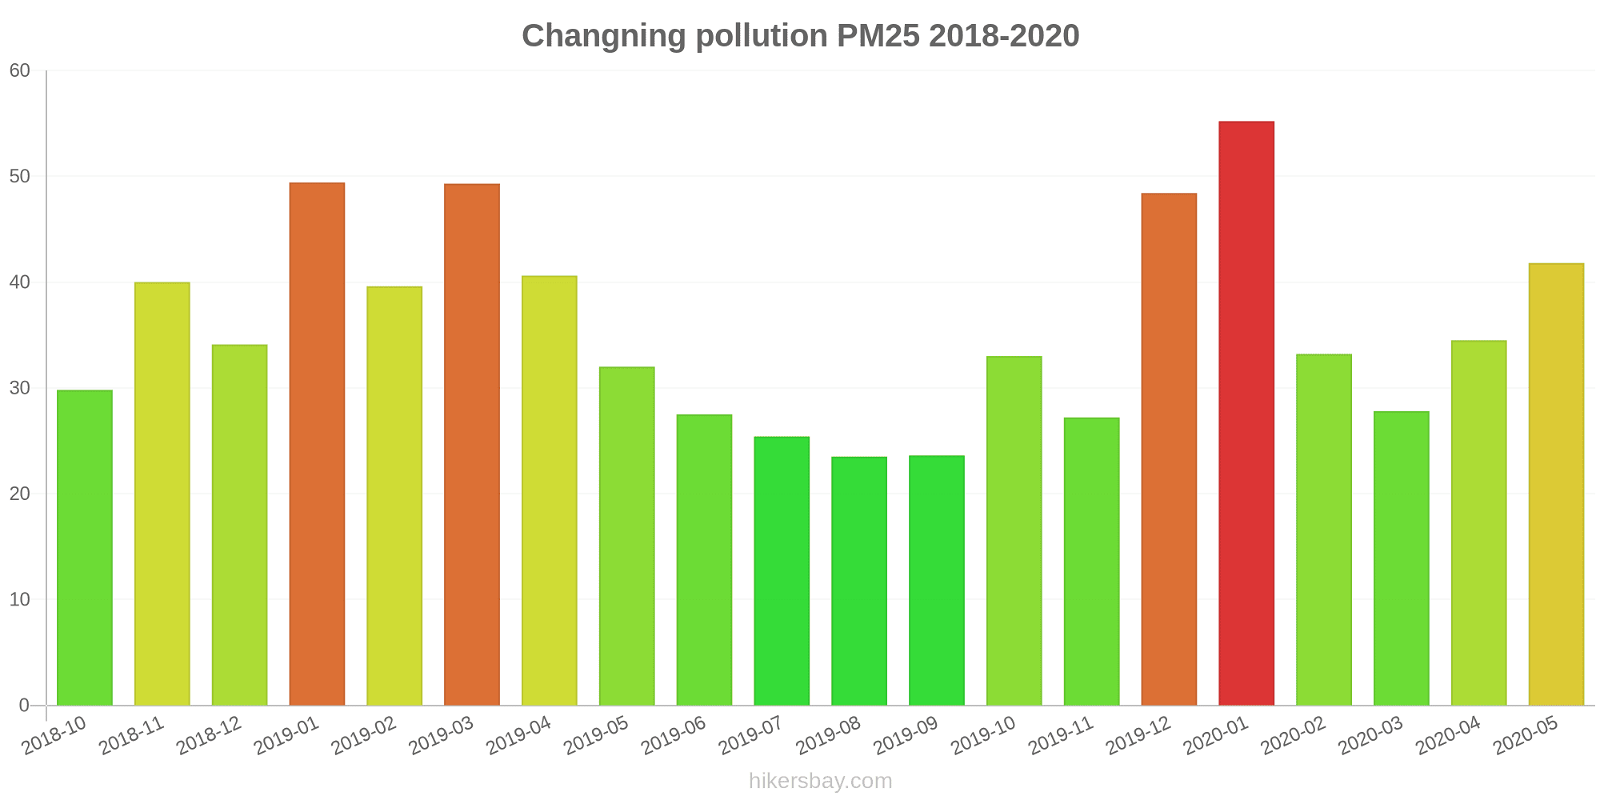
Die höchsten PM2,5-Werte wurden gemessen: 55 (Januar 2020).
Die niedrigste Feinstaubbelastung PM2,5 tritt im Monat auf: August (24).
Wie hoch ist die SO2-Belastung? (Schwefeldioxid (SO2))
18 (gut)
Wie hoch ist das NO2-Niveau? (Stickstoffdioxid (NO2))
3 (gut)
Wie hoch ist der CO-Gehalt? (Kohlenmonoxid (CO))
1 (gut)
Aktuelle Daten Freitag, 27. Mai 2022, 12:00
PM10 53 (Ungesund für sensible Gruppen)
O3 0 (gut)
PM2,5 7 (gut)
SO2 18 (gut)
NO2 3 (gut)
CO 1 (gut)
Daten zur Luftverschmutzung der letzten Tage in Changning
index
2022-05-27
pm10
51
Unhealthy for Sensitive Groups
o3
0
Good
pm25
21
Moderate
so2
10
Good
no2
0
Good
co
1
Good
data source »
Luftverschmutzung in Changning von Oktober 2018 bis Mai 2020
index
2020-05
2020-04
2020-03
2020-02
2020-01
2019-12
2019-11
2019-10
2019-09
2019-08
2019-07
2019-06
2019-05
2019-04
2019-03
2019-02
2019-01
2018-12
2018-11
2018-10
pm25
42 (Unhealthy for Sensitive Groups)
35 (Moderate)
28 (Moderate)
33 (Moderate)
55 (Unhealthy)
48 (Unhealthy for Sensitive Groups)
27 (Moderate)
33 (Moderate)
24 (Moderate)
24 (Moderate)
25 (Moderate)
28 (Moderate)
32 (Moderate)
41 (Unhealthy for Sensitive Groups)
49 (Unhealthy for Sensitive Groups)
40 (Unhealthy for Sensitive Groups)
49 (Unhealthy for Sensitive Groups)
34 (Moderate)
40 (Unhealthy for Sensitive Groups)
30 (Moderate)
co
770 (Good)
641 (Good)
649 (Good)
592 (Good)
1 (Good)
826 (Good)
650 (Good)
597 (Good)
592 (Good)
715 (Good)
548 (Good)
525 (Good)
596 (Good)
822 (Good)
883 (Good)
554 (Good)
807 (Good)
629 (Good)
641 (Good)
580 (Good)
no2
38 (Good)
43 (Moderate)
37 (Good)
33 (Good)
50 (Moderate)
68 (Moderate)
50 (Moderate)
45 (Moderate)
37 (Good)
30 (Good)
30 (Good)
26 (Good)
38 (Good)
49 (Moderate)
55 (Moderate)
40 (Good)
61 (Moderate)
48 (Moderate)
56 (Moderate)
45 (Moderate)
o3
153 (Unhealthy)
146 (Unhealthy for Sensitive Groups)
115 (Moderate)
101 (Moderate)
77 (Moderate)
75 (Moderate)
102 (Moderate)
116 (Moderate)
127 (Unhealthy for Sensitive Groups)
140 (Unhealthy for Sensitive Groups)
146 (Unhealthy for Sensitive Groups)
150 (Unhealthy)
163 (Unhealthy)
129 (Unhealthy for Sensitive Groups)
121 (Unhealthy for Sensitive Groups)
87 (Moderate)
72 (Moderate)
65 (Good)
100 (Moderate)
121 (Unhealthy for Sensitive Groups)
pm10
48 (Moderate)
56 (Unhealthy for Sensitive Groups)
40 (Moderate)
35 (Moderate)
47 (Moderate)
55 (Unhealthy for Sensitive Groups)
63 (Unhealthy for Sensitive Groups)
61 (Unhealthy for Sensitive Groups)
36 (Moderate)
40 (Moderate)
39 (Moderate)
37 (Moderate)
62 (Unhealthy for Sensitive Groups)
57 (Unhealthy for Sensitive Groups)
72 (Unhealthy for Sensitive Groups)
56 (Unhealthy for Sensitive Groups)
68 (Unhealthy for Sensitive Groups)
57 (Unhealthy for Sensitive Groups)
58 (Unhealthy for Sensitive Groups)
56 (Unhealthy for Sensitive Groups)
so2
4.3 (Good)
8.4 (Good)
9.5 (Good)
7.9 (Good)
7.5 (Good)
8.6 (Good)
8.3 (Good)
7.2 (Good)
5.3 (Good)
4.4 (Good)
2.8 (Good)
4.4 (Good)
6 (Good)
5.9 (Good)
7 (Good)
5.6 (Good)
11 (Good)
11 (Good)
8.4 (Good)
9.6 (Good)
data source »
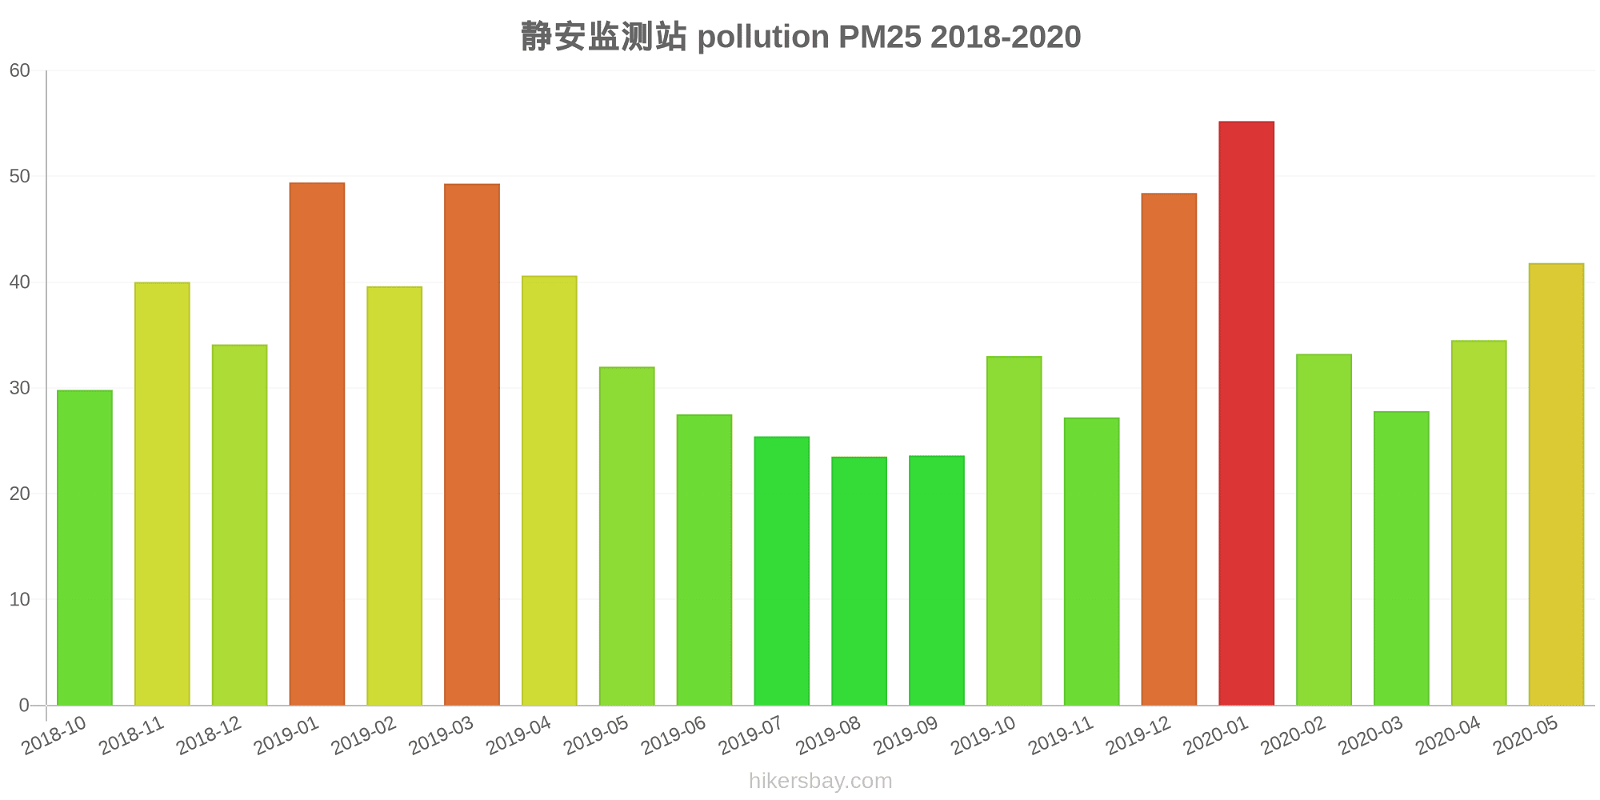
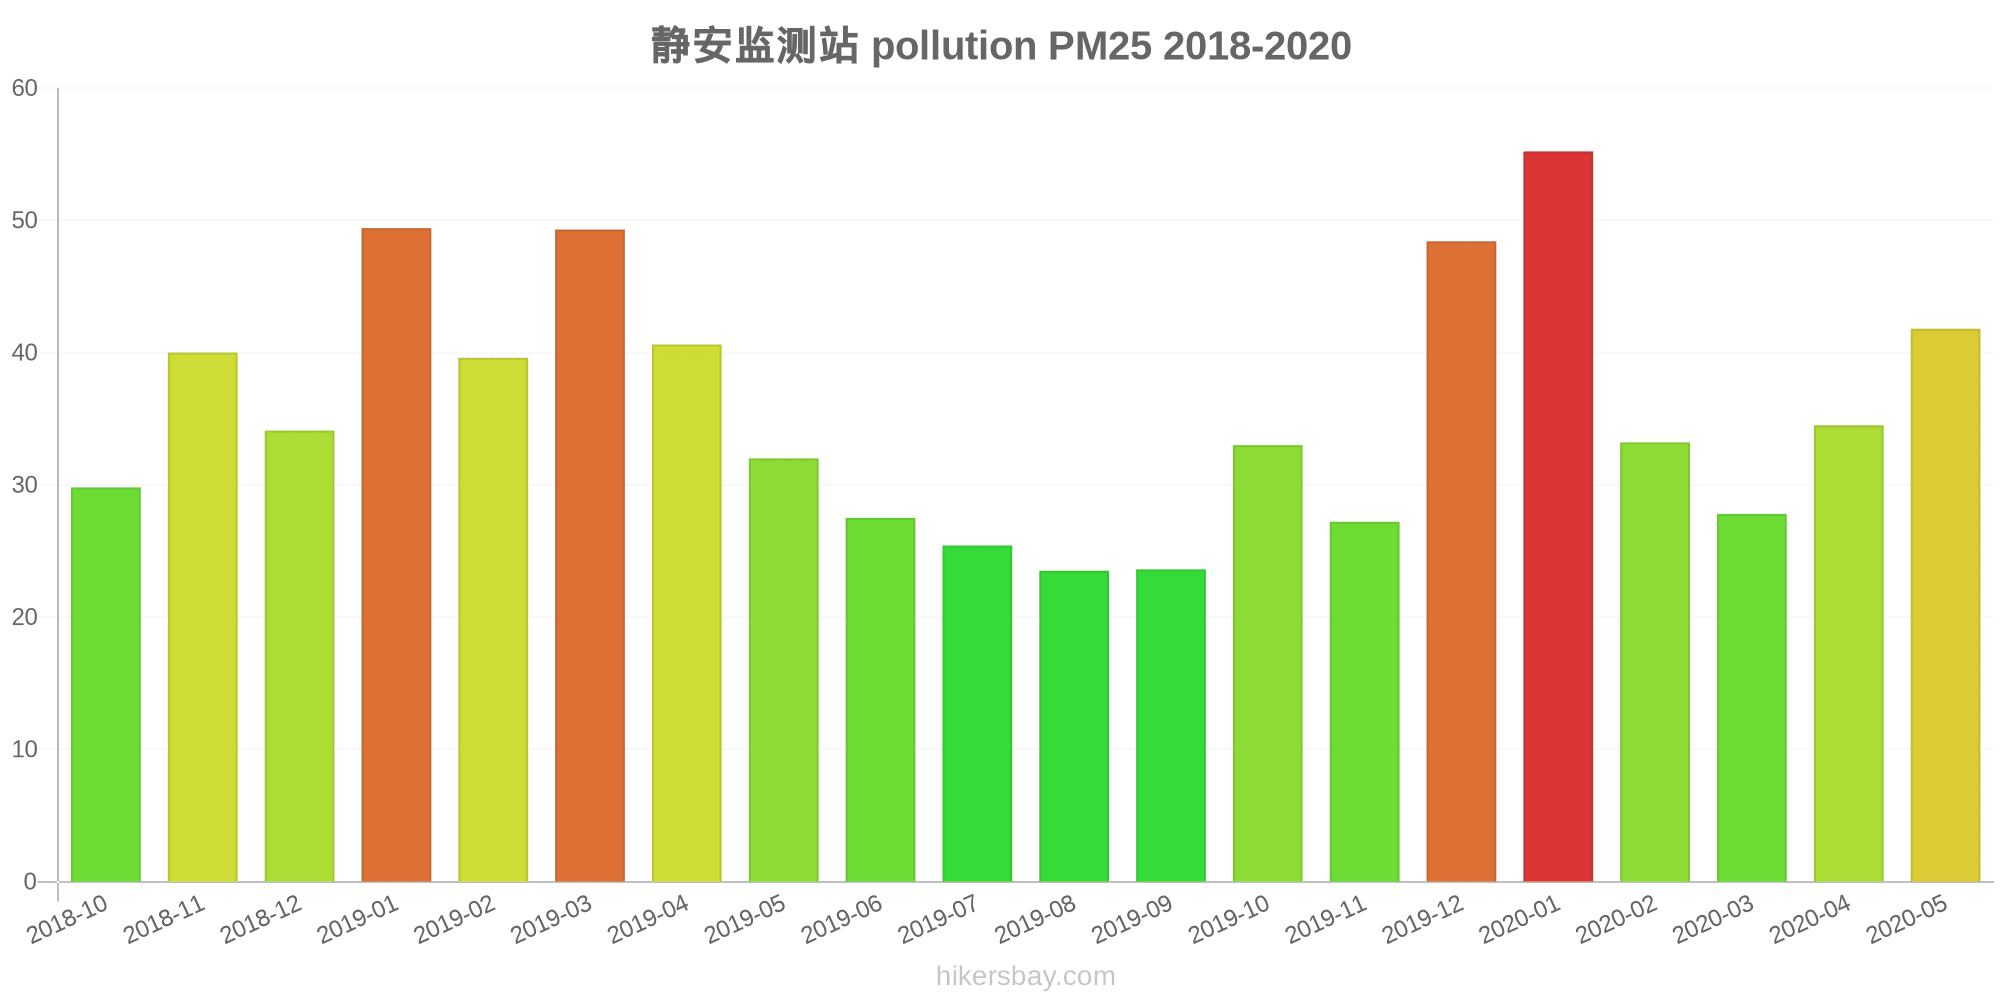
静安监测站
Freitag, 27. Mai 2022, 12:00
PM10 53 (Ungesund für sensible Gruppen)
Feinstaub (PM10) Schwebestaub
O3 0.02 (gut)
Ozon (O3)
PM2,5 6.6 (gut)
Feinstaub (PM2,5)
SO2 18 (gut)
Schwefeldioxid (SO2)
NO2 3 (gut)
Stickstoffdioxid (NO2)
CO 1.3 (gut)
Kohlenmonoxid (CO)
静安监测站
index
2022-05-27
pm10
51
o3
0.02
pm25
21
so2
9.6
no2
0.38
co
0.64
静安监测站
2018-10 2020-05
index
2020-05
2020-04
2020-03
2020-02
2020-01
2019-12
2019-11
2019-10
2019-09
2019-08
2019-07
2019-06
2019-05
2019-04
2019-03
2019-02
2019-01
2018-12
2018-11
2018-10
pm25
42
35
28
33
55
48
27
33
24
24
25
28
32
41
49
40
49
34
40
30
co
770
641
649
592
1
826
650
597
592
715
548
525
596
822
883
554
807
629
641
580
no2
38
43
37
33
50
68
50
45
37
30
30
26
38
49
55
40
61
48
56
45
o3
153
146
115
101
77
75
102
116
127
140
146
150
163
129
121
87
72
65
100
121
pm10
48
56
40
35
47
55
63
61
36
40
39
37
62
57
72
56
68
57
58
56
so2
4.3
8.4
9.5
7.9
7.5
8.6
8.3
7.2
5.3
4.4
2.8
4.4
6
5.9
7
5.6
11
11
8.4
9.6
* Pollution data source:
https://openaq.org
(ChinaAQIData)
The data is licensed under CC-By 4.0
PM10 53 (Ungesund für sensible Gruppen)
O3 0 (gut)
PM2,5 7 (gut)
SO2 18 (gut)
NO2 3 (gut)
CO 1 (gut)
Daten zur Luftverschmutzung der letzten Tage in Changning
| index | 2022-05-27 |
|---|---|
| pm10 | 51 Unhealthy for Sensitive Groups |
| o3 | 0 Good |
| pm25 | 21 Moderate |
| so2 | 10 Good |
| no2 | 0 Good |
| co | 1 Good |

| index | 2020-05 | 2020-04 | 2020-03 | 2020-02 | 2020-01 | 2019-12 | 2019-11 | 2019-10 | 2019-09 | 2019-08 | 2019-07 | 2019-06 | 2019-05 | 2019-04 | 2019-03 | 2019-02 | 2019-01 | 2018-12 | 2018-11 | 2018-10 |
|---|---|---|---|---|---|---|---|---|---|---|---|---|---|---|---|---|---|---|---|---|
| pm25 | 42 (Unhealthy for Sensitive Groups) | 35 (Moderate) | 28 (Moderate) | 33 (Moderate) | 55 (Unhealthy) | 48 (Unhealthy for Sensitive Groups) | 27 (Moderate) | 33 (Moderate) | 24 (Moderate) | 24 (Moderate) | 25 (Moderate) | 28 (Moderate) | 32 (Moderate) | 41 (Unhealthy for Sensitive Groups) | 49 (Unhealthy for Sensitive Groups) | 40 (Unhealthy for Sensitive Groups) | 49 (Unhealthy for Sensitive Groups) | 34 (Moderate) | 40 (Unhealthy for Sensitive Groups) | 30 (Moderate) |
| co | 770 (Good) | 641 (Good) | 649 (Good) | 592 (Good) | 1 (Good) | 826 (Good) | 650 (Good) | 597 (Good) | 592 (Good) | 715 (Good) | 548 (Good) | 525 (Good) | 596 (Good) | 822 (Good) | 883 (Good) | 554 (Good) | 807 (Good) | 629 (Good) | 641 (Good) | 580 (Good) |
| no2 | 38 (Good) | 43 (Moderate) | 37 (Good) | 33 (Good) | 50 (Moderate) | 68 (Moderate) | 50 (Moderate) | 45 (Moderate) | 37 (Good) | 30 (Good) | 30 (Good) | 26 (Good) | 38 (Good) | 49 (Moderate) | 55 (Moderate) | 40 (Good) | 61 (Moderate) | 48 (Moderate) | 56 (Moderate) | 45 (Moderate) |
| o3 | 153 (Unhealthy) | 146 (Unhealthy for Sensitive Groups) | 115 (Moderate) | 101 (Moderate) | 77 (Moderate) | 75 (Moderate) | 102 (Moderate) | 116 (Moderate) | 127 (Unhealthy for Sensitive Groups) | 140 (Unhealthy for Sensitive Groups) | 146 (Unhealthy for Sensitive Groups) | 150 (Unhealthy) | 163 (Unhealthy) | 129 (Unhealthy for Sensitive Groups) | 121 (Unhealthy for Sensitive Groups) | 87 (Moderate) | 72 (Moderate) | 65 (Good) | 100 (Moderate) | 121 (Unhealthy for Sensitive Groups) |
| pm10 | 48 (Moderate) | 56 (Unhealthy for Sensitive Groups) | 40 (Moderate) | 35 (Moderate) | 47 (Moderate) | 55 (Unhealthy for Sensitive Groups) | 63 (Unhealthy for Sensitive Groups) | 61 (Unhealthy for Sensitive Groups) | 36 (Moderate) | 40 (Moderate) | 39 (Moderate) | 37 (Moderate) | 62 (Unhealthy for Sensitive Groups) | 57 (Unhealthy for Sensitive Groups) | 72 (Unhealthy for Sensitive Groups) | 56 (Unhealthy for Sensitive Groups) | 68 (Unhealthy for Sensitive Groups) | 57 (Unhealthy for Sensitive Groups) | 58 (Unhealthy for Sensitive Groups) | 56 (Unhealthy for Sensitive Groups) |
| so2 | 4.3 (Good) | 8.4 (Good) | 9.5 (Good) | 7.9 (Good) | 7.5 (Good) | 8.6 (Good) | 8.3 (Good) | 7.2 (Good) | 5.3 (Good) | 4.4 (Good) | 2.8 (Good) | 4.4 (Good) | 6 (Good) | 5.9 (Good) | 7 (Good) | 5.6 (Good) | 11 (Good) | 11 (Good) | 8.4 (Good) | 9.6 (Good) |
PM10 53 (Ungesund für sensible Gruppen)
Feinstaub (PM10) SchwebestaubO3 0.02 (gut)
Ozon (O3)PM2,5 6.6 (gut)
Feinstaub (PM2,5)SO2 18 (gut)
Schwefeldioxid (SO2)NO2 3 (gut)
Stickstoffdioxid (NO2)CO 1.3 (gut)
Kohlenmonoxid (CO)静安监测站
| index | 2022-05-27 |
|---|---|
| pm10 | 51 |
| o3 | 0.02 |
| pm25 | 21 |
| so2 | 9.6 |
| no2 | 0.38 |
| co | 0.64 |
静安监测站
| index | 2020-05 | 2020-04 | 2020-03 | 2020-02 | 2020-01 | 2019-12 | 2019-11 | 2019-10 | 2019-09 | 2019-08 | 2019-07 | 2019-06 | 2019-05 | 2019-04 | 2019-03 | 2019-02 | 2019-01 | 2018-12 | 2018-11 | 2018-10 |
|---|---|---|---|---|---|---|---|---|---|---|---|---|---|---|---|---|---|---|---|---|
| pm25 | 42 | 35 | 28 | 33 | 55 | 48 | 27 | 33 | 24 | 24 | 25 | 28 | 32 | 41 | 49 | 40 | 49 | 34 | 40 | 30 |
| co | 770 | 641 | 649 | 592 | 1 | 826 | 650 | 597 | 592 | 715 | 548 | 525 | 596 | 822 | 883 | 554 | 807 | 629 | 641 | 580 |
| no2 | 38 | 43 | 37 | 33 | 50 | 68 | 50 | 45 | 37 | 30 | 30 | 26 | 38 | 49 | 55 | 40 | 61 | 48 | 56 | 45 |
| o3 | 153 | 146 | 115 | 101 | 77 | 75 | 102 | 116 | 127 | 140 | 146 | 150 | 163 | 129 | 121 | 87 | 72 | 65 | 100 | 121 |
| pm10 | 48 | 56 | 40 | 35 | 47 | 55 | 63 | 61 | 36 | 40 | 39 | 37 | 62 | 57 | 72 | 56 | 68 | 57 | 58 | 56 |
| so2 | 4.3 | 8.4 | 9.5 | 7.9 | 7.5 | 8.6 | 8.3 | 7.2 | 5.3 | 4.4 | 2.8 | 4.4 | 6 | 5.9 | 7 | 5.6 | 11 | 11 | 8.4 | 9.6 |