Luftverschmutzung in Beiwenquan: Echtzeit-Luft-Qualitätsindex und Smog-Alarm.
Für die Beiwenquan. Heute ist Donnerstag, 4. Juni 2026. Für Beiwenquan wurden folgende Luftverschmutzungswerte gemessen:- Feinstaub (PM10) Schwebestaub - 7 (gut)
- Feinstaub (PM2,5) - 2 (gut)
- Kohlenmonoxid (CO) - 100 (gut)
- Stickstoffdioxid (NO2) - 8 (gut)
- Ozon (O3) - 0 (gut)
- Schwefeldioxid (SO2) - 9 (gut)

Wie ist die Luftqualität Beiwenquan heute? Ist die Luft in Beiwenquan? verschmutzt. Gibt es Smog?
Wie hoch ist der PM10-Stand heute in Beiwenquan? (Feinstaub (PM10) Schwebestaub)
Der aktuelle Feinstaubgehalt PM10 in Beiwenquan is:
7 (gut)
Die höchsten PM10-Werte treten in der Regel im Monat auf: 120 (Januar 2019).
Der niedrigste Wert der Feinstaub-PM10-Belastung in Beiwenquan ist in der Regel in: Juli (38).
Wie hoch ist der aktuelle PM2,5-Wert in Beiwenquan? (Feinstaub (PM2,5))
Die heutige PM2.5-Stufe ist:
2 (gut)
Zum Vergleich: Der höchste PM2,5-Wert in Beiwenquan in den letzten 7 Tagen war: 24 (Freitag, 27. Mai 2022) und der niedrigste: 24 (Freitag, 27. Mai 2022).
Die höchsten PM2,5-Werte wurden gemessen: 84 (Januar 2019).
Die niedrigste Feinstaubbelastung PM2,5 tritt im Monat auf: Juli (21).
Wie hoch ist der CO-Gehalt? (Kohlenmonoxid (CO))
100 (gut)
Wie hoch ist das NO2-Niveau? (Stickstoffdioxid (NO2))
8 (gut)
Wie ist das O3-Niveau heute in Beiwenquan? (Ozon (O3))
0 (gut)
Wie hoch ist die SO2-Belastung? (Schwefeldioxid (SO2))
9 (gut)
Aktuelle Daten Freitag, 27. Mai 2022, 12:00
PM10 7 (gut)
PM2,5 2 (gut)
CO 100 (gut)
NO2 8 (gut)
O3 0 (gut)
SO2 9 (gut)
Daten zur Luftverschmutzung der letzten Tage in Beiwenquan
index
2022-05-27
pm10
32
Moderate
pm25
24
Moderate
co
468
Good
no2
21
Good
o3
32
Good
so2
5
Good
data source »
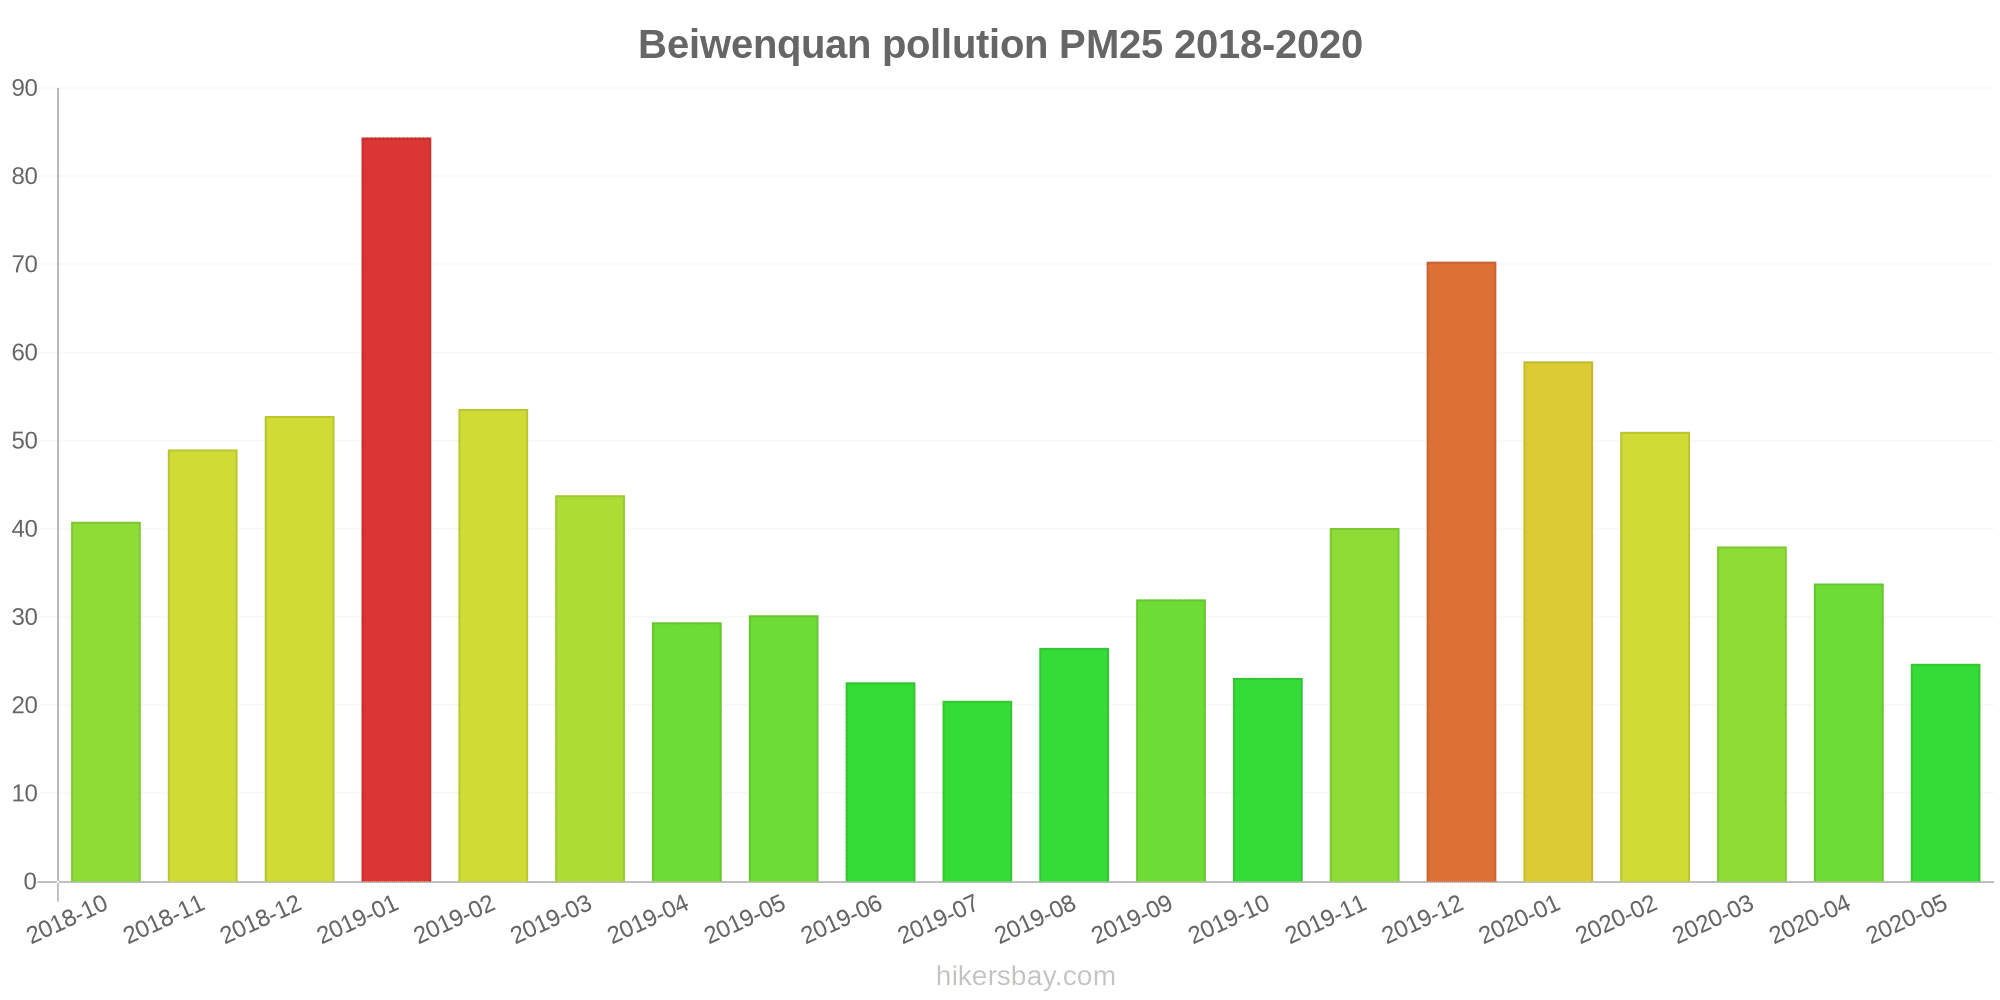
Luftverschmutzung in Beiwenquan von Oktober 2018 bis Mai 2020

index
2020-05
2020-04
2020-03
2020-02
2020-01
2019-12
2019-11
2019-10
2019-09
2019-08
2019-07
2019-06
2019-05
2019-04
2019-03
2019-02
2019-01
2018-12
2018-11
2018-10
pm25
25 (Moderate)
34 (Moderate)
38 (Unhealthy for Sensitive Groups)
51 (Unhealthy for Sensitive Groups)
59 (Unhealthy)
70 (Unhealthy)
40 (Unhealthy for Sensitive Groups)
23 (Moderate)
32 (Moderate)
27 (Moderate)
21 (Moderate)
23 (Moderate)
30 (Moderate)
29 (Moderate)
44 (Unhealthy for Sensitive Groups)
54 (Unhealthy for Sensitive Groups)
84 (Very Unhealthy)
53 (Unhealthy for Sensitive Groups)
49 (Unhealthy for Sensitive Groups)
41 (Unhealthy for Sensitive Groups)
co
640 (Good)
849 (Good)
804 (Good)
865 (Good)
985 (Good)
930 (Good)
802 (Good)
724 (Good)
775 (Good)
749 (Good)
616 (Good)
737 (Good)
722 (Good)
667 (Good)
655 (Good)
668 (Good)
965 (Good)
909 (Good)
854 (Good)
1 (Good)
no2
29 (Good)
38 (Good)
31 (Good)
21 (Good)
35 (Good)
40 (Good)
37 (Good)
31 (Good)
36 (Good)
33 (Good)
29 (Good)
31 (Good)
31 (Good)
33 (Good)
40 (Good)
30 (Good)
44 (Moderate)
38 (Good)
40 (Good)
39 (Good)
o3
174 (Unhealthy)
106 (Moderate)
101 (Moderate)
66 (Good)
50 (Good)
32 (Good)
39 (Good)
66 (Good)
119 (Moderate)
189 (Very Unhealthy)
138 (Unhealthy for Sensitive Groups)
115 (Moderate)
110 (Moderate)
131 (Unhealthy for Sensitive Groups)
91 (Moderate)
61 (Good)
30 (Good)
21 (Good)
36 (Good)
33 (Good)
pm10
53 (Unhealthy for Sensitive Groups)
59 (Unhealthy for Sensitive Groups)
63 (Unhealthy for Sensitive Groups)
65 (Unhealthy for Sensitive Groups)
83 (Unhealthy)
101 (Unhealthy)
67 (Unhealthy for Sensitive Groups)
39 (Moderate)
53 (Unhealthy for Sensitive Groups)
48 (Moderate)
38 (Moderate)
44 (Moderate)
56 (Unhealthy for Sensitive Groups)
56 (Unhealthy for Sensitive Groups)
70 (Unhealthy for Sensitive Groups)
77 (Unhealthy for Sensitive Groups)
120 (Very Unhealthy)
79 (Unhealthy for Sensitive Groups)
74 (Unhealthy for Sensitive Groups)
72 (Unhealthy for Sensitive Groups)
so2
8.9 (Good)
7.9 (Good)
9.8 (Good)
6.2 (Good)
11 (Good)
11 (Good)
8.3 (Good)
7.8 (Good)
9.9 (Good)
9.4 (Good)
7.5 (Good)
8.4 (Good)
8.3 (Good)
11 (Good)
12 (Good)
12 (Good)
12 (Good)
12 (Good)
12 (Good)
11 (Good)
data source »
天生
Freitag, 27. Mai 2022, 12:00
PM10 6.7 (gut)
Feinstaub (PM10) Schwebestaub
PM2,5 1.7 (gut)
Feinstaub (PM2,5)
CO 100 (gut)
Kohlenmonoxid (CO)
NO2 7.6 (gut)
Stickstoffdioxid (NO2)
O3 0.02 (gut)
Ozon (O3)
SO2 8.6 (gut)
Schwefeldioxid (SO2)
天生
index
2022-05-27
pm10
32
pm25
24
co
468
no2
21
o3
32
so2
4.6
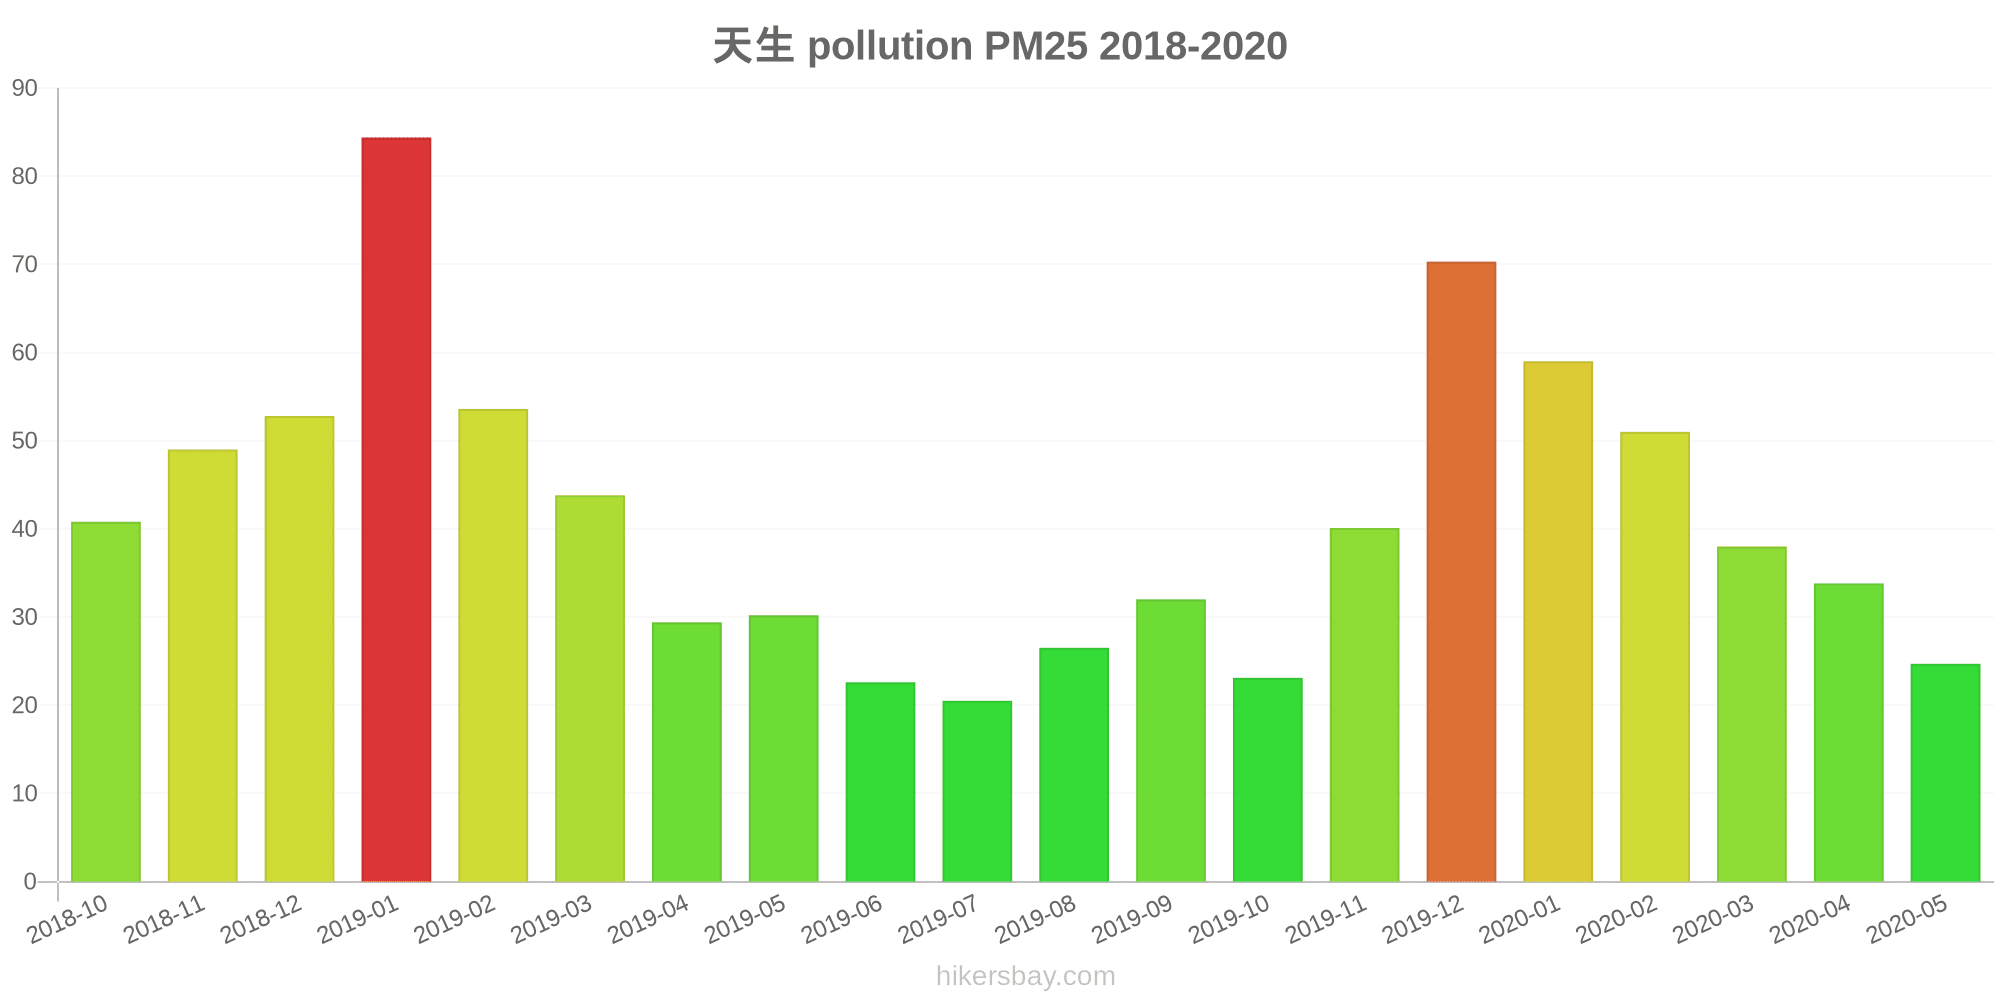
天生
2018-10 2020-05

index
2020-05
2020-04
2020-03
2020-02
2020-01
2019-12
2019-11
2019-10
2019-09
2019-08
2019-07
2019-06
2019-05
2019-04
2019-03
2019-02
2019-01
2018-12
2018-11
2018-10
pm25
25
34
38
51
59
70
40
23
32
27
21
23
30
29
44
54
84
53
49
41
co
640
849
804
865
985
930
802
724
775
749
616
737
722
667
655
668
965
909
854
1
no2
29
38
31
21
35
40
37
31
36
33
29
31
31
33
40
30
44
38
40
39
o3
174
106
101
66
50
32
39
66
119
189
138
115
110
131
91
61
30
21
36
33
pm10
53
59
63
65
83
101
67
39
53
48
38
44
56
56
70
77
120
79
74
72
so2
8.9
7.9
9.8
6.2
11
11
8.3
7.8
9.9
9.4
7.5
8.4
8.3
11
12
12
12
12
12
11
* Pollution data source:
https://openaq.org
(ChinaAQIData)
The data is licensed under CC-By 4.0
PM10 7 (gut)
PM2,5 2 (gut)
CO 100 (gut)
NO2 8 (gut)
O3 0 (gut)
SO2 9 (gut)
Daten zur Luftverschmutzung der letzten Tage in Beiwenquan
| index | 2022-05-27 |
|---|---|
| pm10 | 32 Moderate |
| pm25 | 24 Moderate |
| co | 468 Good |
| no2 | 21 Good |
| o3 | 32 Good |
| so2 | 5 Good |
| index | 2020-05 | 2020-04 | 2020-03 | 2020-02 | 2020-01 | 2019-12 | 2019-11 | 2019-10 | 2019-09 | 2019-08 | 2019-07 | 2019-06 | 2019-05 | 2019-04 | 2019-03 | 2019-02 | 2019-01 | 2018-12 | 2018-11 | 2018-10 |
|---|---|---|---|---|---|---|---|---|---|---|---|---|---|---|---|---|---|---|---|---|
| pm25 | 25 (Moderate) | 34 (Moderate) | 38 (Unhealthy for Sensitive Groups) | 51 (Unhealthy for Sensitive Groups) | 59 (Unhealthy) | 70 (Unhealthy) | 40 (Unhealthy for Sensitive Groups) | 23 (Moderate) | 32 (Moderate) | 27 (Moderate) | 21 (Moderate) | 23 (Moderate) | 30 (Moderate) | 29 (Moderate) | 44 (Unhealthy for Sensitive Groups) | 54 (Unhealthy for Sensitive Groups) | 84 (Very Unhealthy) | 53 (Unhealthy for Sensitive Groups) | 49 (Unhealthy for Sensitive Groups) | 41 (Unhealthy for Sensitive Groups) |
| co | 640 (Good) | 849 (Good) | 804 (Good) | 865 (Good) | 985 (Good) | 930 (Good) | 802 (Good) | 724 (Good) | 775 (Good) | 749 (Good) | 616 (Good) | 737 (Good) | 722 (Good) | 667 (Good) | 655 (Good) | 668 (Good) | 965 (Good) | 909 (Good) | 854 (Good) | 1 (Good) |
| no2 | 29 (Good) | 38 (Good) | 31 (Good) | 21 (Good) | 35 (Good) | 40 (Good) | 37 (Good) | 31 (Good) | 36 (Good) | 33 (Good) | 29 (Good) | 31 (Good) | 31 (Good) | 33 (Good) | 40 (Good) | 30 (Good) | 44 (Moderate) | 38 (Good) | 40 (Good) | 39 (Good) |
| o3 | 174 (Unhealthy) | 106 (Moderate) | 101 (Moderate) | 66 (Good) | 50 (Good) | 32 (Good) | 39 (Good) | 66 (Good) | 119 (Moderate) | 189 (Very Unhealthy) | 138 (Unhealthy for Sensitive Groups) | 115 (Moderate) | 110 (Moderate) | 131 (Unhealthy for Sensitive Groups) | 91 (Moderate) | 61 (Good) | 30 (Good) | 21 (Good) | 36 (Good) | 33 (Good) |
| pm10 | 53 (Unhealthy for Sensitive Groups) | 59 (Unhealthy for Sensitive Groups) | 63 (Unhealthy for Sensitive Groups) | 65 (Unhealthy for Sensitive Groups) | 83 (Unhealthy) | 101 (Unhealthy) | 67 (Unhealthy for Sensitive Groups) | 39 (Moderate) | 53 (Unhealthy for Sensitive Groups) | 48 (Moderate) | 38 (Moderate) | 44 (Moderate) | 56 (Unhealthy for Sensitive Groups) | 56 (Unhealthy for Sensitive Groups) | 70 (Unhealthy for Sensitive Groups) | 77 (Unhealthy for Sensitive Groups) | 120 (Very Unhealthy) | 79 (Unhealthy for Sensitive Groups) | 74 (Unhealthy for Sensitive Groups) | 72 (Unhealthy for Sensitive Groups) |
| so2 | 8.9 (Good) | 7.9 (Good) | 9.8 (Good) | 6.2 (Good) | 11 (Good) | 11 (Good) | 8.3 (Good) | 7.8 (Good) | 9.9 (Good) | 9.4 (Good) | 7.5 (Good) | 8.4 (Good) | 8.3 (Good) | 11 (Good) | 12 (Good) | 12 (Good) | 12 (Good) | 12 (Good) | 12 (Good) | 11 (Good) |
PM10 6.7 (gut)
Feinstaub (PM10) SchwebestaubPM2,5 1.7 (gut)
Feinstaub (PM2,5)CO 100 (gut)
Kohlenmonoxid (CO)NO2 7.6 (gut)
Stickstoffdioxid (NO2)O3 0.02 (gut)
Ozon (O3)SO2 8.6 (gut)
Schwefeldioxid (SO2)天生
| index | 2022-05-27 |
|---|---|
| pm10 | 32 |
| pm25 | 24 |
| co | 468 |
| no2 | 21 |
| o3 | 32 |
| so2 | 4.6 |
天生
| index | 2020-05 | 2020-04 | 2020-03 | 2020-02 | 2020-01 | 2019-12 | 2019-11 | 2019-10 | 2019-09 | 2019-08 | 2019-07 | 2019-06 | 2019-05 | 2019-04 | 2019-03 | 2019-02 | 2019-01 | 2018-12 | 2018-11 | 2018-10 |
|---|---|---|---|---|---|---|---|---|---|---|---|---|---|---|---|---|---|---|---|---|
| pm25 | 25 | 34 | 38 | 51 | 59 | 70 | 40 | 23 | 32 | 27 | 21 | 23 | 30 | 29 | 44 | 54 | 84 | 53 | 49 | 41 |
| co | 640 | 849 | 804 | 865 | 985 | 930 | 802 | 724 | 775 | 749 | 616 | 737 | 722 | 667 | 655 | 668 | 965 | 909 | 854 | 1 |
| no2 | 29 | 38 | 31 | 21 | 35 | 40 | 37 | 31 | 36 | 33 | 29 | 31 | 31 | 33 | 40 | 30 | 44 | 38 | 40 | 39 |
| o3 | 174 | 106 | 101 | 66 | 50 | 32 | 39 | 66 | 119 | 189 | 138 | 115 | 110 | 131 | 91 | 61 | 30 | 21 | 36 | 33 |
| pm10 | 53 | 59 | 63 | 65 | 83 | 101 | 67 | 39 | 53 | 48 | 38 | 44 | 56 | 56 | 70 | 77 | 120 | 79 | 74 | 72 |
| so2 | 8.9 | 7.9 | 9.8 | 6.2 | 11 | 11 | 8.3 | 7.8 | 9.9 | 9.4 | 7.5 | 8.4 | 8.3 | 11 | 12 | 12 | 12 | 12 | 12 | 11 |