Luftverschmutzung in Bayan Hot: Echtzeit-Luft-Qualitätsindex und Smog-Alarm.
Für die Bayan Hot. Heute ist Donnerstag, 4. Juni 2026. Für Bayan Hot wurden folgende Luftverschmutzungswerte gemessen:- Feinstaub (PM10) Schwebestaub - 7 (gut)
- Feinstaub (PM2,5) - 2 (gut)
- Kohlenmonoxid (CO) - 100 (gut)
- Stickstoffdioxid (NO2) - 8 (gut)
- Ozon (O3) - 0 (gut)
- Schwefeldioxid (SO2) - 9 (gut)

Wie ist die Luftqualität Bayan Hot heute? Ist die Luft in Bayan Hot? verschmutzt. Gibt es Smog?
Wie hoch ist der PM10-Stand heute in Bayan Hot? (Feinstaub (PM10) Schwebestaub)
Der aktuelle Feinstaubgehalt PM10 in Bayan Hot is:
7 (gut)
Die höchsten PM10-Werte treten in der Regel im Monat auf: 140 (Mai 2020).
Der niedrigste Wert der Feinstaub-PM10-Belastung in Bayan Hot ist in der Regel in: September (27).
Wie hoch ist der aktuelle PM2,5-Wert in Bayan Hot? (Feinstaub (PM2,5))
Die heutige PM2.5-Stufe ist:
2 (gut)
Zum Vergleich: Der höchste PM2,5-Wert in Bayan Hot in den letzten 7 Tagen war: 24 (Freitag, 27. Mai 2022) und der niedrigste: 24 (Freitag, 27. Mai 2022).
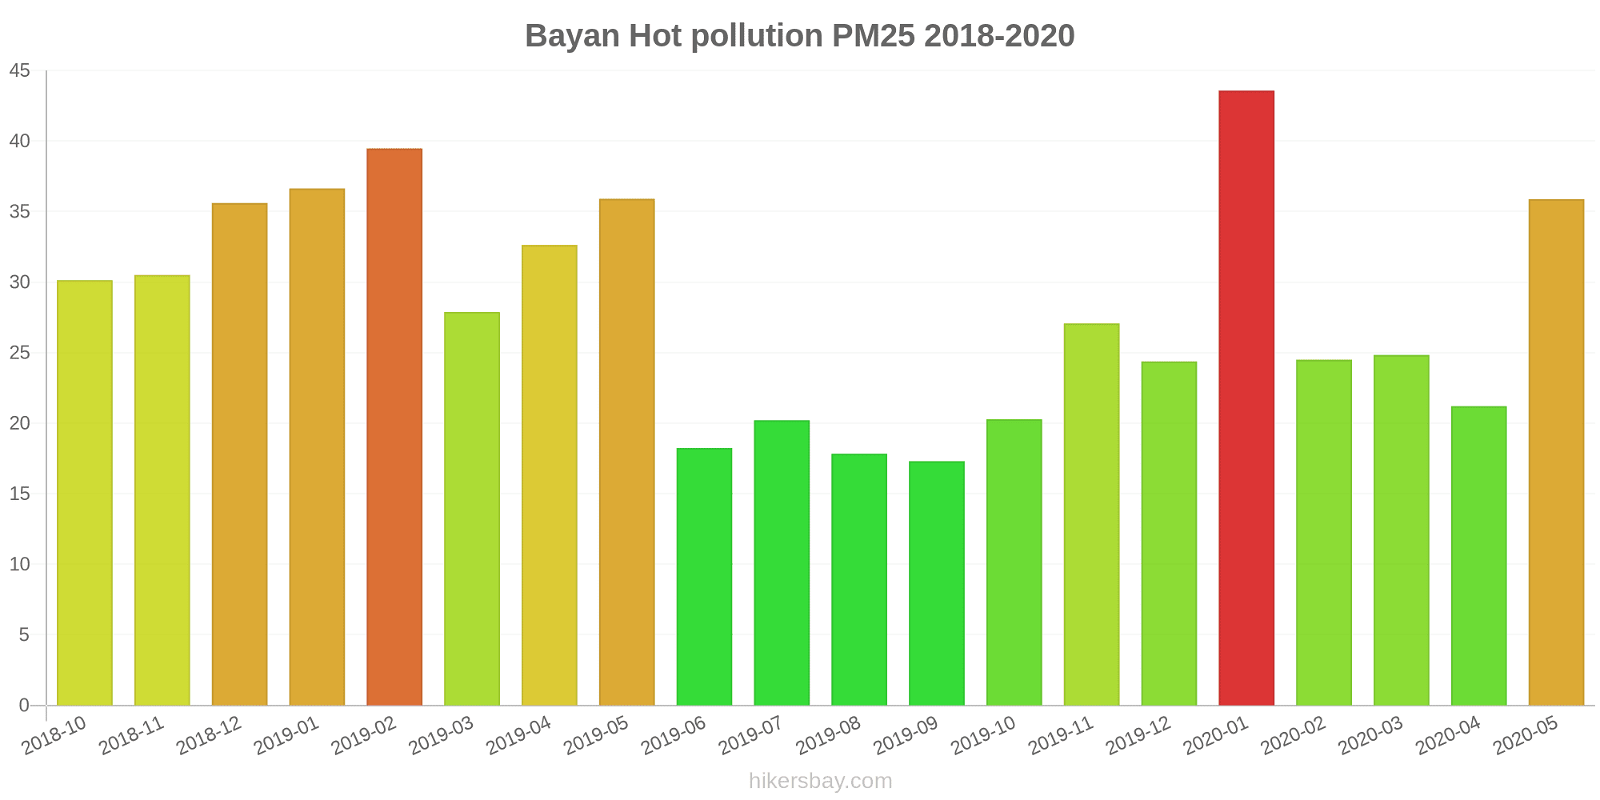
Die höchsten PM2,5-Werte wurden gemessen: 44 (Januar 2020).
Die niedrigste Feinstaubbelastung PM2,5 tritt im Monat auf: September (17).
Wie hoch ist der CO-Gehalt? (Kohlenmonoxid (CO))
100 (gut)
Wie hoch ist das NO2-Niveau? (Stickstoffdioxid (NO2))
8 (gut)
Wie ist das O3-Niveau heute in Bayan Hot? (Ozon (O3))
0 (gut)
Wie hoch ist die SO2-Belastung? (Schwefeldioxid (SO2))
9 (gut)
Aktuelle Daten Freitag, 27. Mai 2022, 12:00
PM10 7 (gut)
PM2,5 2 (gut)
CO 100 (gut)
NO2 8 (gut)
O3 0 (gut)
SO2 9 (gut)
Daten zur Luftverschmutzung der letzten Tage in Bayan Hot
index
2022-05-27
pm10
32
Moderate
pm25
24
Moderate
co
468
Good
no2
21
Good
o3
32
Good
so2
5
Good
data source »
Luftverschmutzung in Bayan Hot von Oktober 2018 bis Mai 2020
index
2020-05
2020-04
2020-03
2020-02
2020-01
2019-12
2019-11
2019-10
2019-09
2019-08
2019-07
2019-06
2019-05
2019-04
2019-03
2019-02
2019-01
2018-12
2018-11
2018-10
pm25
36 (Unhealthy for Sensitive Groups)
21 (Moderate)
25 (Moderate)
25 (Moderate)
44 (Unhealthy for Sensitive Groups)
24 (Moderate)
27 (Moderate)
20 (Moderate)
17 (Moderate)
18 (Moderate)
20 (Moderate)
18 (Moderate)
36 (Unhealthy for Sensitive Groups)
33 (Moderate)
28 (Moderate)
39 (Unhealthy for Sensitive Groups)
37 (Unhealthy for Sensitive Groups)
36 (Unhealthy for Sensitive Groups)
31 (Moderate)
30 (Moderate)
co
591 (Good)
466 (Good)
378 (Good)
388 (Good)
546 (Good)
497 (Good)
374 (Good)
305 (Good)
327 (Good)
422 (Good)
488 (Good)
523 (Good)
410 (Good)
505 (Good)
507 (Good)
639 (Good)
623 (Good)
629 (Good)
514 (Good)
528 (Good)
no2
6.8 (Good)
7.3 (Good)
6.7 (Good)
6.7 (Good)
17 (Good)
15 (Good)
14 (Good)
12 (Good)
9.1 (Good)
8.8 (Good)
7.9 (Good)
6.6 (Good)
6.7 (Good)
8.1 (Good)
9.6 (Good)
10 (Good)
17 (Good)
15 (Good)
12 (Good)
12 (Good)
o3
128 (Unhealthy for Sensitive Groups)
126 (Unhealthy for Sensitive Groups)
102 (Moderate)
92 (Moderate)
90 (Moderate)
85 (Moderate)
92 (Moderate)
100 (Moderate)
137 (Unhealthy for Sensitive Groups)
145 (Unhealthy for Sensitive Groups)
151 (Unhealthy)
139 (Unhealthy for Sensitive Groups)
142 (Unhealthy for Sensitive Groups)
135 (Unhealthy for Sensitive Groups)
121 (Unhealthy for Sensitive Groups)
103 (Moderate)
90 (Moderate)
82 (Moderate)
96 (Moderate)
106 (Moderate)
pm10
140 (Very Unhealthy)
54 (Unhealthy for Sensitive Groups)
82 (Unhealthy)
69 (Unhealthy for Sensitive Groups)
59 (Unhealthy for Sensitive Groups)
41 (Moderate)
58 (Unhealthy for Sensitive Groups)
43 (Moderate)
27 (Moderate)
34 (Moderate)
44 (Moderate)
35 (Moderate)
112 (Very Unhealthy)
99 (Unhealthy)
66 (Unhealthy for Sensitive Groups)
85 (Unhealthy)
57 (Unhealthy for Sensitive Groups)
92 (Unhealthy)
83 (Unhealthy)
55 (Unhealthy for Sensitive Groups)
so2
7.7 (Good)
7.6 (Good)
7.4 (Good)
7.8 (Good)
11 (Good)
11 (Good)
7.7 (Good)
6.7 (Good)
6.7 (Good)
7.1 (Good)
6.4 (Good)
6.5 (Good)
6.5 (Good)
7.6 (Good)
10 (Good)
12 (Good)
13 (Good)
12 (Good)
9.5 (Good)
8.5 (Good)
data source »
体育场
Freitag, 27. Mai 2022, 12:00
PM10 6.7 (gut)
Feinstaub (PM10) Schwebestaub
PM2,5 1.7 (gut)
Feinstaub (PM2,5)
CO 100 (gut)
Kohlenmonoxid (CO)
NO2 7.6 (gut)
Stickstoffdioxid (NO2)
O3 0.02 (gut)
Ozon (O3)
SO2 8.6 (gut)
Schwefeldioxid (SO2)
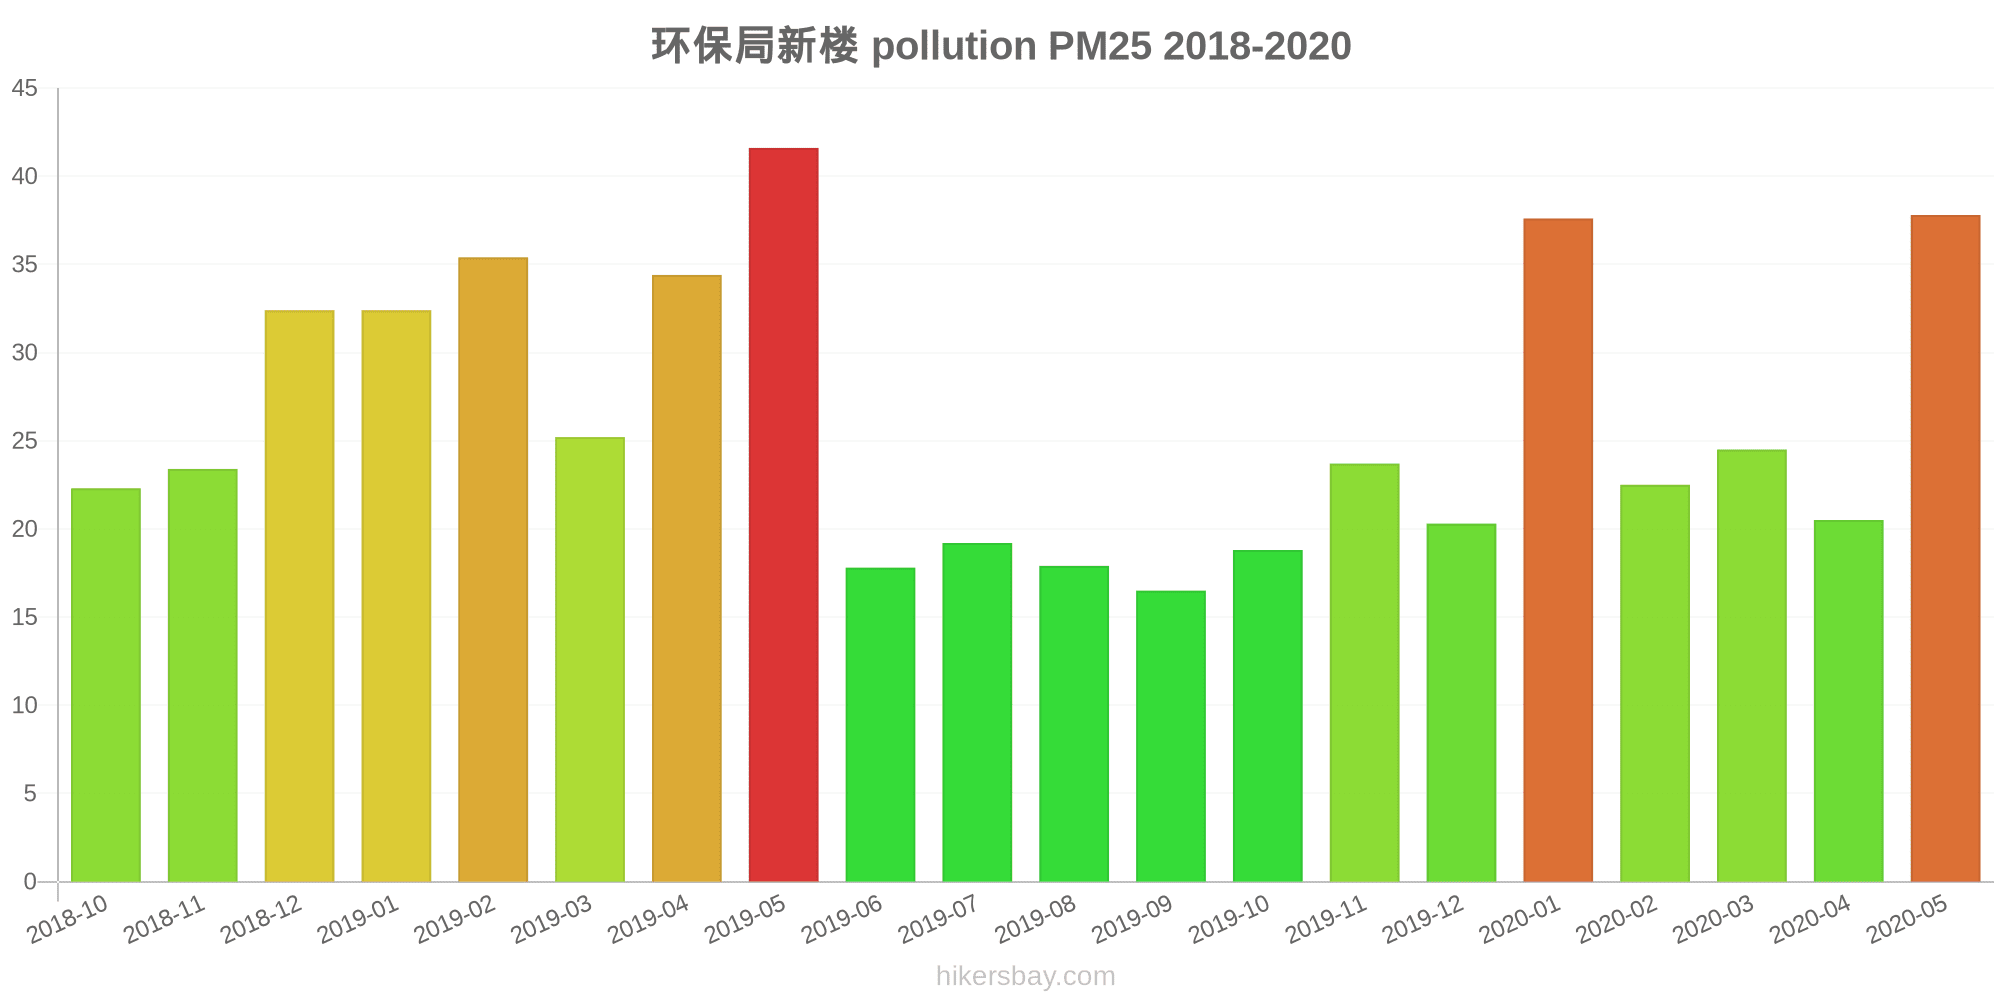
环保局新楼
Freitag, 27. Mai 2022, 12:00
PM10 6.7 (gut)
Feinstaub (PM10) Schwebestaub
PM2,5 1.7 (gut)
Feinstaub (PM2,5)
CO 100 (gut)
Kohlenmonoxid (CO)
NO2 7.6 (gut)
Stickstoffdioxid (NO2)
O3 0.02 (gut)
Ozon (O3)
SO2 8.6 (gut)
Schwefeldioxid (SO2)
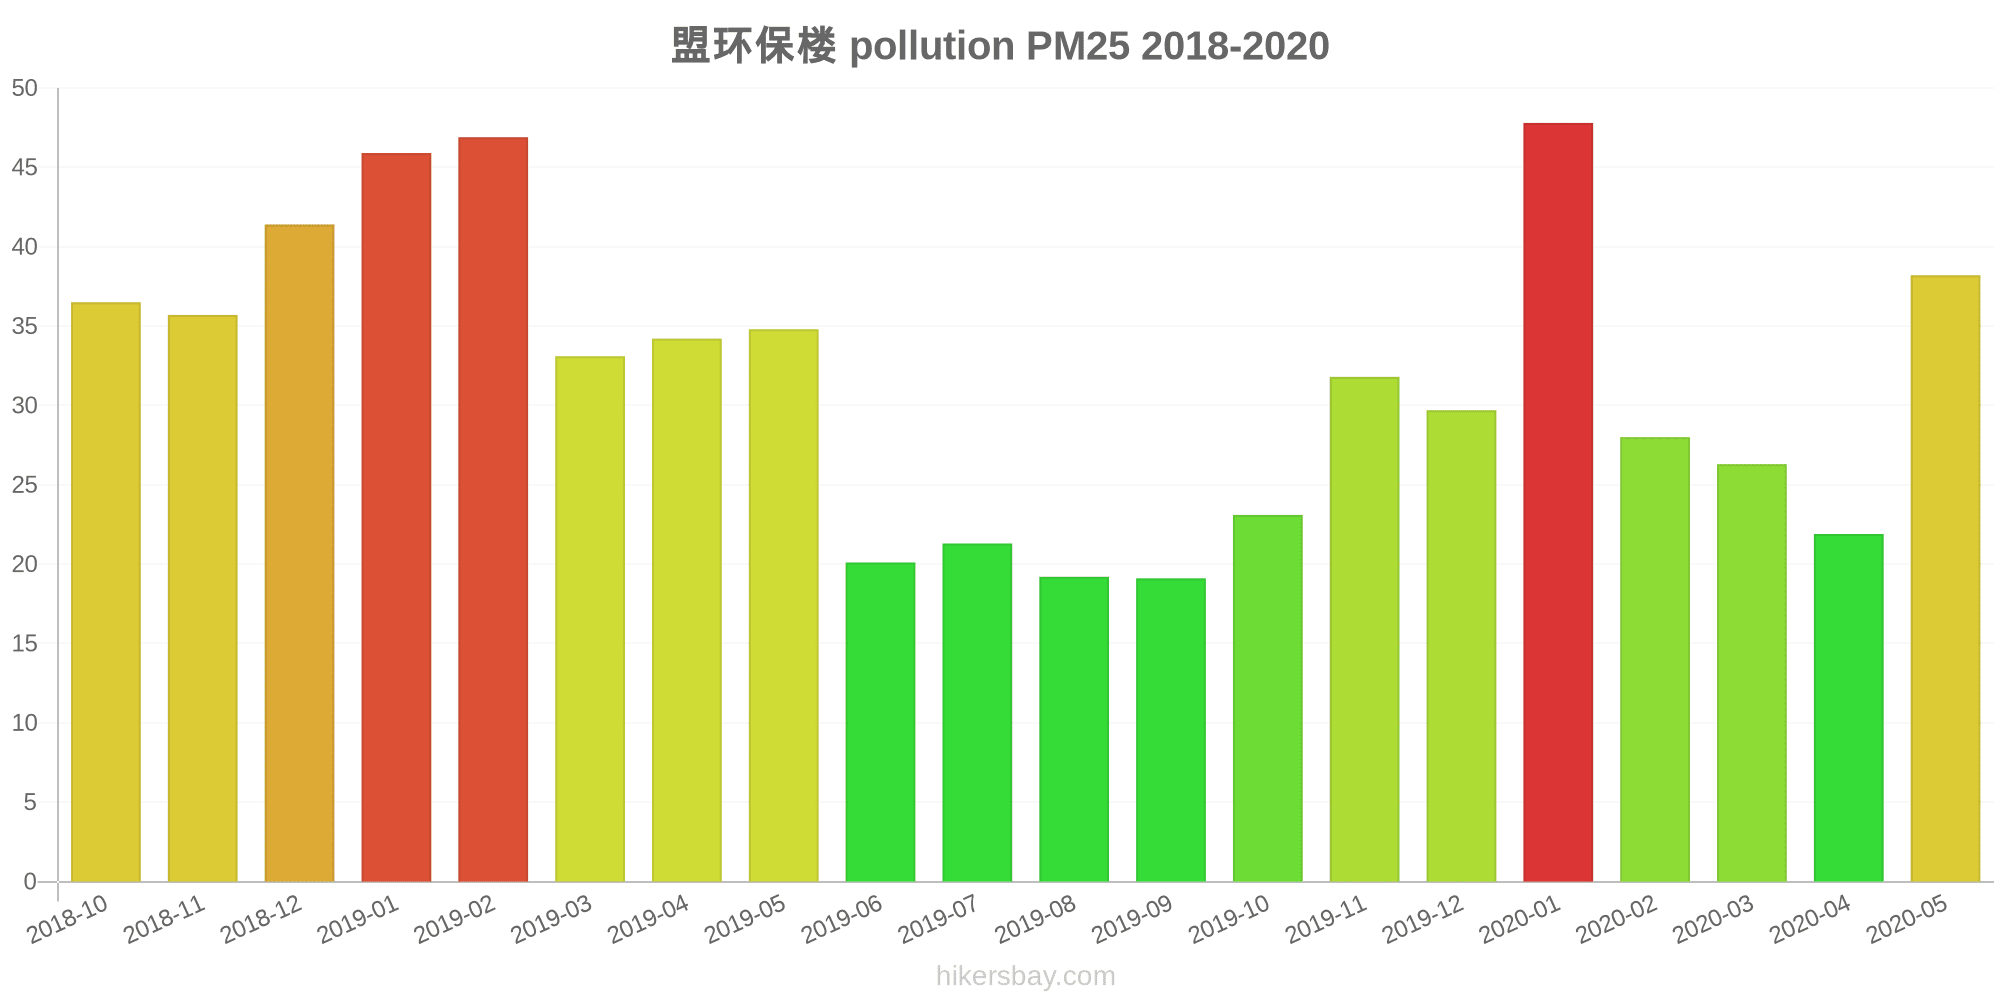
盟环保楼
Freitag, 27. Mai 2022, 12:00
PM10 6.7 (gut)
Feinstaub (PM10) Schwebestaub
PM2,5 1.7 (gut)
Feinstaub (PM2,5)
CO 100 (gut)
Kohlenmonoxid (CO)
NO2 7.6 (gut)
Stickstoffdioxid (NO2)
O3 0.02 (gut)
Ozon (O3)
SO2 8.6 (gut)
Schwefeldioxid (SO2)
体育场
index
2022-05-27
pm10
32
pm25
24
co
468
no2
21
o3
32
so2
4.6
环保局新楼
index
2022-05-27
pm10
32
pm25
24
co
468
no2
21
o3
32
so2
4.6
盟环保楼
index
2022-05-27
pm10
32
pm25
24
co
468
no2
21
o3
32
so2
4.6
体育场
2018-10 2020-05
index
2020-05
2020-04
2020-03
2020-02
2020-01
2019-12
2019-11
2019-10
2019-09
2019-08
2019-07
2019-06
2019-05
2019-04
2019-03
2019-02
2019-01
2018-12
2018-11
2018-10
pm25
32
21
24
23
45
23
26
19
16
16
20
17
31
29
25
36
32
33
32
32
co
628
500
338
376
541
580
323
249
293
402
455
458
408
473
498
552
601
435
411
458
no2
7
7.5
6.6
7
18
16
15
12
10
8.7
7.5
6.6
6.6
8.3
11
9.6
15
12
11
11
o3
131
124
96
85
82
82
92
99
138
146
152
139
141
137
122
104
92
84
98
113
pm10
144
60
88
73
64
45
66
49
31
40
51
36
115
102
73
91
53
88
83
55
so2
7.6
7.1
6.7
7.4
11
12
6.6
5.5
5.3
6.6
6.3
6.1
7
8.3
9.6
12
13
10
8.9
8.5
环保局新楼
2018-10 2020-05
index
2020-05
2020-04
2020-03
2020-02
2020-01
2019-12
2019-11
2019-10
2019-09
2019-08
2019-07
2019-06
2019-05
2019-04
2019-03
2019-02
2019-01
2018-12
2018-11
2018-10
pm25
38
21
25
23
38
20
24
19
17
18
19
18
42
34
25
35
32
32
23
22
co
555
438
376
378
470
327
328
281
339
439
510
556
377
493
474
585
542
576
410
444
no2
6
6.7
5.5
5.1
13
10
10
10
7.5
7.7
7.5
6
6.3
6.9
7.2
9
14
13
9.7
10
o3
129
127
108
97
94
89
97
101
139
147
154
141
144
135
124
107
91
84
94
102
pm10
134
49
78
63
52
35
52
40
25
31
42
33
111
100
62
78
51
85
79
50
so2
6.5
7.6
7
7.4
9.5
7.6
7.6
6.9
7
7.5
6.9
6.5
6.5
7.1
11
10
11
10
8.2
7.7
盟环保楼
2018-10 2020-05

index
2020-05
2020-04
2020-03
2020-02
2020-01
2019-12
2019-11
2019-10
2019-09
2019-08
2019-07
2019-06
2019-05
2019-04
2019-03
2019-02
2019-01
2018-12
2018-11
2018-10
pm25
38
22
26
28
48
30
32
23
19
19
21
20
35
34
33
47
46
41
36
37
co
589
459
421
411
628
585
471
385
349
424
499
555
444
548
550
779
727
877
720
682
no2
7.6
7.8
8
7.9
20
19
16
13
9.9
9.9
8.5
7.3
7.1
9
11
13
21
20
16
14
o3
124
126
103
94
92
83
89
98
135
143
147
136
140
132
116
99
86
79
96
104
pm10
143
52
81
72
62
42
57
41
25
32
41
37
110
95
64
87
67
102
86
61
so2
9
8.3
8.7
8.7
13
13
8.9
7.9
7.7
7.3
6.2
6.9
6.1
7.4
11
15
16
15
11
9.3
* Pollution data source:
https://openaq.org
(ChinaAQIData)
The data is licensed under CC-By 4.0
PM10 7 (gut)
PM2,5 2 (gut)
CO 100 (gut)
NO2 8 (gut)
O3 0 (gut)
SO2 9 (gut)
Daten zur Luftverschmutzung der letzten Tage in Bayan Hot
| index | 2022-05-27 |
|---|---|
| pm10 | 32 Moderate |
| pm25 | 24 Moderate |
| co | 468 Good |
| no2 | 21 Good |
| o3 | 32 Good |
| so2 | 5 Good |

| index | 2020-05 | 2020-04 | 2020-03 | 2020-02 | 2020-01 | 2019-12 | 2019-11 | 2019-10 | 2019-09 | 2019-08 | 2019-07 | 2019-06 | 2019-05 | 2019-04 | 2019-03 | 2019-02 | 2019-01 | 2018-12 | 2018-11 | 2018-10 |
|---|---|---|---|---|---|---|---|---|---|---|---|---|---|---|---|---|---|---|---|---|
| pm25 | 36 (Unhealthy for Sensitive Groups) | 21 (Moderate) | 25 (Moderate) | 25 (Moderate) | 44 (Unhealthy for Sensitive Groups) | 24 (Moderate) | 27 (Moderate) | 20 (Moderate) | 17 (Moderate) | 18 (Moderate) | 20 (Moderate) | 18 (Moderate) | 36 (Unhealthy for Sensitive Groups) | 33 (Moderate) | 28 (Moderate) | 39 (Unhealthy for Sensitive Groups) | 37 (Unhealthy for Sensitive Groups) | 36 (Unhealthy for Sensitive Groups) | 31 (Moderate) | 30 (Moderate) |
| co | 591 (Good) | 466 (Good) | 378 (Good) | 388 (Good) | 546 (Good) | 497 (Good) | 374 (Good) | 305 (Good) | 327 (Good) | 422 (Good) | 488 (Good) | 523 (Good) | 410 (Good) | 505 (Good) | 507 (Good) | 639 (Good) | 623 (Good) | 629 (Good) | 514 (Good) | 528 (Good) |
| no2 | 6.8 (Good) | 7.3 (Good) | 6.7 (Good) | 6.7 (Good) | 17 (Good) | 15 (Good) | 14 (Good) | 12 (Good) | 9.1 (Good) | 8.8 (Good) | 7.9 (Good) | 6.6 (Good) | 6.7 (Good) | 8.1 (Good) | 9.6 (Good) | 10 (Good) | 17 (Good) | 15 (Good) | 12 (Good) | 12 (Good) |
| o3 | 128 (Unhealthy for Sensitive Groups) | 126 (Unhealthy for Sensitive Groups) | 102 (Moderate) | 92 (Moderate) | 90 (Moderate) | 85 (Moderate) | 92 (Moderate) | 100 (Moderate) | 137 (Unhealthy for Sensitive Groups) | 145 (Unhealthy for Sensitive Groups) | 151 (Unhealthy) | 139 (Unhealthy for Sensitive Groups) | 142 (Unhealthy for Sensitive Groups) | 135 (Unhealthy for Sensitive Groups) | 121 (Unhealthy for Sensitive Groups) | 103 (Moderate) | 90 (Moderate) | 82 (Moderate) | 96 (Moderate) | 106 (Moderate) |
| pm10 | 140 (Very Unhealthy) | 54 (Unhealthy for Sensitive Groups) | 82 (Unhealthy) | 69 (Unhealthy for Sensitive Groups) | 59 (Unhealthy for Sensitive Groups) | 41 (Moderate) | 58 (Unhealthy for Sensitive Groups) | 43 (Moderate) | 27 (Moderate) | 34 (Moderate) | 44 (Moderate) | 35 (Moderate) | 112 (Very Unhealthy) | 99 (Unhealthy) | 66 (Unhealthy for Sensitive Groups) | 85 (Unhealthy) | 57 (Unhealthy for Sensitive Groups) | 92 (Unhealthy) | 83 (Unhealthy) | 55 (Unhealthy for Sensitive Groups) |
| so2 | 7.7 (Good) | 7.6 (Good) | 7.4 (Good) | 7.8 (Good) | 11 (Good) | 11 (Good) | 7.7 (Good) | 6.7 (Good) | 6.7 (Good) | 7.1 (Good) | 6.4 (Good) | 6.5 (Good) | 6.5 (Good) | 7.6 (Good) | 10 (Good) | 12 (Good) | 13 (Good) | 12 (Good) | 9.5 (Good) | 8.5 (Good) |
PM10 6.7 (gut)
Feinstaub (PM10) SchwebestaubPM2,5 1.7 (gut)
Feinstaub (PM2,5)CO 100 (gut)
Kohlenmonoxid (CO)NO2 7.6 (gut)
Stickstoffdioxid (NO2)O3 0.02 (gut)
Ozon (O3)SO2 8.6 (gut)
Schwefeldioxid (SO2)PM10 6.7 (gut)
Feinstaub (PM10) SchwebestaubPM2,5 1.7 (gut)
Feinstaub (PM2,5)CO 100 (gut)
Kohlenmonoxid (CO)NO2 7.6 (gut)
Stickstoffdioxid (NO2)O3 0.02 (gut)
Ozon (O3)SO2 8.6 (gut)
Schwefeldioxid (SO2)PM10 6.7 (gut)
Feinstaub (PM10) SchwebestaubPM2,5 1.7 (gut)
Feinstaub (PM2,5)CO 100 (gut)
Kohlenmonoxid (CO)NO2 7.6 (gut)
Stickstoffdioxid (NO2)O3 0.02 (gut)
Ozon (O3)SO2 8.6 (gut)
Schwefeldioxid (SO2)体育场
| index | 2022-05-27 |
|---|---|
| pm10 | 32 |
| pm25 | 24 |
| co | 468 |
| no2 | 21 |
| o3 | 32 |
| so2 | 4.6 |
环保局新楼
| index | 2022-05-27 |
|---|---|
| pm10 | 32 |
| pm25 | 24 |
| co | 468 |
| no2 | 21 |
| o3 | 32 |
| so2 | 4.6 |
盟环保楼
| index | 2022-05-27 |
|---|---|
| pm10 | 32 |
| pm25 | 24 |
| co | 468 |
| no2 | 21 |
| o3 | 32 |
| so2 | 4.6 |
体育场
| index | 2020-05 | 2020-04 | 2020-03 | 2020-02 | 2020-01 | 2019-12 | 2019-11 | 2019-10 | 2019-09 | 2019-08 | 2019-07 | 2019-06 | 2019-05 | 2019-04 | 2019-03 | 2019-02 | 2019-01 | 2018-12 | 2018-11 | 2018-10 |
|---|---|---|---|---|---|---|---|---|---|---|---|---|---|---|---|---|---|---|---|---|
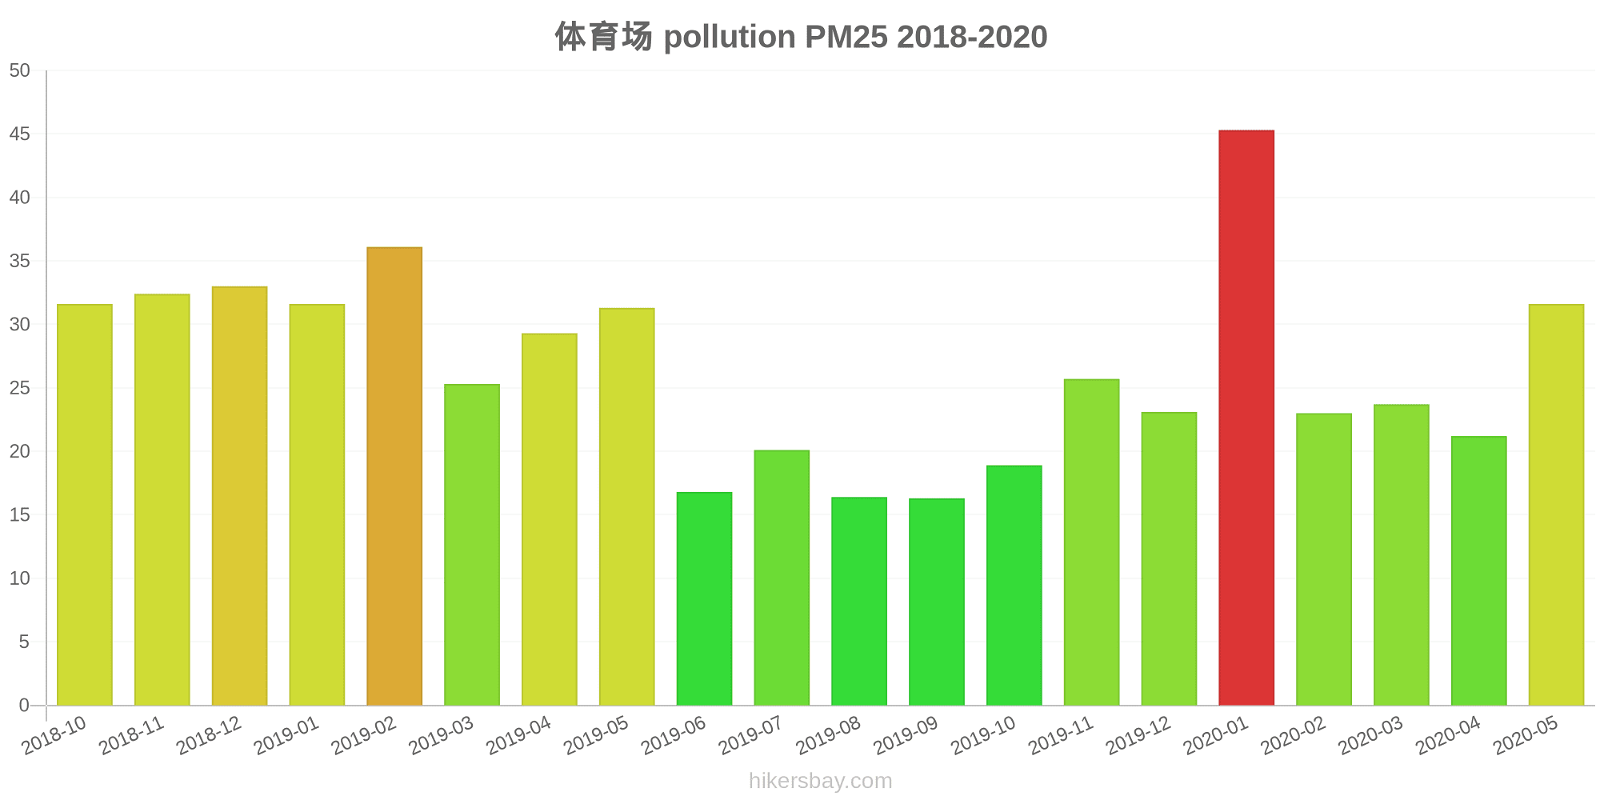
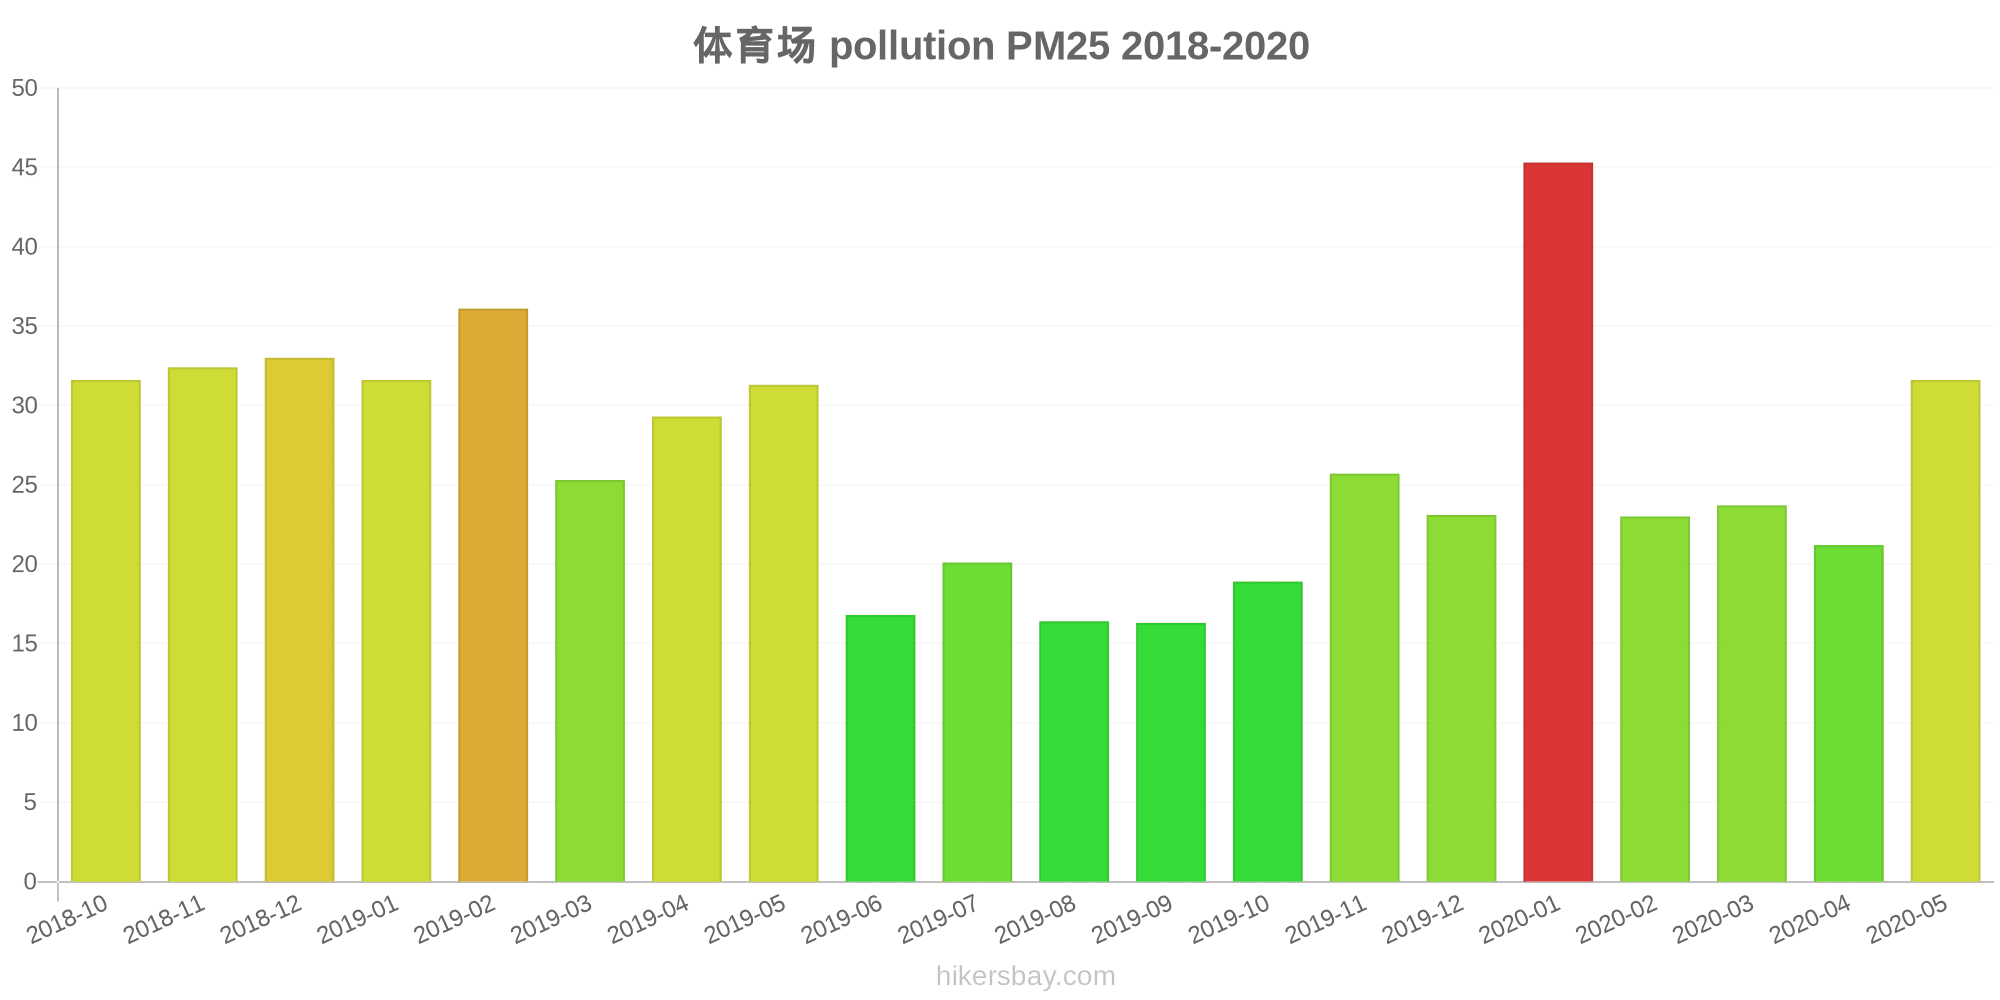
| pm25 | 32 | 21 | 24 | 23 | 45 | 23 | 26 | 19 | 16 | 16 | 20 | 17 | 31 | 29 | 25 | 36 | 32 | 33 | 32 | 32 |
| co | 628 | 500 | 338 | 376 | 541 | 580 | 323 | 249 | 293 | 402 | 455 | 458 | 408 | 473 | 498 | 552 | 601 | 435 | 411 | 458 |
| no2 | 7 | 7.5 | 6.6 | 7 | 18 | 16 | 15 | 12 | 10 | 8.7 | 7.5 | 6.6 | 6.6 | 8.3 | 11 | 9.6 | 15 | 12 | 11 | 11 |
| o3 | 131 | 124 | 96 | 85 | 82 | 82 | 92 | 99 | 138 | 146 | 152 | 139 | 141 | 137 | 122 | 104 | 92 | 84 | 98 | 113 |
| pm10 | 144 | 60 | 88 | 73 | 64 | 45 | 66 | 49 | 31 | 40 | 51 | 36 | 115 | 102 | 73 | 91 | 53 | 88 | 83 | 55 |
| so2 | 7.6 | 7.1 | 6.7 | 7.4 | 11 | 12 | 6.6 | 5.5 | 5.3 | 6.6 | 6.3 | 6.1 | 7 | 8.3 | 9.6 | 12 | 13 | 10 | 8.9 | 8.5 |
环保局新楼
| index | 2020-05 | 2020-04 | 2020-03 | 2020-02 | 2020-01 | 2019-12 | 2019-11 | 2019-10 | 2019-09 | 2019-08 | 2019-07 | 2019-06 | 2019-05 | 2019-04 | 2019-03 | 2019-02 | 2019-01 | 2018-12 | 2018-11 | 2018-10 |
|---|---|---|---|---|---|---|---|---|---|---|---|---|---|---|---|---|---|---|---|---|
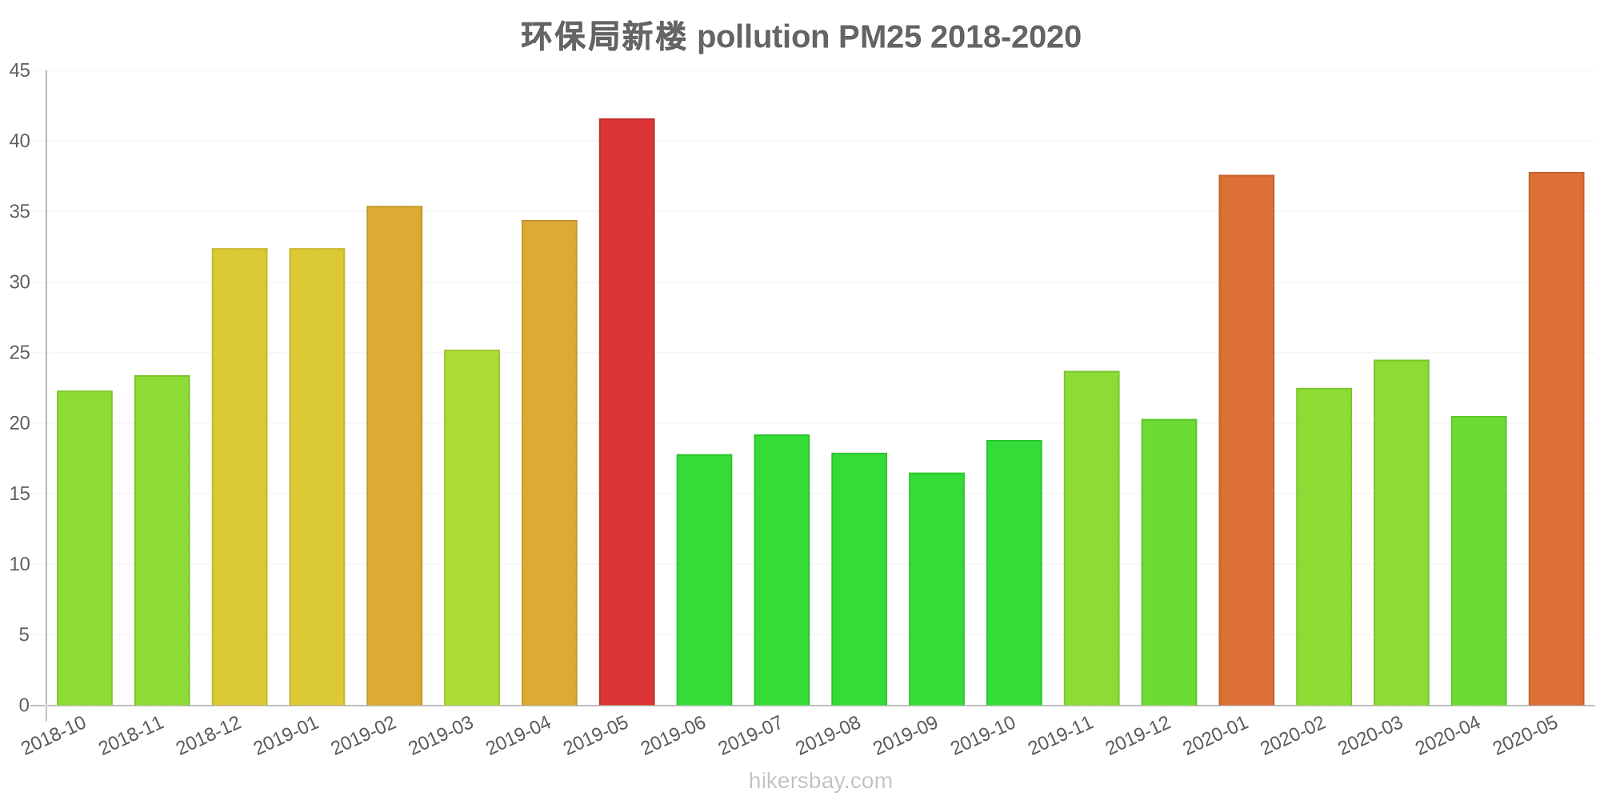
| pm25 | 38 | 21 | 25 | 23 | 38 | 20 | 24 | 19 | 17 | 18 | 19 | 18 | 42 | 34 | 25 | 35 | 32 | 32 | 23 | 22 |
| co | 555 | 438 | 376 | 378 | 470 | 327 | 328 | 281 | 339 | 439 | 510 | 556 | 377 | 493 | 474 | 585 | 542 | 576 | 410 | 444 |
| no2 | 6 | 6.7 | 5.5 | 5.1 | 13 | 10 | 10 | 10 | 7.5 | 7.7 | 7.5 | 6 | 6.3 | 6.9 | 7.2 | 9 | 14 | 13 | 9.7 | 10 |
| o3 | 129 | 127 | 108 | 97 | 94 | 89 | 97 | 101 | 139 | 147 | 154 | 141 | 144 | 135 | 124 | 107 | 91 | 84 | 94 | 102 |
| pm10 | 134 | 49 | 78 | 63 | 52 | 35 | 52 | 40 | 25 | 31 | 42 | 33 | 111 | 100 | 62 | 78 | 51 | 85 | 79 | 50 |
| so2 | 6.5 | 7.6 | 7 | 7.4 | 9.5 | 7.6 | 7.6 | 6.9 | 7 | 7.5 | 6.9 | 6.5 | 6.5 | 7.1 | 11 | 10 | 11 | 10 | 8.2 | 7.7 |
盟环保楼
| index | 2020-05 | 2020-04 | 2020-03 | 2020-02 | 2020-01 | 2019-12 | 2019-11 | 2019-10 | 2019-09 | 2019-08 | 2019-07 | 2019-06 | 2019-05 | 2019-04 | 2019-03 | 2019-02 | 2019-01 | 2018-12 | 2018-11 | 2018-10 |
|---|---|---|---|---|---|---|---|---|---|---|---|---|---|---|---|---|---|---|---|---|
| pm25 | 38 | 22 | 26 | 28 | 48 | 30 | 32 | 23 | 19 | 19 | 21 | 20 | 35 | 34 | 33 | 47 | 46 | 41 | 36 | 37 |
| co | 589 | 459 | 421 | 411 | 628 | 585 | 471 | 385 | 349 | 424 | 499 | 555 | 444 | 548 | 550 | 779 | 727 | 877 | 720 | 682 |
| no2 | 7.6 | 7.8 | 8 | 7.9 | 20 | 19 | 16 | 13 | 9.9 | 9.9 | 8.5 | 7.3 | 7.1 | 9 | 11 | 13 | 21 | 20 | 16 | 14 |
| o3 | 124 | 126 | 103 | 94 | 92 | 83 | 89 | 98 | 135 | 143 | 147 | 136 | 140 | 132 | 116 | 99 | 86 | 79 | 96 | 104 |
| pm10 | 143 | 52 | 81 | 72 | 62 | 42 | 57 | 41 | 25 | 32 | 41 | 37 | 110 | 95 | 64 | 87 | 67 | 102 | 86 | 61 |
| so2 | 9 | 8.3 | 8.7 | 8.7 | 13 | 13 | 8.9 | 7.9 | 7.7 | 7.3 | 6.2 | 6.9 | 6.1 | 7.4 | 11 | 15 | 16 | 15 | 11 | 9.3 |