Luftverschmutzung in Wujiacun: Echtzeit-Luft-Qualitätsindex und Smog-Alarm.
Für die Wujiacun. Heute ist Donnerstag, 4. Juni 2026. Für Wujiacun wurden folgende Luftverschmutzungswerte gemessen:- Feinstaub (PM10) Schwebestaub - 53 (Ungesund für sensible Gruppen)
- Ozon (O3) - 0 (gut)
- Feinstaub (PM2,5) - 7 (gut)
- Schwefeldioxid (SO2) - 18 (gut)
- Stickstoffdioxid (NO2) - 3 (gut)
- Kohlenmonoxid (CO) - 1 (gut)

Wie ist die Luftqualität Wujiacun heute? Ist die Luft in Wujiacun? verschmutzt. Gibt es Smog?
Wie hoch ist der PM10-Stand heute in Wujiacun? (Feinstaub (PM10) Schwebestaub)
Der aktuelle Feinstaubgehalt PM10 in Wujiacun is:
53 (Ungesund für sensible Gruppen)
Die höchsten PM10-Werte treten in der Regel im Monat auf: 142 (Januar 2019).
Der niedrigste Wert der Feinstaub-PM10-Belastung in Wujiacun ist in der Regel in: August (37).
Wie ist das O3-Niveau heute in Wujiacun? (Ozon (O3))
0 (gut)
Wie hoch ist der aktuelle PM2,5-Wert in Wujiacun? (Feinstaub (PM2,5))
Die heutige PM2.5-Stufe ist:
7 (gut)
Zum Vergleich: Der höchste PM2,5-Wert in Wujiacun in den letzten 7 Tagen war: 21 (Freitag, 27. Mai 2022) und der niedrigste: 21 (Freitag, 27. Mai 2022).
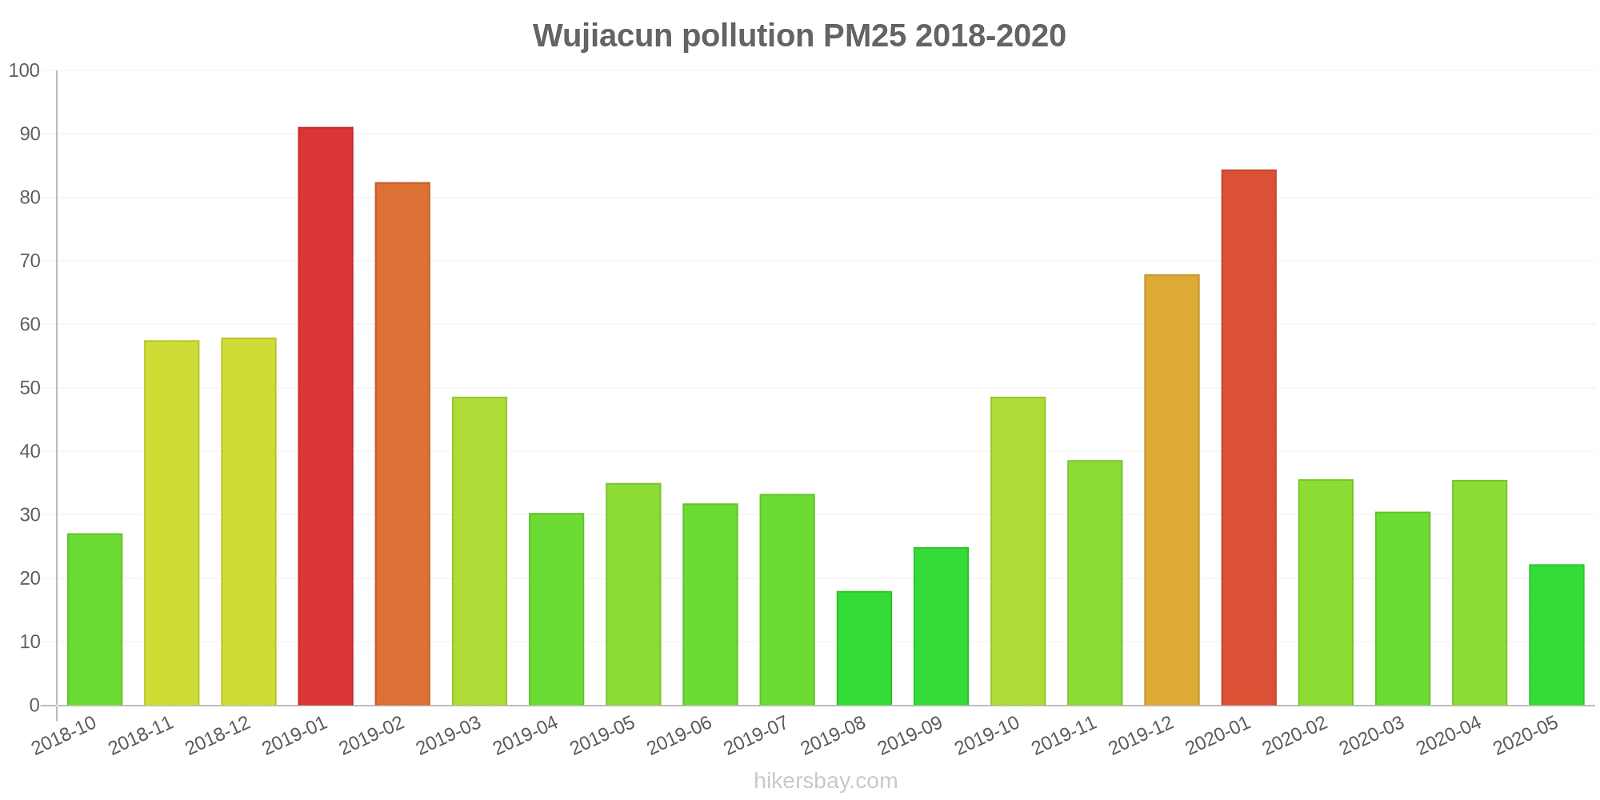
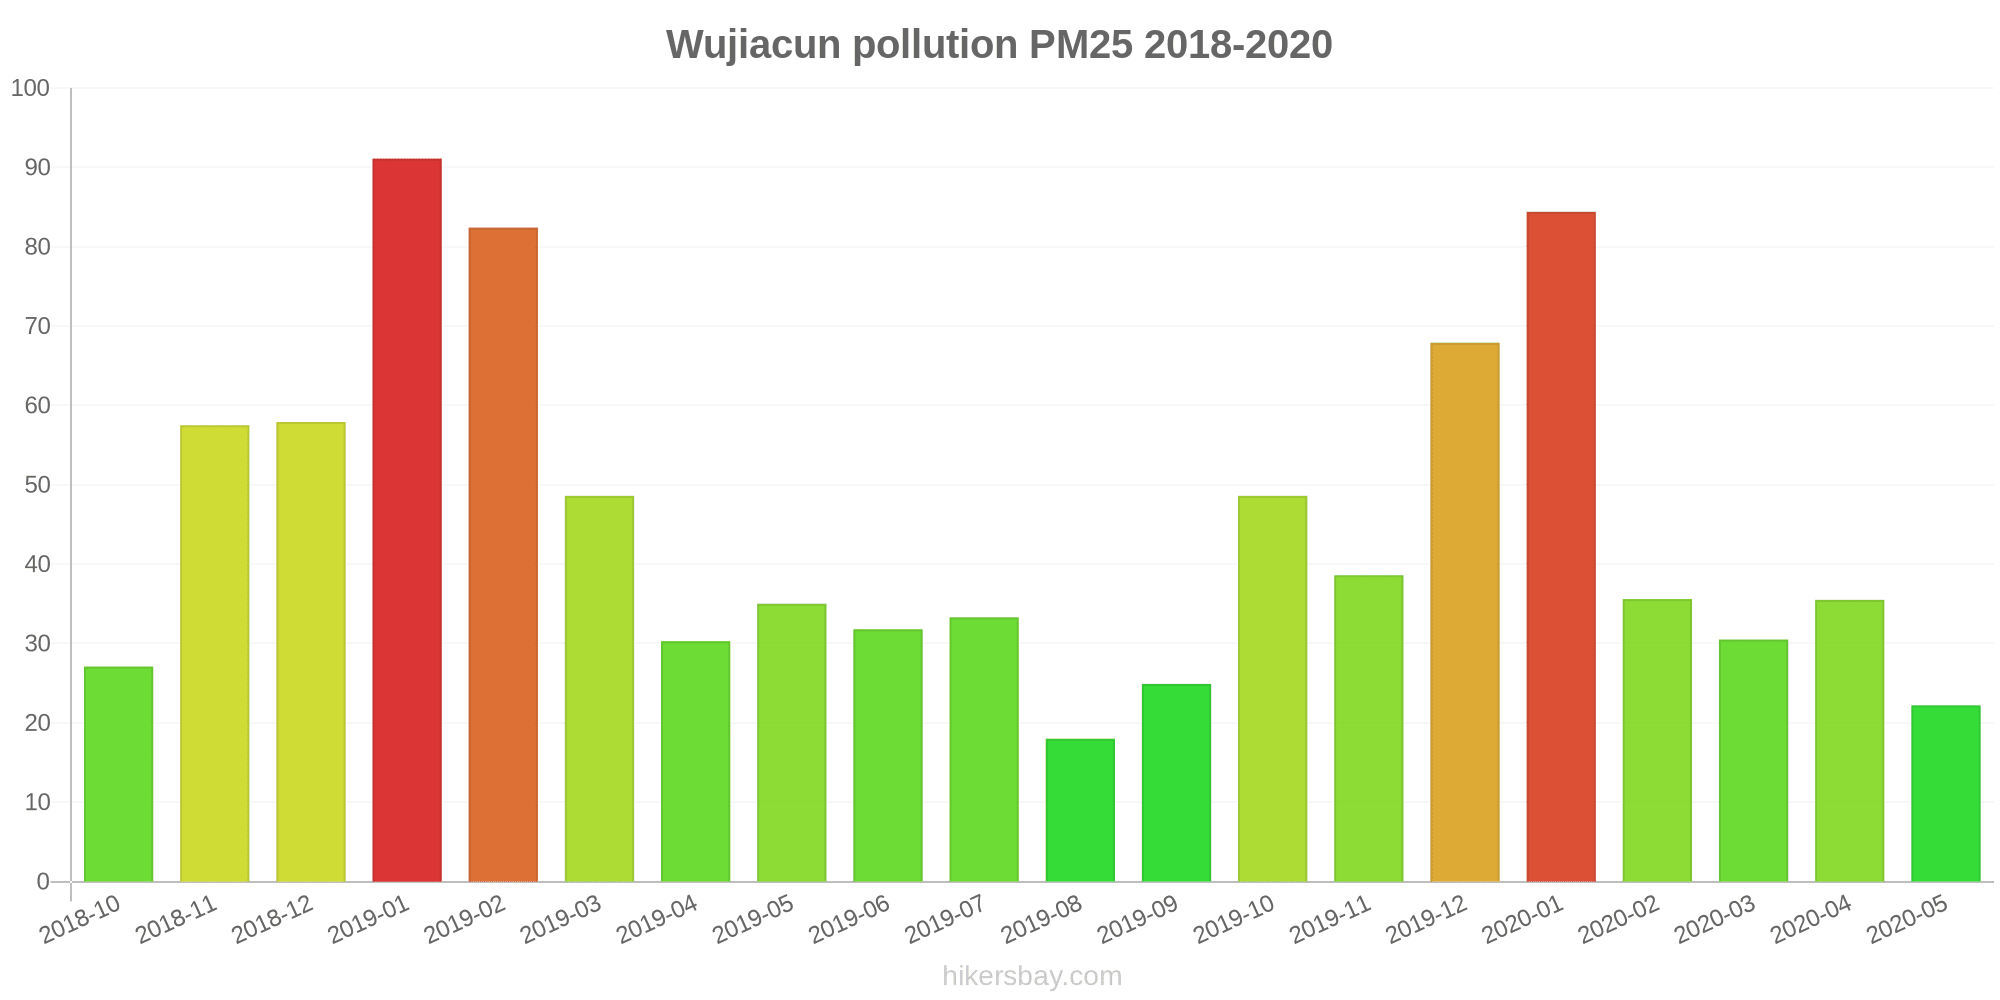
Die höchsten PM2,5-Werte wurden gemessen: 91 (Januar 2019).
Die niedrigste Feinstaubbelastung PM2,5 tritt im Monat auf: August (18).
Wie hoch ist die SO2-Belastung? (Schwefeldioxid (SO2))
18 (gut)
Wie hoch ist das NO2-Niveau? (Stickstoffdioxid (NO2))
3 (gut)
Wie hoch ist der CO-Gehalt? (Kohlenmonoxid (CO))
1 (gut)
Aktuelle Daten Freitag, 27. Mai 2022, 12:00
PM10 53 (Ungesund für sensible Gruppen)
O3 0 (gut)
PM2,5 7 (gut)
SO2 18 (gut)
NO2 3 (gut)
CO 1 (gut)
Daten zur Luftverschmutzung der letzten Tage in Wujiacun
index
2022-05-27
pm10
51
Unhealthy for Sensitive Groups
o3
0
Good
pm25
21
Moderate
so2
10
Good
no2
0
Good
co
1
Good
data source »
Luftverschmutzung in Wujiacun von Oktober 2018 bis Mai 2020
index
2020-05
2020-04
2020-03
2020-02
2020-01
2019-12
2019-11
2019-10
2019-09
2019-08
2019-07
2019-06
2019-05
2019-04
2019-03
2019-02
2019-01
2018-12
2018-11
2018-10
pm25
22 (Moderate)
36 (Unhealthy for Sensitive Groups)
31 (Moderate)
36 (Unhealthy for Sensitive Groups)
84 (Very Unhealthy)
68 (Unhealthy)
39 (Unhealthy for Sensitive Groups)
49 (Unhealthy for Sensitive Groups)
25 (Moderate)
18 (Moderate)
33 (Moderate)
32 (Moderate)
35 (Unhealthy for Sensitive Groups)
30 (Moderate)
49 (Unhealthy for Sensitive Groups)
82 (Very Unhealthy)
91 (Very Unhealthy)
58 (Unhealthy)
58 (Unhealthy)
27 (Moderate)
co
566 (Good)
525 (Good)
557 (Good)
617 (Good)
974 (Good)
880 (Good)
647 (Good)
707 (Good)
625 (Good)
446 (Good)
498 (Good)
533 (Good)
512 (Good)
451 (Good)
620 (Good)
991 (Good)
1 (Good)
876 (Good)
751 (Good)
508 (Good)
no2
24 (Good)
34 (Good)
28 (Good)
22 (Good)
42 (Moderate)
52 (Moderate)
45 (Moderate)
52 (Moderate)
34 (Good)
19 (Good)
18 (Good)
17 (Good)
39 (Good)
37 (Good)
46 (Moderate)
50 (Moderate)
64 (Moderate)
50 (Moderate)
50 (Moderate)
46 (Moderate)
o3
123 (Unhealthy for Sensitive Groups)
128 (Unhealthy for Sensitive Groups)
106 (Moderate)
89 (Moderate)
73 (Moderate)
64 (Good)
85 (Moderate)
123 (Unhealthy for Sensitive Groups)
150 (Unhealthy)
119 (Moderate)
143 (Unhealthy for Sensitive Groups)
155 (Unhealthy)
160 (Unhealthy)
121 (Unhealthy for Sensitive Groups)
112 (Moderate)
86 (Moderate)
58 (Good)
54 (Good)
88 (Moderate)
107 (Moderate)
pm10
54 (Unhealthy for Sensitive Groups)
78 (Unhealthy for Sensitive Groups)
68 (Unhealthy for Sensitive Groups)
50 (Unhealthy for Sensitive Groups)
109 (Unhealthy)
99 (Unhealthy)
88 (Unhealthy)
109 (Unhealthy)
58 (Unhealthy for Sensitive Groups)
37 (Moderate)
53 (Unhealthy for Sensitive Groups)
52 (Unhealthy for Sensitive Groups)
73 (Unhealthy for Sensitive Groups)
71 (Unhealthy for Sensitive Groups)
93 (Unhealthy)
121 (Very Unhealthy)
142 (Very Unhealthy)
109 (Unhealthy)
115 (Very Unhealthy)
70 (Unhealthy for Sensitive Groups)
so2
5.4 (Good)
7.7 (Good)
7.2 (Good)
7.2 (Good)
14 (Good)
12 (Good)
8.8 (Good)
7.7 (Good)
5.8 (Good)
5.7 (Good)
4.8 (Good)
4.2 (Good)
7.6 (Good)
5.4 (Good)
8.6 (Good)
12 (Good)
18 (Good)
13 (Good)
8.8 (Good)
6.4 (Good)
data source »
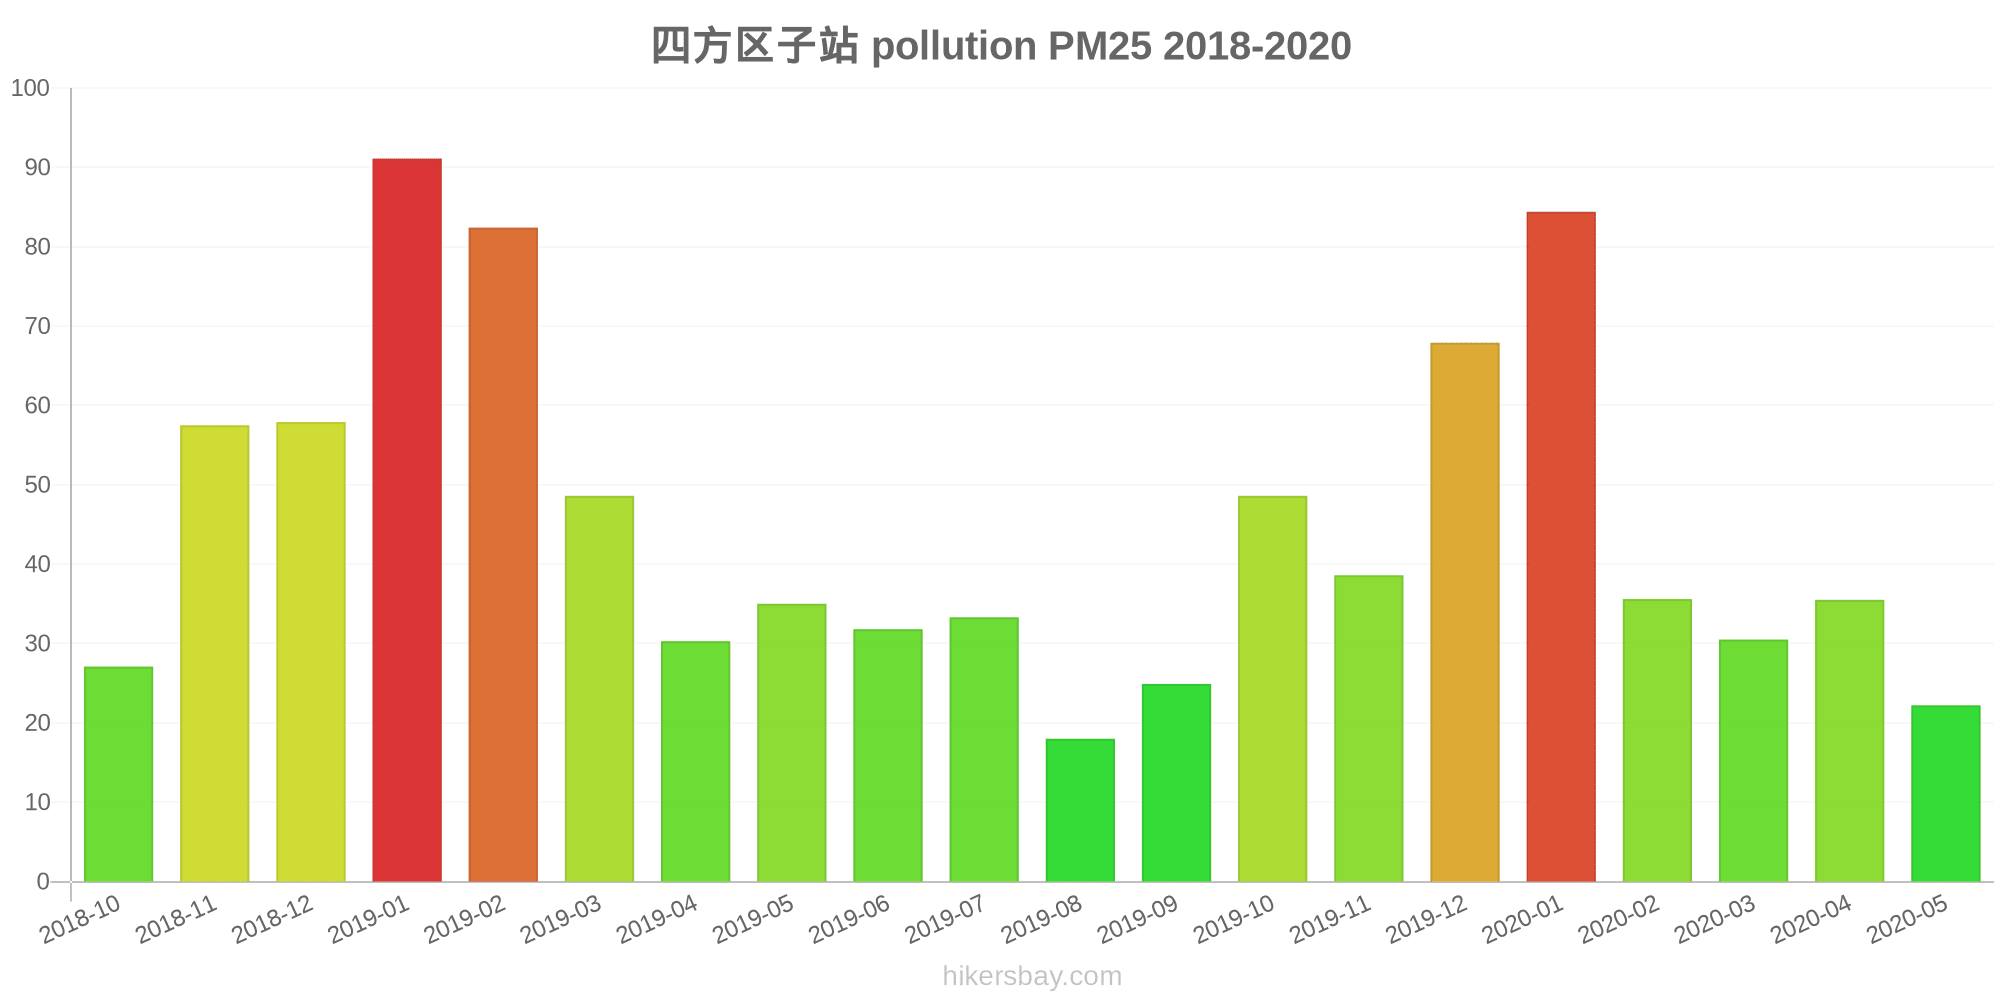
四方区子站
Freitag, 27. Mai 2022, 12:00
PM10 53 (Ungesund für sensible Gruppen)
Feinstaub (PM10) Schwebestaub
O3 0.02 (gut)
Ozon (O3)
PM2,5 6.6 (gut)
Feinstaub (PM2,5)
SO2 18 (gut)
Schwefeldioxid (SO2)
NO2 3 (gut)
Stickstoffdioxid (NO2)
CO 1.3 (gut)
Kohlenmonoxid (CO)
四方区子站
index
2022-05-27
pm10
51
o3
0.02
pm25
21
so2
9.6
no2
0.38
co
0.64
四方区子站
2018-10 2020-05

index
2020-05
2020-04
2020-03
2020-02
2020-01
2019-12
2019-11
2019-10
2019-09
2019-08
2019-07
2019-06
2019-05
2019-04
2019-03
2019-02
2019-01
2018-12
2018-11
2018-10
pm25
22
36
31
36
84
68
39
49
25
18
33
32
35
30
49
82
91
58
58
27
co
566
525
557
617
974
880
647
707
625
446
498
533
512
451
620
991
1
876
751
508
no2
24
34
28
22
42
52
45
52
34
19
18
17
39
37
46
50
64
50
50
46
o3
123
128
106
89
73
64
85
123
150
119
143
155
160
121
112
86
58
54
88
107
pm10
54
78
68
50
109
99
88
109
58
37
53
52
73
71
93
121
142
109
115
70
so2
5.4
7.7
7.2
7.2
14
12
8.8
7.7
5.8
5.7
4.8
4.2
7.6
5.4
8.6
12
18
13
8.8
6.4
* Pollution data source:
https://openaq.org
(ChinaAQIData)
The data is licensed under CC-By 4.0
PM10 53 (Ungesund für sensible Gruppen)
O3 0 (gut)
PM2,5 7 (gut)
SO2 18 (gut)
NO2 3 (gut)
CO 1 (gut)
Daten zur Luftverschmutzung der letzten Tage in Wujiacun
| index | 2022-05-27 |
|---|---|
| pm10 | 51 Unhealthy for Sensitive Groups |
| o3 | 0 Good |
| pm25 | 21 Moderate |
| so2 | 10 Good |
| no2 | 0 Good |
| co | 1 Good |
| index | 2020-05 | 2020-04 | 2020-03 | 2020-02 | 2020-01 | 2019-12 | 2019-11 | 2019-10 | 2019-09 | 2019-08 | 2019-07 | 2019-06 | 2019-05 | 2019-04 | 2019-03 | 2019-02 | 2019-01 | 2018-12 | 2018-11 | 2018-10 |
|---|---|---|---|---|---|---|---|---|---|---|---|---|---|---|---|---|---|---|---|---|
| pm25 | 22 (Moderate) | 36 (Unhealthy for Sensitive Groups) | 31 (Moderate) | 36 (Unhealthy for Sensitive Groups) | 84 (Very Unhealthy) | 68 (Unhealthy) | 39 (Unhealthy for Sensitive Groups) | 49 (Unhealthy for Sensitive Groups) | 25 (Moderate) | 18 (Moderate) | 33 (Moderate) | 32 (Moderate) | 35 (Unhealthy for Sensitive Groups) | 30 (Moderate) | 49 (Unhealthy for Sensitive Groups) | 82 (Very Unhealthy) | 91 (Very Unhealthy) | 58 (Unhealthy) | 58 (Unhealthy) | 27 (Moderate) |
| co | 566 (Good) | 525 (Good) | 557 (Good) | 617 (Good) | 974 (Good) | 880 (Good) | 647 (Good) | 707 (Good) | 625 (Good) | 446 (Good) | 498 (Good) | 533 (Good) | 512 (Good) | 451 (Good) | 620 (Good) | 991 (Good) | 1 (Good) | 876 (Good) | 751 (Good) | 508 (Good) |
| no2 | 24 (Good) | 34 (Good) | 28 (Good) | 22 (Good) | 42 (Moderate) | 52 (Moderate) | 45 (Moderate) | 52 (Moderate) | 34 (Good) | 19 (Good) | 18 (Good) | 17 (Good) | 39 (Good) | 37 (Good) | 46 (Moderate) | 50 (Moderate) | 64 (Moderate) | 50 (Moderate) | 50 (Moderate) | 46 (Moderate) |
| o3 | 123 (Unhealthy for Sensitive Groups) | 128 (Unhealthy for Sensitive Groups) | 106 (Moderate) | 89 (Moderate) | 73 (Moderate) | 64 (Good) | 85 (Moderate) | 123 (Unhealthy for Sensitive Groups) | 150 (Unhealthy) | 119 (Moderate) | 143 (Unhealthy for Sensitive Groups) | 155 (Unhealthy) | 160 (Unhealthy) | 121 (Unhealthy for Sensitive Groups) | 112 (Moderate) | 86 (Moderate) | 58 (Good) | 54 (Good) | 88 (Moderate) | 107 (Moderate) |
| pm10 | 54 (Unhealthy for Sensitive Groups) | 78 (Unhealthy for Sensitive Groups) | 68 (Unhealthy for Sensitive Groups) | 50 (Unhealthy for Sensitive Groups) | 109 (Unhealthy) | 99 (Unhealthy) | 88 (Unhealthy) | 109 (Unhealthy) | 58 (Unhealthy for Sensitive Groups) | 37 (Moderate) | 53 (Unhealthy for Sensitive Groups) | 52 (Unhealthy for Sensitive Groups) | 73 (Unhealthy for Sensitive Groups) | 71 (Unhealthy for Sensitive Groups) | 93 (Unhealthy) | 121 (Very Unhealthy) | 142 (Very Unhealthy) | 109 (Unhealthy) | 115 (Very Unhealthy) | 70 (Unhealthy for Sensitive Groups) |
| so2 | 5.4 (Good) | 7.7 (Good) | 7.2 (Good) | 7.2 (Good) | 14 (Good) | 12 (Good) | 8.8 (Good) | 7.7 (Good) | 5.8 (Good) | 5.7 (Good) | 4.8 (Good) | 4.2 (Good) | 7.6 (Good) | 5.4 (Good) | 8.6 (Good) | 12 (Good) | 18 (Good) | 13 (Good) | 8.8 (Good) | 6.4 (Good) |
PM10 53 (Ungesund für sensible Gruppen)
Feinstaub (PM10) SchwebestaubO3 0.02 (gut)
Ozon (O3)PM2,5 6.6 (gut)
Feinstaub (PM2,5)SO2 18 (gut)
Schwefeldioxid (SO2)NO2 3 (gut)
Stickstoffdioxid (NO2)CO 1.3 (gut)
Kohlenmonoxid (CO)四方区子站
| index | 2022-05-27 |
|---|---|
| pm10 | 51 |
| o3 | 0.02 |
| pm25 | 21 |
| so2 | 9.6 |
| no2 | 0.38 |
| co | 0.64 |
四方区子站
| index | 2020-05 | 2020-04 | 2020-03 | 2020-02 | 2020-01 | 2019-12 | 2019-11 | 2019-10 | 2019-09 | 2019-08 | 2019-07 | 2019-06 | 2019-05 | 2019-04 | 2019-03 | 2019-02 | 2019-01 | 2018-12 | 2018-11 | 2018-10 |
|---|---|---|---|---|---|---|---|---|---|---|---|---|---|---|---|---|---|---|---|---|
| pm25 | 22 | 36 | 31 | 36 | 84 | 68 | 39 | 49 | 25 | 18 | 33 | 32 | 35 | 30 | 49 | 82 | 91 | 58 | 58 | 27 |
| co | 566 | 525 | 557 | 617 | 974 | 880 | 647 | 707 | 625 | 446 | 498 | 533 | 512 | 451 | 620 | 991 | 1 | 876 | 751 | 508 |
| no2 | 24 | 34 | 28 | 22 | 42 | 52 | 45 | 52 | 34 | 19 | 18 | 17 | 39 | 37 | 46 | 50 | 64 | 50 | 50 | 46 |
| o3 | 123 | 128 | 106 | 89 | 73 | 64 | 85 | 123 | 150 | 119 | 143 | 155 | 160 | 121 | 112 | 86 | 58 | 54 | 88 | 107 |
| pm10 | 54 | 78 | 68 | 50 | 109 | 99 | 88 | 109 | 58 | 37 | 53 | 52 | 73 | 71 | 93 | 121 | 142 | 109 | 115 | 70 |
| so2 | 5.4 | 7.7 | 7.2 | 7.2 | 14 | 12 | 8.8 | 7.7 | 5.8 | 5.7 | 4.8 | 4.2 | 7.6 | 5.4 | 8.6 | 12 | 18 | 13 | 8.8 | 6.4 |