Luftverschmutzung in Liaobin: Echtzeit-Luft-Qualitätsindex und Smog-Alarm.
Für die Liaobin. Heute ist Donnerstag, 4. Juni 2026. Für Liaobin wurden folgende Luftverschmutzungswerte gemessen:- Feinstaub (PM10) Schwebestaub - 7 (gut)
- Feinstaub (PM2,5) - 2 (gut)
- Kohlenmonoxid (CO) - 100 (gut)
- Stickstoffdioxid (NO2) - 8 (gut)
- Ozon (O3) - 0 (gut)
- Schwefeldioxid (SO2) - 9 (gut)

Wie ist die Luftqualität Liaobin heute? Ist die Luft in Liaobin? verschmutzt. Gibt es Smog?
Wie hoch ist der PM10-Stand heute in Liaobin? (Feinstaub (PM10) Schwebestaub)
Der aktuelle Feinstaubgehalt PM10 in Liaobin is:
7 (gut)
Die höchsten PM10-Werte treten in der Regel im Monat auf: 120 (Januar 2020).
Der niedrigste Wert der Feinstaub-PM10-Belastung in Liaobin ist in der Regel in: August (24).
Wie hoch ist der aktuelle PM2,5-Wert in Liaobin? (Feinstaub (PM2,5))
Die heutige PM2.5-Stufe ist:
2 (gut)
Zum Vergleich: Der höchste PM2,5-Wert in Liaobin in den letzten 7 Tagen war: 24 (Freitag, 27. Mai 2022) und der niedrigste: 24 (Freitag, 27. Mai 2022).
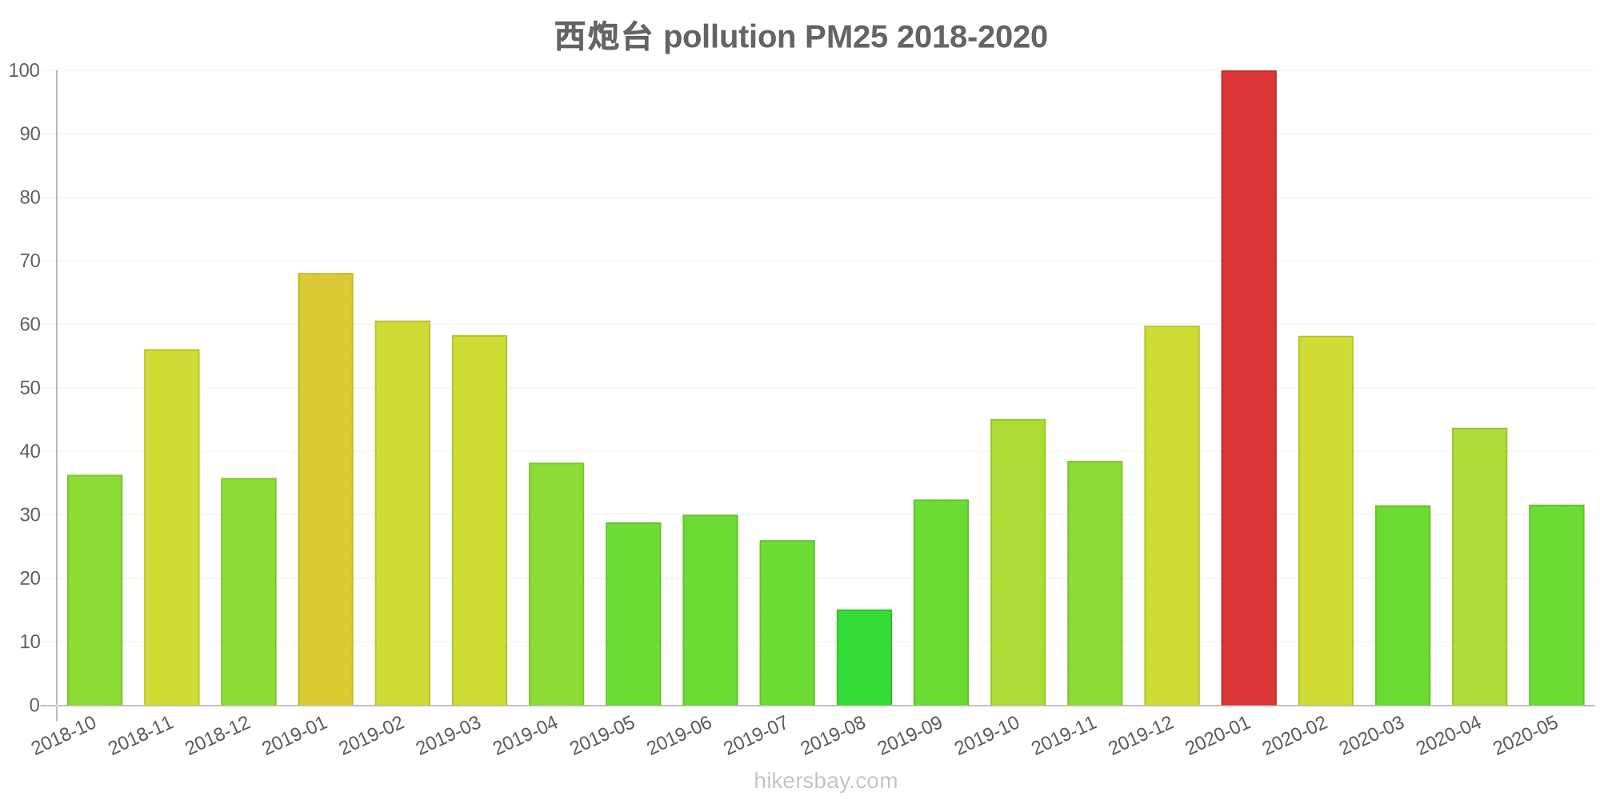
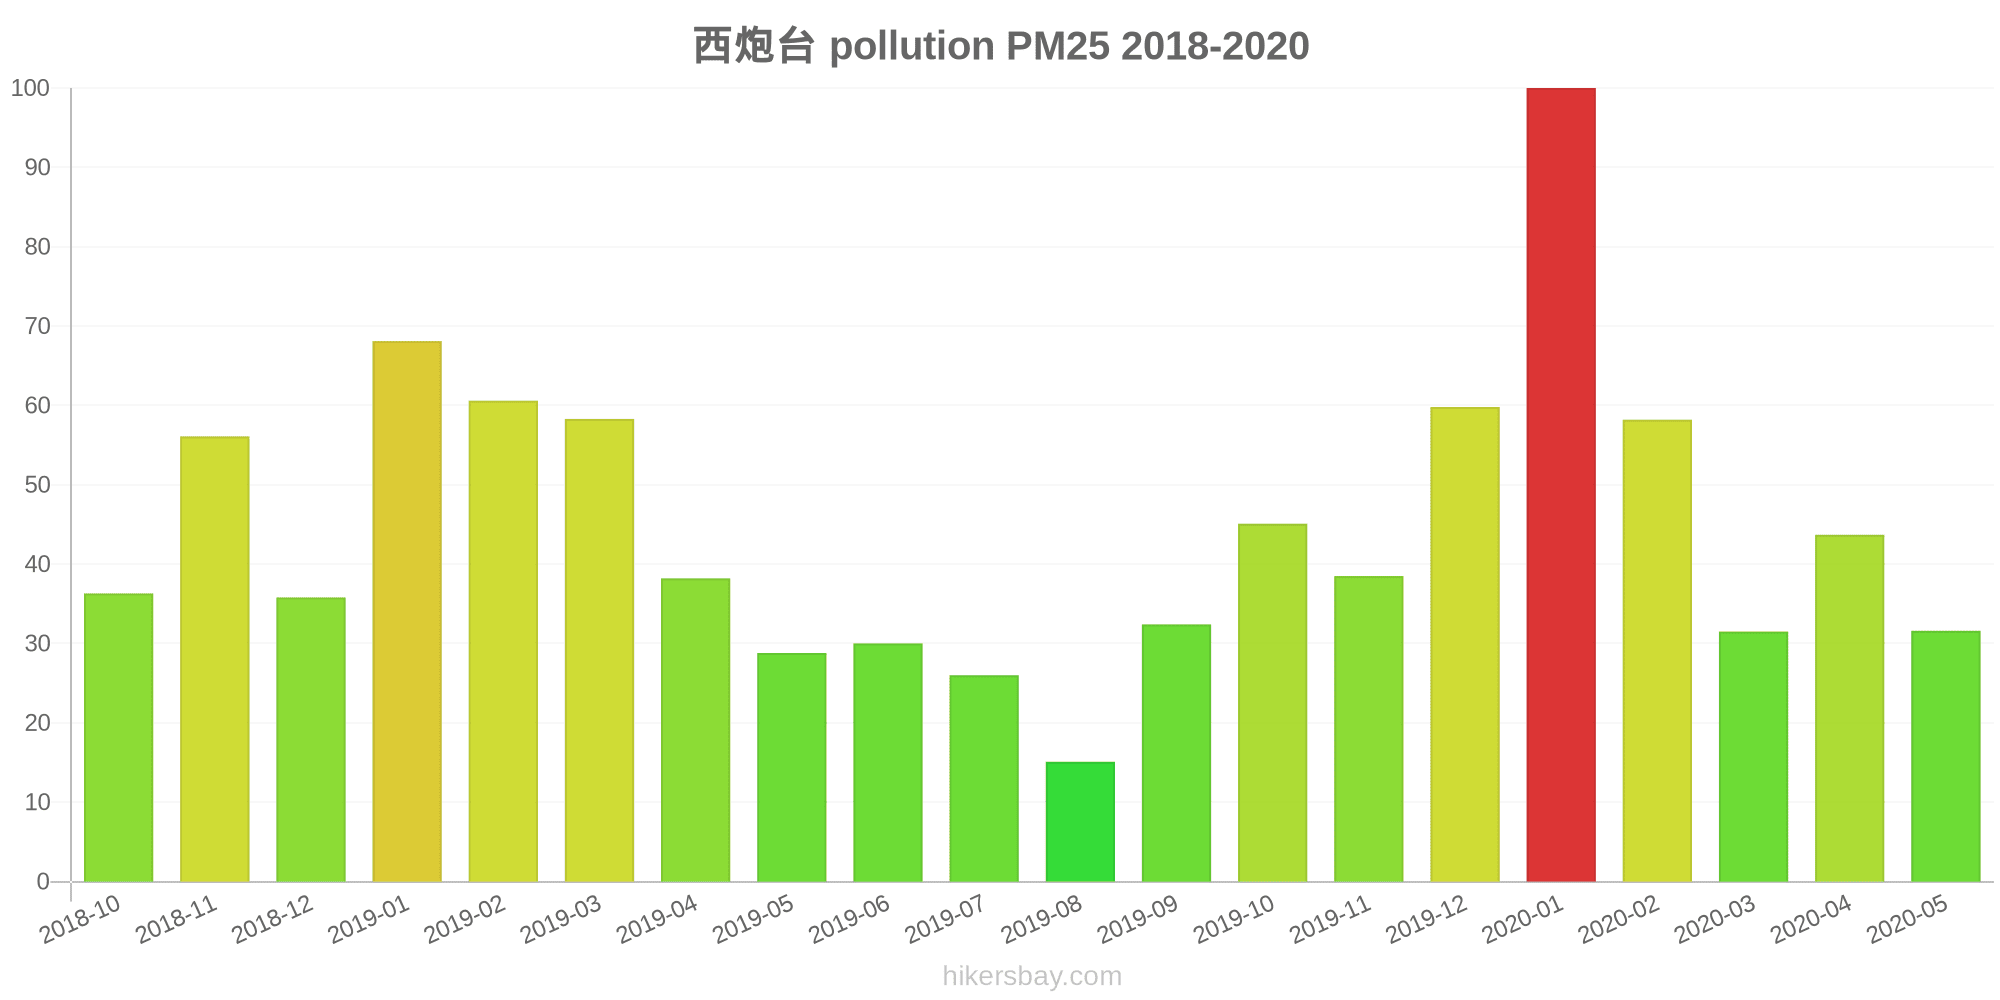
Die höchsten PM2,5-Werte wurden gemessen: 100 (Januar 2020).
Die niedrigste Feinstaubbelastung PM2,5 tritt im Monat auf: August (15).
Wie hoch ist der CO-Gehalt? (Kohlenmonoxid (CO))
100 (gut)
Wie hoch ist das NO2-Niveau? (Stickstoffdioxid (NO2))
8 (gut)
Wie ist das O3-Niveau heute in Liaobin? (Ozon (O3))
0 (gut)
Wie hoch ist die SO2-Belastung? (Schwefeldioxid (SO2))
9 (gut)
Aktuelle Daten Freitag, 27. Mai 2022, 12:00
PM10 7 (gut)
PM2,5 2 (gut)
CO 100 (gut)
NO2 8 (gut)
O3 0 (gut)
SO2 9 (gut)
Daten zur Luftverschmutzung der letzten Tage in Liaobin
index
2022-05-27
pm10
32
Moderate
pm25
24
Moderate
co
468
Good
no2
21
Good
o3
32
Good
so2
5
Good
data source »
Luftverschmutzung in Liaobin von Oktober 2018 bis Mai 2020

index
2020-05
2020-04
2020-03
2020-02
2020-01
2019-12
2019-11
2019-10
2019-09
2019-08
2019-07
2019-06
2019-05
2019-04
2019-03
2019-02
2019-01
2018-12
2018-11
2018-10
pm25
32 (Moderate)
44 (Unhealthy for Sensitive Groups)
32 (Moderate)
58 (Unhealthy)
100 (Very Unhealthy)
60 (Unhealthy)
39 (Unhealthy for Sensitive Groups)
45 (Unhealthy for Sensitive Groups)
32 (Moderate)
15 (Moderate)
26 (Moderate)
30 (Moderate)
29 (Moderate)
38 (Unhealthy for Sensitive Groups)
58 (Unhealthy)
61 (Unhealthy)
68 (Unhealthy)
36 (Unhealthy for Sensitive Groups)
56 (Unhealthy)
36 (Unhealthy for Sensitive Groups)
co
630 (Good)
617 (Good)
613 (Good)
870 (Good)
1 (Good)
1 (Good)
847 (Good)
769 (Good)
887 (Good)
622 (Good)
633 (Good)
450 (Good)
469 (Good)
591 (Good)
649 (Good)
807 (Good)
861 (Good)
549 (Good)
826 (Good)
588 (Good)
no2
24 (Good)
27 (Good)
26 (Good)
26 (Good)
44 (Moderate)
37 (Good)
33 (Good)
32 (Good)
26 (Good)
17 (Good)
14 (Good)
19 (Good)
20 (Good)
23 (Good)
29 (Good)
31 (Good)
35 (Good)
31 (Good)
39 (Good)
30 (Good)
o3
141 (Unhealthy for Sensitive Groups)
136 (Unhealthy for Sensitive Groups)
104 (Moderate)
84 (Moderate)
70 (Good)
62 (Good)
65 (Good)
104 (Moderate)
142 (Unhealthy for Sensitive Groups)
123 (Unhealthy for Sensitive Groups)
171 (Unhealthy)
157 (Unhealthy)
173 (Unhealthy)
140 (Unhealthy for Sensitive Groups)
112 (Moderate)
86 (Moderate)
76 (Moderate)
68 (Good)
85 (Moderate)
106 (Moderate)
pm10
56 (Unhealthy for Sensitive Groups)
82 (Unhealthy)
58 (Unhealthy for Sensitive Groups)
85 (Unhealthy)
120 (Very Unhealthy)
79 (Unhealthy for Sensitive Groups)
65 (Unhealthy for Sensitive Groups)
81 (Unhealthy)
61 (Unhealthy for Sensitive Groups)
24 (Moderate)
37 (Moderate)
43 (Moderate)
64 (Unhealthy for Sensitive Groups)
68 (Unhealthy for Sensitive Groups)
88 (Unhealthy)
84 (Unhealthy)
98 (Unhealthy)
58 (Unhealthy for Sensitive Groups)
80 (Unhealthy)
58 (Unhealthy for Sensitive Groups)
so2
5.9 (Good)
9.7 (Good)
8.2 (Good)
8.8 (Good)
16 (Good)
12 (Good)
12 (Good)
6.7 (Good)
6.8 (Good)
6.1 (Good)
3.5 (Good)
4.9 (Good)
6.2 (Good)
7.3 (Good)
9.6 (Good)
15 (Good)
14 (Good)
12 (Good)
11 (Good)
6.6 (Good)
data source »
西炮台
Freitag, 27. Mai 2022, 12:00
PM10 6.7 (gut)
Feinstaub (PM10) Schwebestaub
PM2,5 1.7 (gut)
Feinstaub (PM2,5)
CO 100 (gut)
Kohlenmonoxid (CO)
NO2 7.6 (gut)
Stickstoffdioxid (NO2)
O3 0.02 (gut)
Ozon (O3)
SO2 8.6 (gut)
Schwefeldioxid (SO2)
西炮台
index
2022-05-27
pm10
32
pm25
24
co
468
no2
21
o3
32
so2
4.6
西炮台
2018-10 2020-05
index
2020-05
2020-04
2020-03
2020-02
2020-01
2019-12
2019-11
2019-10
2019-09
2019-08
2019-07
2019-06
2019-05
2019-04
2019-03
2019-02
2019-01
2018-12
2018-11
2018-10
pm25
32
44
32
58
100
60
39
45
32
15
26
30
29
38
58
61
68
36
56
36
co
630
617
613
870
1
1
847
769
887
622
633
450
469
591
649
807
861
549
826
588
no2
24
27
26
26
44
37
33
32
26
17
14
19
20
23
29
31
35
31
39
30
o3
141
136
104
84
70
62
65
104
142
123
171
157
173
140
112
86
76
68
85
106
pm10
56
82
58
85
120
79
65
81
61
24
37
43
64
68
88
84
98
58
80
58
so2
5.9
9.7
8.2
8.8
16
12
12
6.7
6.8
6.1
3.5
4.9
6.2
7.3
9.6
15
14
12
11
6.6
* Pollution data source:
https://openaq.org
(ChinaAQIData)
The data is licensed under CC-By 4.0
PM10 7 (gut)
PM2,5 2 (gut)
CO 100 (gut)
NO2 8 (gut)
O3 0 (gut)
SO2 9 (gut)
Daten zur Luftverschmutzung der letzten Tage in Liaobin
| index | 2022-05-27 |
|---|---|
| pm10 | 32 Moderate |
| pm25 | 24 Moderate |
| co | 468 Good |
| no2 | 21 Good |
| o3 | 32 Good |
| so2 | 5 Good |

| index | 2020-05 | 2020-04 | 2020-03 | 2020-02 | 2020-01 | 2019-12 | 2019-11 | 2019-10 | 2019-09 | 2019-08 | 2019-07 | 2019-06 | 2019-05 | 2019-04 | 2019-03 | 2019-02 | 2019-01 | 2018-12 | 2018-11 | 2018-10 |
|---|---|---|---|---|---|---|---|---|---|---|---|---|---|---|---|---|---|---|---|---|
| pm25 | 32 (Moderate) | 44 (Unhealthy for Sensitive Groups) | 32 (Moderate) | 58 (Unhealthy) | 100 (Very Unhealthy) | 60 (Unhealthy) | 39 (Unhealthy for Sensitive Groups) | 45 (Unhealthy for Sensitive Groups) | 32 (Moderate) | 15 (Moderate) | 26 (Moderate) | 30 (Moderate) | 29 (Moderate) | 38 (Unhealthy for Sensitive Groups) | 58 (Unhealthy) | 61 (Unhealthy) | 68 (Unhealthy) | 36 (Unhealthy for Sensitive Groups) | 56 (Unhealthy) | 36 (Unhealthy for Sensitive Groups) |
| co | 630 (Good) | 617 (Good) | 613 (Good) | 870 (Good) | 1 (Good) | 1 (Good) | 847 (Good) | 769 (Good) | 887 (Good) | 622 (Good) | 633 (Good) | 450 (Good) | 469 (Good) | 591 (Good) | 649 (Good) | 807 (Good) | 861 (Good) | 549 (Good) | 826 (Good) | 588 (Good) |
| no2 | 24 (Good) | 27 (Good) | 26 (Good) | 26 (Good) | 44 (Moderate) | 37 (Good) | 33 (Good) | 32 (Good) | 26 (Good) | 17 (Good) | 14 (Good) | 19 (Good) | 20 (Good) | 23 (Good) | 29 (Good) | 31 (Good) | 35 (Good) | 31 (Good) | 39 (Good) | 30 (Good) |
| o3 | 141 (Unhealthy for Sensitive Groups) | 136 (Unhealthy for Sensitive Groups) | 104 (Moderate) | 84 (Moderate) | 70 (Good) | 62 (Good) | 65 (Good) | 104 (Moderate) | 142 (Unhealthy for Sensitive Groups) | 123 (Unhealthy for Sensitive Groups) | 171 (Unhealthy) | 157 (Unhealthy) | 173 (Unhealthy) | 140 (Unhealthy for Sensitive Groups) | 112 (Moderate) | 86 (Moderate) | 76 (Moderate) | 68 (Good) | 85 (Moderate) | 106 (Moderate) |
| pm10 | 56 (Unhealthy for Sensitive Groups) | 82 (Unhealthy) | 58 (Unhealthy for Sensitive Groups) | 85 (Unhealthy) | 120 (Very Unhealthy) | 79 (Unhealthy for Sensitive Groups) | 65 (Unhealthy for Sensitive Groups) | 81 (Unhealthy) | 61 (Unhealthy for Sensitive Groups) | 24 (Moderate) | 37 (Moderate) | 43 (Moderate) | 64 (Unhealthy for Sensitive Groups) | 68 (Unhealthy for Sensitive Groups) | 88 (Unhealthy) | 84 (Unhealthy) | 98 (Unhealthy) | 58 (Unhealthy for Sensitive Groups) | 80 (Unhealthy) | 58 (Unhealthy for Sensitive Groups) |
| so2 | 5.9 (Good) | 9.7 (Good) | 8.2 (Good) | 8.8 (Good) | 16 (Good) | 12 (Good) | 12 (Good) | 6.7 (Good) | 6.8 (Good) | 6.1 (Good) | 3.5 (Good) | 4.9 (Good) | 6.2 (Good) | 7.3 (Good) | 9.6 (Good) | 15 (Good) | 14 (Good) | 12 (Good) | 11 (Good) | 6.6 (Good) |
PM10 6.7 (gut)
Feinstaub (PM10) SchwebestaubPM2,5 1.7 (gut)
Feinstaub (PM2,5)CO 100 (gut)
Kohlenmonoxid (CO)NO2 7.6 (gut)
Stickstoffdioxid (NO2)O3 0.02 (gut)
Ozon (O3)SO2 8.6 (gut)
Schwefeldioxid (SO2)西炮台
| index | 2022-05-27 |
|---|---|
| pm10 | 32 |
| pm25 | 24 |
| co | 468 |
| no2 | 21 |
| o3 | 32 |
| so2 | 4.6 |
西炮台
| index | 2020-05 | 2020-04 | 2020-03 | 2020-02 | 2020-01 | 2019-12 | 2019-11 | 2019-10 | 2019-09 | 2019-08 | 2019-07 | 2019-06 | 2019-05 | 2019-04 | 2019-03 | 2019-02 | 2019-01 | 2018-12 | 2018-11 | 2018-10 |
|---|---|---|---|---|---|---|---|---|---|---|---|---|---|---|---|---|---|---|---|---|
| pm25 | 32 | 44 | 32 | 58 | 100 | 60 | 39 | 45 | 32 | 15 | 26 | 30 | 29 | 38 | 58 | 61 | 68 | 36 | 56 | 36 |
| co | 630 | 617 | 613 | 870 | 1 | 1 | 847 | 769 | 887 | 622 | 633 | 450 | 469 | 591 | 649 | 807 | 861 | 549 | 826 | 588 |
| no2 | 24 | 27 | 26 | 26 | 44 | 37 | 33 | 32 | 26 | 17 | 14 | 19 | 20 | 23 | 29 | 31 | 35 | 31 | 39 | 30 |
| o3 | 141 | 136 | 104 | 84 | 70 | 62 | 65 | 104 | 142 | 123 | 171 | 157 | 173 | 140 | 112 | 86 | 76 | 68 | 85 | 106 |
| pm10 | 56 | 82 | 58 | 85 | 120 | 79 | 65 | 81 | 61 | 24 | 37 | 43 | 64 | 68 | 88 | 84 | 98 | 58 | 80 | 58 |
| so2 | 5.9 | 9.7 | 8.2 | 8.8 | 16 | 12 | 12 | 6.7 | 6.8 | 6.1 | 3.5 | 4.9 | 6.2 | 7.3 | 9.6 | 15 | 14 | 12 | 11 | 6.6 |