Luftverschmutzung in Jilin City: Echtzeit-Luft-Qualitätsindex und Smog-Alarm.
Für die Jilin City. Heute ist Donnerstag, 4. Juni 2026. Für Jilin City wurden folgende Luftverschmutzungswerte gemessen:- Feinstaub (PM10) Schwebestaub - 7 (gut)
- Feinstaub (PM2,5) - 2 (gut)
- Kohlenmonoxid (CO) - 100 (gut)
- Stickstoffdioxid (NO2) - 8 (gut)
- Ozon (O3) - 0 (gut)
- Schwefeldioxid (SO2) - 9 (gut)

Wie ist die Luftqualität Jilin City heute? Ist die Luft in Jilin City? verschmutzt. Gibt es Smog?
Wie hoch ist der PM10-Stand heute in Jilin City? (Feinstaub (PM10) Schwebestaub)
Der aktuelle Feinstaubgehalt PM10 in Jilin City is:
7 (gut)
Die höchsten PM10-Werte treten in der Regel im Monat auf: 117 (Januar 2020).
Der niedrigste Wert der Feinstaub-PM10-Belastung in Jilin City ist in der Regel in: Juni (24).
Wie hoch ist der aktuelle PM2,5-Wert in Jilin City? (Feinstaub (PM2,5))
Die heutige PM2.5-Stufe ist:
2 (gut)
Zum Vergleich: Der höchste PM2,5-Wert in Jilin City in den letzten 7 Tagen war: 24 (Freitag, 27. Mai 2022) und der niedrigste: 24 (Freitag, 27. Mai 2022).
Die höchsten PM2,5-Werte wurden gemessen: 94 (Januar 2020).
Die niedrigste Feinstaubbelastung PM2,5 tritt im Monat auf: August (16).
Wie hoch ist der CO-Gehalt? (Kohlenmonoxid (CO))
100 (gut)
Wie hoch ist das NO2-Niveau? (Stickstoffdioxid (NO2))
8 (gut)
Wie ist das O3-Niveau heute in Jilin City? (Ozon (O3))
0 (gut)
Wie hoch ist die SO2-Belastung? (Schwefeldioxid (SO2))
9 (gut)
Aktuelle Daten Freitag, 27. Mai 2022, 12:00
PM10 7 (gut)
PM2,5 2 (gut)
CO 100 (gut)
NO2 8 (gut)
O3 0 (gut)
SO2 9 (gut)
Daten zur Luftverschmutzung der letzten Tage in Jilin City
index
2022-05-27
pm10
32
Moderate
pm25
24
Moderate
co
468
Good
no2
21
Good
o3
32
Good
so2
5
Good
data source »
Luftverschmutzung in Jilin City von Oktober 2018 bis Mai 2020
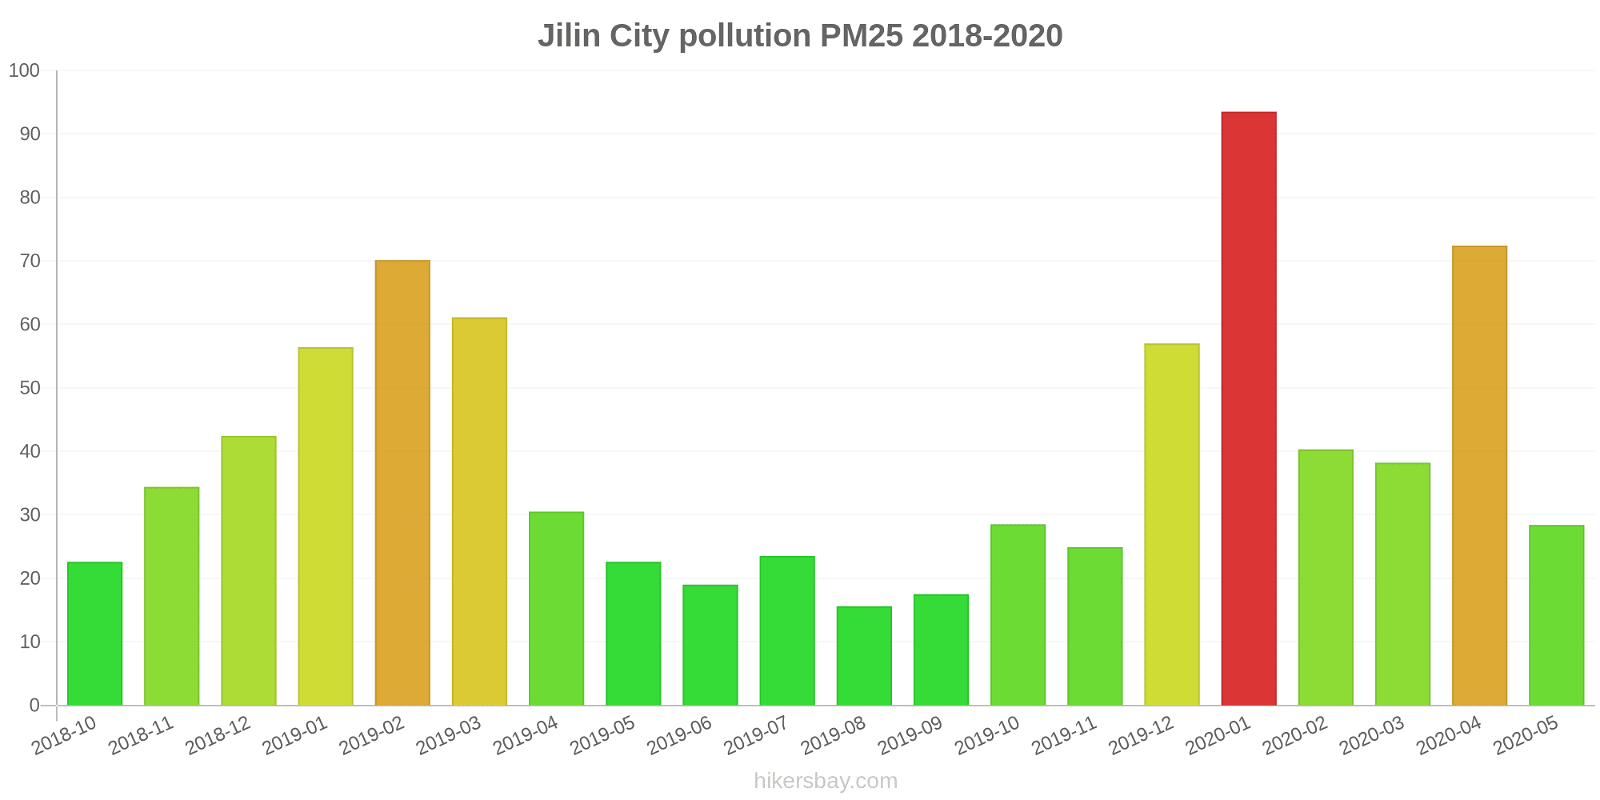
index
2020-05
2020-04
2020-03
2020-02
2020-01
2019-12
2019-11
2019-10
2019-09
2019-08
2019-07
2019-06
2019-05
2019-04
2019-03
2019-02
2019-01
2018-12
2018-11
2018-10
pm25
28 (Moderate)
72 (Unhealthy)
38 (Unhealthy for Sensitive Groups)
40 (Unhealthy for Sensitive Groups)
94 (Very Unhealthy)
57 (Unhealthy)
25 (Moderate)
29 (Moderate)
18 (Moderate)
16 (Moderate)
24 (Moderate)
19 (Moderate)
23 (Moderate)
31 (Moderate)
61 (Unhealthy)
70 (Unhealthy)
56 (Unhealthy)
42 (Unhealthy for Sensitive Groups)
34 (Moderate)
23 (Moderate)
co
760 (Good)
871 (Good)
710 (Good)
745 (Good)
1 (Good)
887 (Good)
665 (Good)
777 (Good)
765 (Good)
801 (Good)
752 (Good)
685 (Good)
584 (Good)
667 (Good)
808 (Good)
936 (Good)
919 (Good)
564 (Good)
738 (Good)
724 (Good)
no2
25 (Good)
31 (Good)
22 (Good)
21 (Good)
44 (Moderate)
35 (Good)
27 (Good)
31 (Good)
24 (Good)
17 (Good)
17 (Good)
21 (Good)
20 (Good)
24 (Good)
28 (Good)
27 (Good)
32 (Good)
24 (Good)
31 (Good)
33 (Good)
o3
130 (Unhealthy for Sensitive Groups)
134 (Unhealthy for Sensitive Groups)
99 (Moderate)
90 (Moderate)
81 (Moderate)
65 (Good)
64 (Good)
91 (Moderate)
96 (Moderate)
86 (Moderate)
131 (Unhealthy for Sensitive Groups)
146 (Unhealthy for Sensitive Groups)
145 (Unhealthy for Sensitive Groups)
120 (Unhealthy for Sensitive Groups)
108 (Moderate)
90 (Moderate)
69 (Good)
64 (Good)
63 (Good)
76 (Moderate)
pm10
57 (Unhealthy for Sensitive Groups)
104 (Unhealthy)
62 (Unhealthy for Sensitive Groups)
52 (Unhealthy for Sensitive Groups)
117 (Very Unhealthy)
78 (Unhealthy for Sensitive Groups)
49 (Moderate)
60 (Unhealthy for Sensitive Groups)
38 (Moderate)
25 (Moderate)
29 (Moderate)
24 (Moderate)
43 (Moderate)
65 (Unhealthy for Sensitive Groups)
85 (Unhealthy)
90 (Unhealthy)
85 (Unhealthy)
67 (Unhealthy for Sensitive Groups)
56 (Unhealthy for Sensitive Groups)
51 (Unhealthy for Sensitive Groups)
so2
13 (Good)
12 (Good)
13 (Good)
18 (Good)
24 (Good)
17 (Good)
13 (Good)
10 (Good)
9.4 (Good)
7.9 (Good)
6.6 (Good)
9.9 (Good)
10 (Good)
8.3 (Good)
11 (Good)
17 (Good)
14 (Good)
13 (Good)
14 (Good)
8.8 (Good)
data source »
东局子
Freitag, 27. Mai 2022, 12:00
PM10 6.7 (gut)
Feinstaub (PM10) Schwebestaub
PM2,5 1.7 (gut)
Feinstaub (PM2,5)
CO 100 (gut)
Kohlenmonoxid (CO)
NO2 7.6 (gut)
Stickstoffdioxid (NO2)
O3 0.02 (gut)
Ozon (O3)
SO2 8.6 (gut)
Schwefeldioxid (SO2)
东局子
index
2022-05-27
pm10
32
pm25
24
co
468
no2
21
o3
32
so2
4.6
东局子
2018-10 2020-05

index
2020-05
2020-04
2020-03
2020-02
2020-01
2019-12
2019-11
2019-10
2019-09
2019-08
2019-07
2019-06
2019-05
2019-04
2019-03
2019-02
2019-01
2018-12
2018-11
2018-10
pm25
28
72
38
40
94
57
25
29
18
16
24
19
23
31
61
70
56
42
34
23
co
760
871
710
745
1
887
665
777
765
801
752
685
584
667
808
936
919
564
738
724
no2
25
31
22
21
44
35
27
31
24
17
17
21
20
24
28
27
32
24
31
33
o3
130
134
99
90
81
65
64
91
96
86
131
146
145
120
108
90
69
64
63
76
pm10
57
104
62
52
117
78
49
60
38
25
29
24
43
65
85
90
85
67
56
51
so2
13
12
13
18
24
17
13
10
9.4
7.9
6.6
9.9
10
8.3
11
17
14
13
14
8.8
* Pollution data source:
https://openaq.org
(ChinaAQIData)
The data is licensed under CC-By 4.0
PM10 7 (gut)
PM2,5 2 (gut)
CO 100 (gut)
NO2 8 (gut)
O3 0 (gut)
SO2 9 (gut)
Daten zur Luftverschmutzung der letzten Tage in Jilin City
| index | 2022-05-27 |
|---|---|
| pm10 | 32 Moderate |
| pm25 | 24 Moderate |
| co | 468 Good |
| no2 | 21 Good |
| o3 | 32 Good |
| so2 | 5 Good |

| index | 2020-05 | 2020-04 | 2020-03 | 2020-02 | 2020-01 | 2019-12 | 2019-11 | 2019-10 | 2019-09 | 2019-08 | 2019-07 | 2019-06 | 2019-05 | 2019-04 | 2019-03 | 2019-02 | 2019-01 | 2018-12 | 2018-11 | 2018-10 |
|---|---|---|---|---|---|---|---|---|---|---|---|---|---|---|---|---|---|---|---|---|
| pm25 | 28 (Moderate) | 72 (Unhealthy) | 38 (Unhealthy for Sensitive Groups) | 40 (Unhealthy for Sensitive Groups) | 94 (Very Unhealthy) | 57 (Unhealthy) | 25 (Moderate) | 29 (Moderate) | 18 (Moderate) | 16 (Moderate) | 24 (Moderate) | 19 (Moderate) | 23 (Moderate) | 31 (Moderate) | 61 (Unhealthy) | 70 (Unhealthy) | 56 (Unhealthy) | 42 (Unhealthy for Sensitive Groups) | 34 (Moderate) | 23 (Moderate) |
| co | 760 (Good) | 871 (Good) | 710 (Good) | 745 (Good) | 1 (Good) | 887 (Good) | 665 (Good) | 777 (Good) | 765 (Good) | 801 (Good) | 752 (Good) | 685 (Good) | 584 (Good) | 667 (Good) | 808 (Good) | 936 (Good) | 919 (Good) | 564 (Good) | 738 (Good) | 724 (Good) |
| no2 | 25 (Good) | 31 (Good) | 22 (Good) | 21 (Good) | 44 (Moderate) | 35 (Good) | 27 (Good) | 31 (Good) | 24 (Good) | 17 (Good) | 17 (Good) | 21 (Good) | 20 (Good) | 24 (Good) | 28 (Good) | 27 (Good) | 32 (Good) | 24 (Good) | 31 (Good) | 33 (Good) |
| o3 | 130 (Unhealthy for Sensitive Groups) | 134 (Unhealthy for Sensitive Groups) | 99 (Moderate) | 90 (Moderate) | 81 (Moderate) | 65 (Good) | 64 (Good) | 91 (Moderate) | 96 (Moderate) | 86 (Moderate) | 131 (Unhealthy for Sensitive Groups) | 146 (Unhealthy for Sensitive Groups) | 145 (Unhealthy for Sensitive Groups) | 120 (Unhealthy for Sensitive Groups) | 108 (Moderate) | 90 (Moderate) | 69 (Good) | 64 (Good) | 63 (Good) | 76 (Moderate) |
| pm10 | 57 (Unhealthy for Sensitive Groups) | 104 (Unhealthy) | 62 (Unhealthy for Sensitive Groups) | 52 (Unhealthy for Sensitive Groups) | 117 (Very Unhealthy) | 78 (Unhealthy for Sensitive Groups) | 49 (Moderate) | 60 (Unhealthy for Sensitive Groups) | 38 (Moderate) | 25 (Moderate) | 29 (Moderate) | 24 (Moderate) | 43 (Moderate) | 65 (Unhealthy for Sensitive Groups) | 85 (Unhealthy) | 90 (Unhealthy) | 85 (Unhealthy) | 67 (Unhealthy for Sensitive Groups) | 56 (Unhealthy for Sensitive Groups) | 51 (Unhealthy for Sensitive Groups) |
| so2 | 13 (Good) | 12 (Good) | 13 (Good) | 18 (Good) | 24 (Good) | 17 (Good) | 13 (Good) | 10 (Good) | 9.4 (Good) | 7.9 (Good) | 6.6 (Good) | 9.9 (Good) | 10 (Good) | 8.3 (Good) | 11 (Good) | 17 (Good) | 14 (Good) | 13 (Good) | 14 (Good) | 8.8 (Good) |
PM10 6.7 (gut)
Feinstaub (PM10) SchwebestaubPM2,5 1.7 (gut)
Feinstaub (PM2,5)CO 100 (gut)
Kohlenmonoxid (CO)NO2 7.6 (gut)
Stickstoffdioxid (NO2)O3 0.02 (gut)
Ozon (O3)SO2 8.6 (gut)
Schwefeldioxid (SO2)东局子
| index | 2022-05-27 |
|---|---|
| pm10 | 32 |
| pm25 | 24 |
| co | 468 |
| no2 | 21 |
| o3 | 32 |
| so2 | 4.6 |
东局子

| index | 2020-05 | 2020-04 | 2020-03 | 2020-02 | 2020-01 | 2019-12 | 2019-11 | 2019-10 | 2019-09 | 2019-08 | 2019-07 | 2019-06 | 2019-05 | 2019-04 | 2019-03 | 2019-02 | 2019-01 | 2018-12 | 2018-11 | 2018-10 |
|---|---|---|---|---|---|---|---|---|---|---|---|---|---|---|---|---|---|---|---|---|
| pm25 | 28 | 72 | 38 | 40 | 94 | 57 | 25 | 29 | 18 | 16 | 24 | 19 | 23 | 31 | 61 | 70 | 56 | 42 | 34 | 23 |
| co | 760 | 871 | 710 | 745 | 1 | 887 | 665 | 777 | 765 | 801 | 752 | 685 | 584 | 667 | 808 | 936 | 919 | 564 | 738 | 724 |
| no2 | 25 | 31 | 22 | 21 | 44 | 35 | 27 | 31 | 24 | 17 | 17 | 21 | 20 | 24 | 28 | 27 | 32 | 24 | 31 | 33 |
| o3 | 130 | 134 | 99 | 90 | 81 | 65 | 64 | 91 | 96 | 86 | 131 | 146 | 145 | 120 | 108 | 90 | 69 | 64 | 63 | 76 |
| pm10 | 57 | 104 | 62 | 52 | 117 | 78 | 49 | 60 | 38 | 25 | 29 | 24 | 43 | 65 | 85 | 90 | 85 | 67 | 56 | 51 |
| so2 | 13 | 12 | 13 | 18 | 24 | 17 | 13 | 10 | 9.4 | 7.9 | 6.6 | 9.9 | 10 | 8.3 | 11 | 17 | 14 | 13 | 14 | 8.8 |