Luftverschmutzung in Chaoyang Shi: Echtzeit-Luft-Qualitätsindex und Smog-Alarm.
Für die Chaoyang Shi. Heute ist Donnerstag, 4. Juni 2026. Für Chaoyang Shi wurden folgende Luftverschmutzungswerte gemessen:- Feinstaub (PM10) Schwebestaub - 7 (gut)
- Feinstaub (PM2,5) - 2 (gut)
- Kohlenmonoxid (CO) - 100 (gut)
- Stickstoffdioxid (NO2) - 8 (gut)
- Ozon (O3) - 0 (gut)
- Schwefeldioxid (SO2) - 9 (gut)

Wie ist die Luftqualität Chaoyang Shi heute? Ist die Luft in Chaoyang Shi? verschmutzt. Gibt es Smog?
Wie hoch ist der PM10-Stand heute in Chaoyang Shi? (Feinstaub (PM10) Schwebestaub)
Der aktuelle Feinstaubgehalt PM10 in Chaoyang Shi is:
7 (gut)
Die höchsten PM10-Werte treten in der Regel im Monat auf: 102 (Januar 2020).
Der niedrigste Wert der Feinstaub-PM10-Belastung in Chaoyang Shi ist in der Regel in: August (30).
Wie hoch ist der aktuelle PM2,5-Wert in Chaoyang Shi? (Feinstaub (PM2,5))
Die heutige PM2.5-Stufe ist:
2 (gut)
Zum Vergleich: Der höchste PM2,5-Wert in Chaoyang Shi in den letzten 7 Tagen war: 24 (Freitag, 27. Mai 2022) und der niedrigste: 24 (Freitag, 27. Mai 2022).
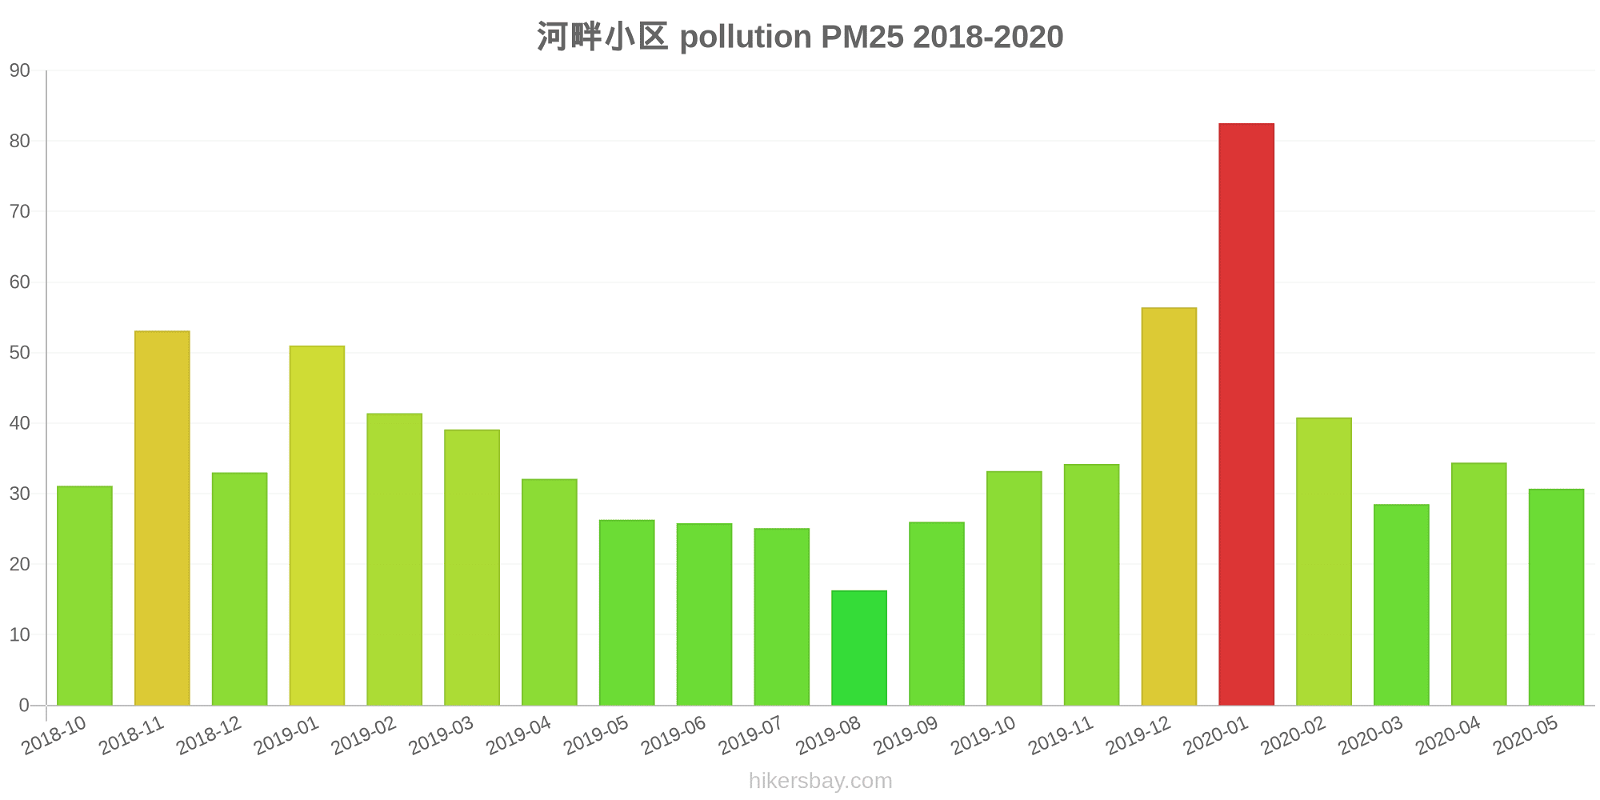
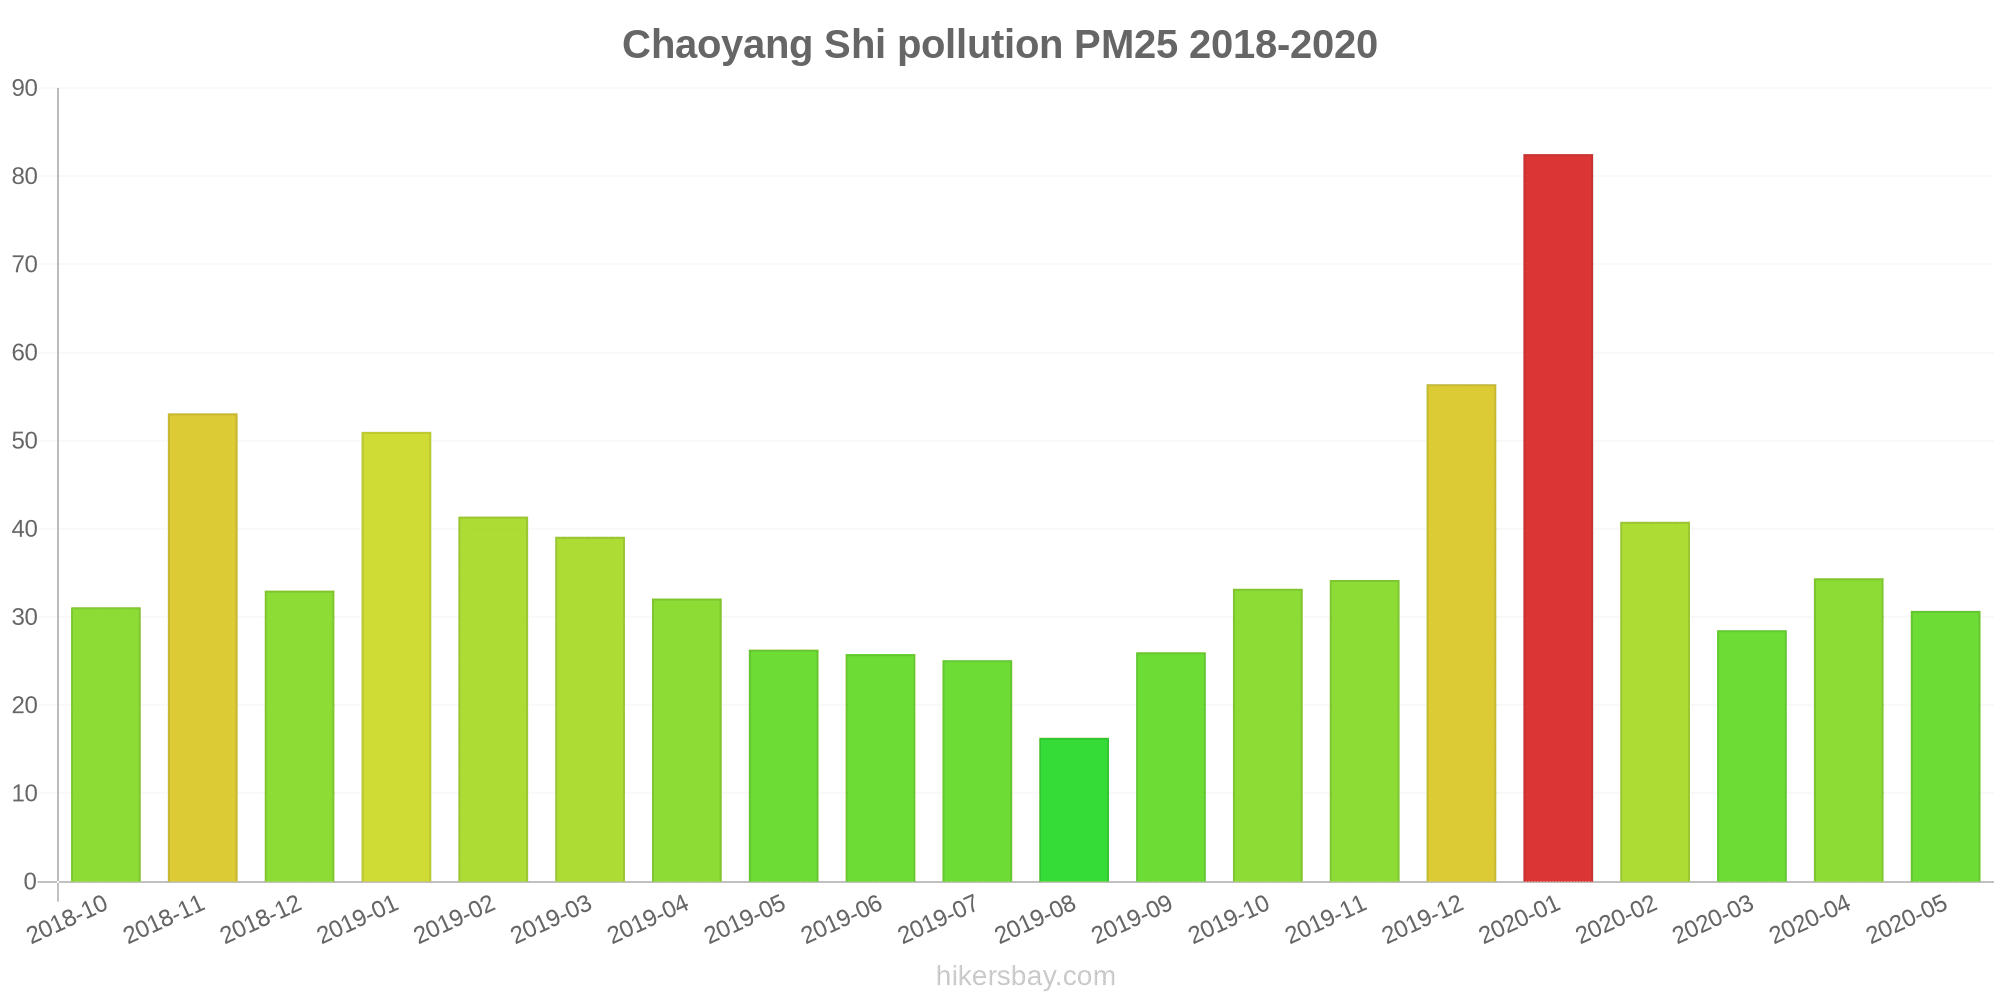
Die höchsten PM2,5-Werte wurden gemessen: 83 (Januar 2020).
Die niedrigste Feinstaubbelastung PM2,5 tritt im Monat auf: August (16).
Wie hoch ist der CO-Gehalt? (Kohlenmonoxid (CO))
100 (gut)
Wie hoch ist das NO2-Niveau? (Stickstoffdioxid (NO2))
8 (gut)
Wie ist das O3-Niveau heute in Chaoyang Shi? (Ozon (O3))
0 (gut)
Wie hoch ist die SO2-Belastung? (Schwefeldioxid (SO2))
9 (gut)
Aktuelle Daten Freitag, 27. Mai 2022, 12:00
PM10 7 (gut)
PM2,5 2 (gut)
CO 100 (gut)
NO2 8 (gut)
O3 0 (gut)
SO2 9 (gut)
Daten zur Luftverschmutzung der letzten Tage in Chaoyang Shi
index
2022-05-27
pm10
32
Moderate
pm25
24
Moderate
co
468
Good
no2
21
Good
o3
32
Good
so2
5
Good
data source »
Luftverschmutzung in Chaoyang Shi von Oktober 2018 bis Mai 2020

index
2020-05
2020-04
2020-03
2020-02
2020-01
2019-12
2019-11
2019-10
2019-09
2019-08
2019-07
2019-06
2019-05
2019-04
2019-03
2019-02
2019-01
2018-12
2018-11
2018-10
pm25
31 (Moderate)
34 (Moderate)
29 (Moderate)
41 (Unhealthy for Sensitive Groups)
83 (Very Unhealthy)
56 (Unhealthy)
34 (Moderate)
33 (Moderate)
26 (Moderate)
16 (Moderate)
25 (Moderate)
26 (Moderate)
26 (Moderate)
32 (Moderate)
39 (Unhealthy for Sensitive Groups)
41 (Unhealthy for Sensitive Groups)
51 (Unhealthy for Sensitive Groups)
33 (Moderate)
53 (Unhealthy for Sensitive Groups)
31 (Moderate)
co
750 (Good)
796 (Good)
771 (Good)
989 (Good)
1 (Good)
1 (Good)
819 (Good)
901 (Good)
864 (Good)
787 (Good)
974 (Good)
796 (Good)
728 (Good)
679 (Good)
935 (Good)
1 (Good)
1 (Good)
927 (Good)
1 (Good)
1 (Good)
no2
12 (Good)
17 (Good)
15 (Good)
13 (Good)
34 (Good)
32 (Good)
26 (Good)
24 (Good)
18 (Good)
11 (Good)
13 (Good)
13 (Good)
15 (Good)
18 (Good)
21 (Good)
23 (Good)
33 (Good)
26 (Good)
33 (Good)
26 (Good)
o3
141 (Unhealthy for Sensitive Groups)
115 (Moderate)
89 (Moderate)
84 (Moderate)
73 (Moderate)
62 (Good)
72 (Moderate)
102 (Moderate)
133 (Unhealthy for Sensitive Groups)
110 (Moderate)
160 (Unhealthy)
161 (Unhealthy)
150 (Unhealthy)
121 (Unhealthy for Sensitive Groups)
111 (Moderate)
83 (Moderate)
65 (Good)
59 (Good)
69 (Good)
87 (Moderate)
pm10
65 (Unhealthy for Sensitive Groups)
71 (Unhealthy for Sensitive Groups)
52 (Unhealthy for Sensitive Groups)
57 (Unhealthy for Sensitive Groups)
102 (Unhealthy)
75 (Unhealthy for Sensitive Groups)
63 (Unhealthy for Sensitive Groups)
63 (Unhealthy for Sensitive Groups)
52 (Unhealthy for Sensitive Groups)
30 (Moderate)
42 (Moderate)
40 (Moderate)
67 (Unhealthy for Sensitive Groups)
85 (Unhealthy)
76 (Unhealthy for Sensitive Groups)
70 (Unhealthy for Sensitive Groups)
90 (Unhealthy)
68 (Unhealthy for Sensitive Groups)
94 (Unhealthy)
61 (Unhealthy for Sensitive Groups)
so2
14 (Good)
13 (Good)
13 (Good)
15 (Good)
33 (Good)
30 (Good)
20 (Good)
17 (Good)
15 (Good)
12 (Good)
12 (Good)
15 (Good)
15 (Good)
18 (Good)
20 (Good)
26 (Good)
30 (Good)
26 (Good)
25 (Good)
10 (Good)
data source »
河畔小区
Freitag, 27. Mai 2022, 12:00
PM10 6.7 (gut)
Feinstaub (PM10) Schwebestaub
PM2,5 1.7 (gut)
Feinstaub (PM2,5)
CO 100 (gut)
Kohlenmonoxid (CO)
NO2 7.6 (gut)
Stickstoffdioxid (NO2)
O3 0.02 (gut)
Ozon (O3)
SO2 8.6 (gut)
Schwefeldioxid (SO2)
河畔小区
index
2022-05-27
pm10
32
pm25
24
co
468
no2
21
o3
32
so2
4.6
河畔小区
2018-10 2020-05
index
2020-05
2020-04
2020-03
2020-02
2020-01
2019-12
2019-11
2019-10
2019-09
2019-08
2019-07
2019-06
2019-05
2019-04
2019-03
2019-02
2019-01
2018-12
2018-11
2018-10
pm25
31
34
29
41
83
56
34
33
26
16
25
26
26
32
39
41
51
33
53
31
co
750
796
771
989
1
1
819
901
864
787
974
796
728
679
935
1
1
927
1
1
no2
12
17
15
13
34
32
26
24
18
11
13
13
15
18
21
23
33
26
33
26
o3
141
115
89
84
73
62
72
102
133
110
160
161
150
121
111
83
65
59
69
87
pm10
65
71
52
57
102
75
63
63
52
30
42
40
67
85
76
70
90
68
94
61
so2
14
13
13
15
33
30
20
17
15
12
12
15
15
18
20
26
30
26
25
10
* Pollution data source:
https://openaq.org
(ChinaAQIData)
The data is licensed under CC-By 4.0
PM10 7 (gut)
PM2,5 2 (gut)
CO 100 (gut)
NO2 8 (gut)
O3 0 (gut)
SO2 9 (gut)
Daten zur Luftverschmutzung der letzten Tage in Chaoyang Shi
| index | 2022-05-27 |
|---|---|
| pm10 | 32 Moderate |
| pm25 | 24 Moderate |
| co | 468 Good |
| no2 | 21 Good |
| o3 | 32 Good |
| so2 | 5 Good |
| index | 2020-05 | 2020-04 | 2020-03 | 2020-02 | 2020-01 | 2019-12 | 2019-11 | 2019-10 | 2019-09 | 2019-08 | 2019-07 | 2019-06 | 2019-05 | 2019-04 | 2019-03 | 2019-02 | 2019-01 | 2018-12 | 2018-11 | 2018-10 |
|---|---|---|---|---|---|---|---|---|---|---|---|---|---|---|---|---|---|---|---|---|
| pm25 | 31 (Moderate) | 34 (Moderate) | 29 (Moderate) | 41 (Unhealthy for Sensitive Groups) | 83 (Very Unhealthy) | 56 (Unhealthy) | 34 (Moderate) | 33 (Moderate) | 26 (Moderate) | 16 (Moderate) | 25 (Moderate) | 26 (Moderate) | 26 (Moderate) | 32 (Moderate) | 39 (Unhealthy for Sensitive Groups) | 41 (Unhealthy for Sensitive Groups) | 51 (Unhealthy for Sensitive Groups) | 33 (Moderate) | 53 (Unhealthy for Sensitive Groups) | 31 (Moderate) |
| co | 750 (Good) | 796 (Good) | 771 (Good) | 989 (Good) | 1 (Good) | 1 (Good) | 819 (Good) | 901 (Good) | 864 (Good) | 787 (Good) | 974 (Good) | 796 (Good) | 728 (Good) | 679 (Good) | 935 (Good) | 1 (Good) | 1 (Good) | 927 (Good) | 1 (Good) | 1 (Good) |
| no2 | 12 (Good) | 17 (Good) | 15 (Good) | 13 (Good) | 34 (Good) | 32 (Good) | 26 (Good) | 24 (Good) | 18 (Good) | 11 (Good) | 13 (Good) | 13 (Good) | 15 (Good) | 18 (Good) | 21 (Good) | 23 (Good) | 33 (Good) | 26 (Good) | 33 (Good) | 26 (Good) |
| o3 | 141 (Unhealthy for Sensitive Groups) | 115 (Moderate) | 89 (Moderate) | 84 (Moderate) | 73 (Moderate) | 62 (Good) | 72 (Moderate) | 102 (Moderate) | 133 (Unhealthy for Sensitive Groups) | 110 (Moderate) | 160 (Unhealthy) | 161 (Unhealthy) | 150 (Unhealthy) | 121 (Unhealthy for Sensitive Groups) | 111 (Moderate) | 83 (Moderate) | 65 (Good) | 59 (Good) | 69 (Good) | 87 (Moderate) |
| pm10 | 65 (Unhealthy for Sensitive Groups) | 71 (Unhealthy for Sensitive Groups) | 52 (Unhealthy for Sensitive Groups) | 57 (Unhealthy for Sensitive Groups) | 102 (Unhealthy) | 75 (Unhealthy for Sensitive Groups) | 63 (Unhealthy for Sensitive Groups) | 63 (Unhealthy for Sensitive Groups) | 52 (Unhealthy for Sensitive Groups) | 30 (Moderate) | 42 (Moderate) | 40 (Moderate) | 67 (Unhealthy for Sensitive Groups) | 85 (Unhealthy) | 76 (Unhealthy for Sensitive Groups) | 70 (Unhealthy for Sensitive Groups) | 90 (Unhealthy) | 68 (Unhealthy for Sensitive Groups) | 94 (Unhealthy) | 61 (Unhealthy for Sensitive Groups) |
| so2 | 14 (Good) | 13 (Good) | 13 (Good) | 15 (Good) | 33 (Good) | 30 (Good) | 20 (Good) | 17 (Good) | 15 (Good) | 12 (Good) | 12 (Good) | 15 (Good) | 15 (Good) | 18 (Good) | 20 (Good) | 26 (Good) | 30 (Good) | 26 (Good) | 25 (Good) | 10 (Good) |
PM10 6.7 (gut)
Feinstaub (PM10) SchwebestaubPM2,5 1.7 (gut)
Feinstaub (PM2,5)CO 100 (gut)
Kohlenmonoxid (CO)NO2 7.6 (gut)
Stickstoffdioxid (NO2)O3 0.02 (gut)
Ozon (O3)SO2 8.6 (gut)
Schwefeldioxid (SO2)河畔小区
| index | 2022-05-27 |
|---|---|
| pm10 | 32 |
| pm25 | 24 |
| co | 468 |
| no2 | 21 |
| o3 | 32 |
| so2 | 4.6 |
河畔小区

| index | 2020-05 | 2020-04 | 2020-03 | 2020-02 | 2020-01 | 2019-12 | 2019-11 | 2019-10 | 2019-09 | 2019-08 | 2019-07 | 2019-06 | 2019-05 | 2019-04 | 2019-03 | 2019-02 | 2019-01 | 2018-12 | 2018-11 | 2018-10 |
|---|---|---|---|---|---|---|---|---|---|---|---|---|---|---|---|---|---|---|---|---|
| pm25 | 31 | 34 | 29 | 41 | 83 | 56 | 34 | 33 | 26 | 16 | 25 | 26 | 26 | 32 | 39 | 41 | 51 | 33 | 53 | 31 |
| co | 750 | 796 | 771 | 989 | 1 | 1 | 819 | 901 | 864 | 787 | 974 | 796 | 728 | 679 | 935 | 1 | 1 | 927 | 1 | 1 |
| no2 | 12 | 17 | 15 | 13 | 34 | 32 | 26 | 24 | 18 | 11 | 13 | 13 | 15 | 18 | 21 | 23 | 33 | 26 | 33 | 26 |
| o3 | 141 | 115 | 89 | 84 | 73 | 62 | 72 | 102 | 133 | 110 | 160 | 161 | 150 | 121 | 111 | 83 | 65 | 59 | 69 | 87 |
| pm10 | 65 | 71 | 52 | 57 | 102 | 75 | 63 | 63 | 52 | 30 | 42 | 40 | 67 | 85 | 76 | 70 | 90 | 68 | 94 | 61 |
| so2 | 14 | 13 | 13 | 15 | 33 | 30 | 20 | 17 | 15 | 12 | 12 | 15 | 15 | 18 | 20 | 26 | 30 | 26 | 25 | 10 |