Luftverschmutzung in Xingbin: Echtzeit-Luft-Qualitätsindex und Smog-Alarm.
Für die Xingbin. Heute ist Donnerstag, 4. Juni 2026. Für Xingbin wurden folgende Luftverschmutzungswerte gemessen:- Feinstaub (PM10) Schwebestaub - 7 (gut)
- Feinstaub (PM2,5) - 2 (gut)
- Kohlenmonoxid (CO) - 100 (gut)
- Stickstoffdioxid (NO2) - 8 (gut)
- Ozon (O3) - 0 (gut)
- Schwefeldioxid (SO2) - 9 (gut)

Wie ist die Luftqualität Xingbin heute? Ist die Luft in Xingbin? verschmutzt. Gibt es Smog?
Wie hoch ist der PM10-Stand heute in Xingbin? (Feinstaub (PM10) Schwebestaub)
Der aktuelle Feinstaubgehalt PM10 in Xingbin is:
7 (gut)
Die höchsten PM10-Werte treten in der Regel im Monat auf: 82 (Dezember 2019).
Der niedrigste Wert der Feinstaub-PM10-Belastung in Xingbin ist in der Regel in: Juni (32).
Wie hoch ist der aktuelle PM2,5-Wert in Xingbin? (Feinstaub (PM2,5))
Die heutige PM2.5-Stufe ist:
2 (gut)
Zum Vergleich: Der höchste PM2,5-Wert in Xingbin in den letzten 7 Tagen war: 24 (Freitag, 27. Mai 2022) und der niedrigste: 24 (Freitag, 27. Mai 2022).
Die höchsten PM2,5-Werte wurden gemessen: 62 (Januar 2019).
Die niedrigste Feinstaubbelastung PM2,5 tritt im Monat auf: Juni (18).
Wie hoch ist der CO-Gehalt? (Kohlenmonoxid (CO))
100 (gut)
Wie hoch ist das NO2-Niveau? (Stickstoffdioxid (NO2))
8 (gut)
Wie ist das O3-Niveau heute in Xingbin? (Ozon (O3))
0 (gut)
Wie hoch ist die SO2-Belastung? (Schwefeldioxid (SO2))
9 (gut)
Aktuelle Daten Freitag, 27. Mai 2022, 12:00
PM10 7 (gut)
PM2,5 2 (gut)
CO 100 (gut)
NO2 8 (gut)
O3 0 (gut)
SO2 9 (gut)
Daten zur Luftverschmutzung der letzten Tage in Xingbin
index
2022-05-27
pm10
32
Moderate
pm25
24
Moderate
co
468
Good
no2
21
Good
o3
32
Good
so2
5
Good
data source »
Luftverschmutzung in Xingbin von Oktober 2018 bis Mai 2020
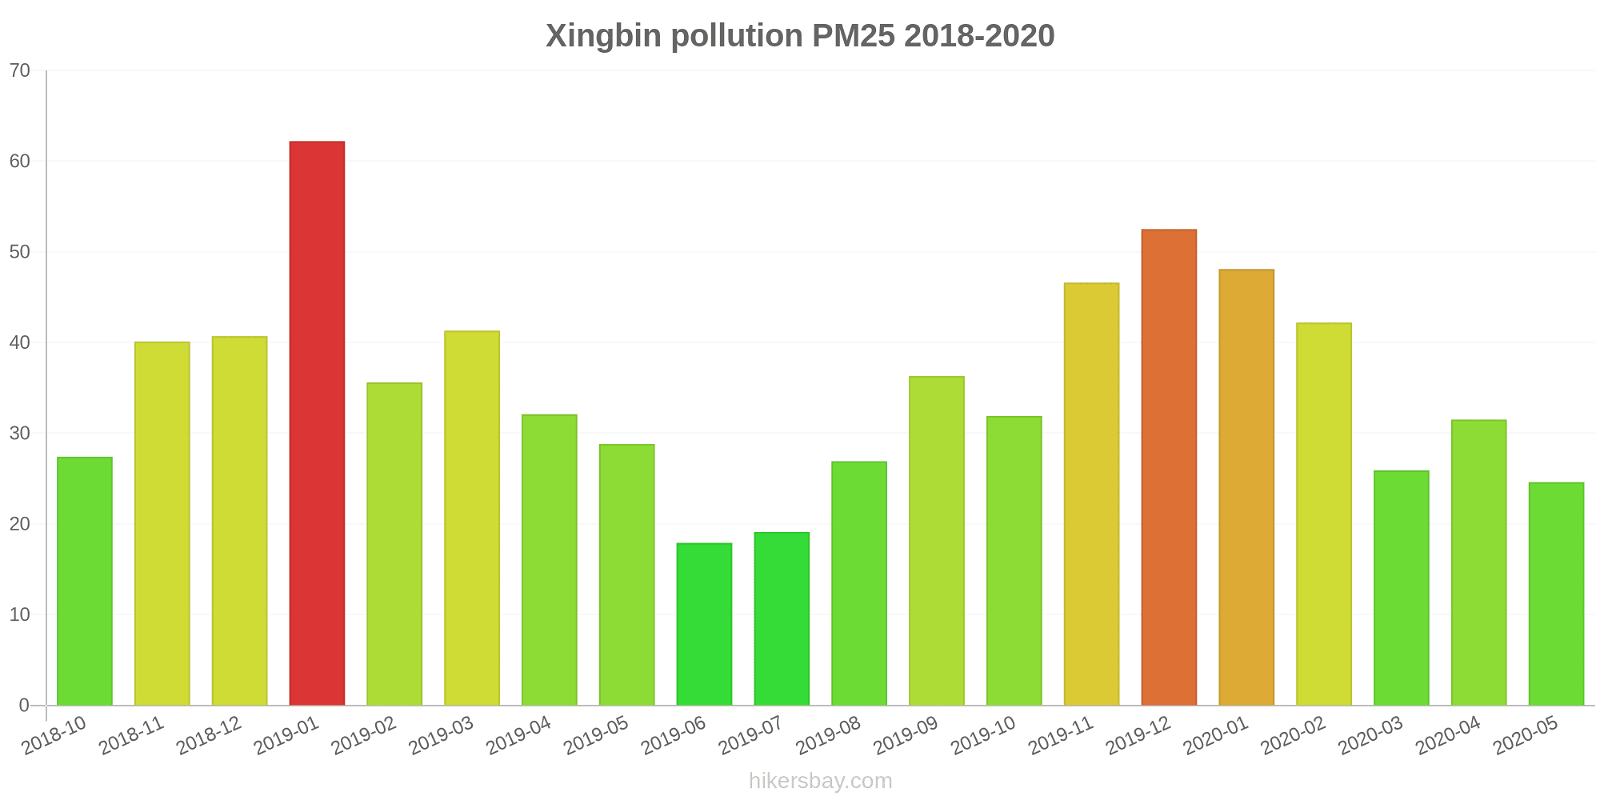
index
2020-05
2020-04
2020-03
2020-02
2020-01
2019-12
2019-11
2019-10
2019-09
2019-08
2019-07
2019-06
2019-05
2019-04
2019-03
2019-02
2019-01
2018-12
2018-11
2018-10
pm25
25 (Moderate)
32 (Moderate)
26 (Moderate)
42 (Unhealthy for Sensitive Groups)
48 (Unhealthy for Sensitive Groups)
53 (Unhealthy for Sensitive Groups)
47 (Unhealthy for Sensitive Groups)
32 (Moderate)
36 (Unhealthy for Sensitive Groups)
27 (Moderate)
19 (Moderate)
18 (Moderate)
29 (Moderate)
32 (Moderate)
41 (Unhealthy for Sensitive Groups)
36 (Unhealthy for Sensitive Groups)
62 (Unhealthy)
41 (Unhealthy for Sensitive Groups)
40 (Unhealthy for Sensitive Groups)
27 (Moderate)
co
670 (Good)
812 (Good)
799 (Good)
757 (Good)
1 (Good)
1 (Good)
865 (Good)
899 (Good)
826 (Good)
867 (Good)
760 (Good)
778 (Good)
763 (Good)
828 (Good)
950 (Good)
991 (Good)
1 (Good)
876 (Good)
930 (Good)
850 (Good)
no2
11 (Good)
20 (Good)
18 (Good)
16 (Good)
23 (Good)
34 (Good)
23 (Good)
15 (Good)
17 (Good)
14 (Good)
13 (Good)
12 (Good)
12 (Good)
15 (Good)
20 (Good)
14 (Good)
26 (Good)
25 (Good)
29 (Good)
25 (Good)
o3
112 (Moderate)
102 (Moderate)
70 (Moderate)
77 (Moderate)
77 (Moderate)
94 (Moderate)
130 (Unhealthy for Sensitive Groups)
116 (Moderate)
168 (Unhealthy)
124 (Unhealthy for Sensitive Groups)
97 (Moderate)
103 (Moderate)
100 (Moderate)
88 (Moderate)
72 (Moderate)
55 (Good)
64 (Good)
47 (Good)
85 (Moderate)
83 (Moderate)
pm10
48 (Moderate)
54 (Unhealthy for Sensitive Groups)
40 (Moderate)
53 (Unhealthy for Sensitive Groups)
65 (Unhealthy for Sensitive Groups)
82 (Unhealthy)
75 (Unhealthy for Sensitive Groups)
53 (Unhealthy for Sensitive Groups)
63 (Unhealthy for Sensitive Groups)
44 (Moderate)
34 (Moderate)
32 (Moderate)
52 (Unhealthy for Sensitive Groups)
53 (Unhealthy for Sensitive Groups)
59 (Unhealthy for Sensitive Groups)
46 (Moderate)
77 (Unhealthy for Sensitive Groups)
59 (Unhealthy for Sensitive Groups)
67 (Unhealthy for Sensitive Groups)
54 (Unhealthy for Sensitive Groups)
so2
11 (Good)
11 (Good)
9.1 (Good)
7.8 (Good)
13 (Good)
17 (Good)
17 (Good)
13 (Good)
14 (Good)
13 (Good)
14 (Good)
13 (Good)
11 (Good)
9.8 (Good)
10 (Good)
7.8 (Good)
11 (Good)
11 (Good)
13 (Good)
11 (Good)
data source »
来冶招待所
Freitag, 27. Mai 2022, 12:00
PM10 6.7 (gut)
Feinstaub (PM10) Schwebestaub
PM2,5 1.7 (gut)
Feinstaub (PM2,5)
CO 100 (gut)
Kohlenmonoxid (CO)
NO2 7.6 (gut)
Stickstoffdioxid (NO2)
O3 0.02 (gut)
Ozon (O3)
SO2 8.6 (gut)
Schwefeldioxid (SO2)
来冶招待所
index
2022-05-27
pm10
32
pm25
24
co
468
no2
21
o3
32
so2
4.6
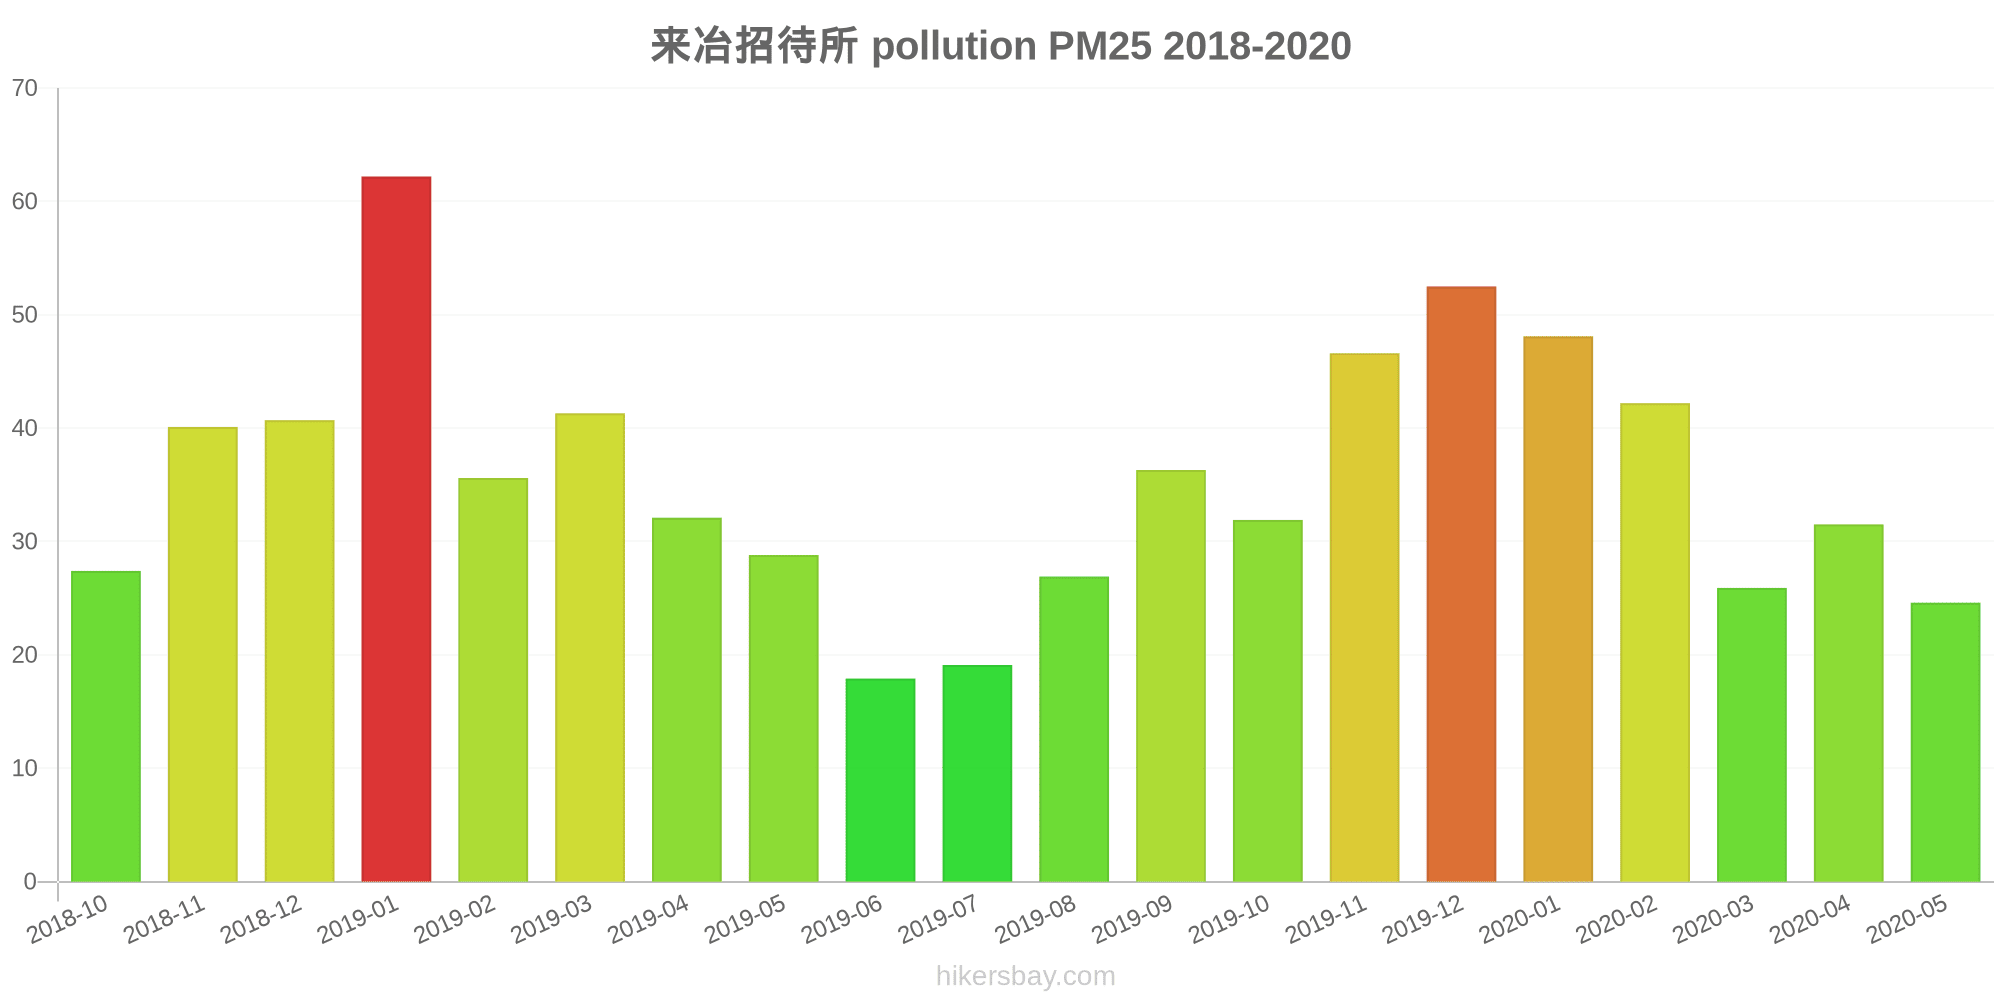
来冶招待所
2018-10 2020-05

index
2020-05
2020-04
2020-03
2020-02
2020-01
2019-12
2019-11
2019-10
2019-09
2019-08
2019-07
2019-06
2019-05
2019-04
2019-03
2019-02
2019-01
2018-12
2018-11
2018-10
pm25
25
32
26
42
48
53
47
32
36
27
19
18
29
32
41
36
62
41
40
27
co
670
812
799
757
1
1
865
899
826
867
760
778
763
828
950
991
1
876
930
850
no2
11
20
18
16
23
34
23
15
17
14
13
12
12
15
20
14
26
25
29
25
o3
112
102
70
77
77
94
130
116
168
124
97
103
100
88
72
55
64
47
85
83
pm10
48
54
40
53
65
82
75
53
63
44
34
32
52
53
59
46
77
59
67
54
so2
11
11
9.1
7.8
13
17
17
13
14
13
14
13
11
9.8
10
7.8
11
11
13
11
* Pollution data source:
https://openaq.org
(ChinaAQIData)
The data is licensed under CC-By 4.0
PM10 7 (gut)
PM2,5 2 (gut)
CO 100 (gut)
NO2 8 (gut)
O3 0 (gut)
SO2 9 (gut)
Daten zur Luftverschmutzung der letzten Tage in Xingbin
| index | 2022-05-27 |
|---|---|
| pm10 | 32 Moderate |
| pm25 | 24 Moderate |
| co | 468 Good |
| no2 | 21 Good |
| o3 | 32 Good |
| so2 | 5 Good |
| index | 2020-05 | 2020-04 | 2020-03 | 2020-02 | 2020-01 | 2019-12 | 2019-11 | 2019-10 | 2019-09 | 2019-08 | 2019-07 | 2019-06 | 2019-05 | 2019-04 | 2019-03 | 2019-02 | 2019-01 | 2018-12 | 2018-11 | 2018-10 |
|---|---|---|---|---|---|---|---|---|---|---|---|---|---|---|---|---|---|---|---|---|
| pm25 | 25 (Moderate) | 32 (Moderate) | 26 (Moderate) | 42 (Unhealthy for Sensitive Groups) | 48 (Unhealthy for Sensitive Groups) | 53 (Unhealthy for Sensitive Groups) | 47 (Unhealthy for Sensitive Groups) | 32 (Moderate) | 36 (Unhealthy for Sensitive Groups) | 27 (Moderate) | 19 (Moderate) | 18 (Moderate) | 29 (Moderate) | 32 (Moderate) | 41 (Unhealthy for Sensitive Groups) | 36 (Unhealthy for Sensitive Groups) | 62 (Unhealthy) | 41 (Unhealthy for Sensitive Groups) | 40 (Unhealthy for Sensitive Groups) | 27 (Moderate) |
| co | 670 (Good) | 812 (Good) | 799 (Good) | 757 (Good) | 1 (Good) | 1 (Good) | 865 (Good) | 899 (Good) | 826 (Good) | 867 (Good) | 760 (Good) | 778 (Good) | 763 (Good) | 828 (Good) | 950 (Good) | 991 (Good) | 1 (Good) | 876 (Good) | 930 (Good) | 850 (Good) |
| no2 | 11 (Good) | 20 (Good) | 18 (Good) | 16 (Good) | 23 (Good) | 34 (Good) | 23 (Good) | 15 (Good) | 17 (Good) | 14 (Good) | 13 (Good) | 12 (Good) | 12 (Good) | 15 (Good) | 20 (Good) | 14 (Good) | 26 (Good) | 25 (Good) | 29 (Good) | 25 (Good) |
| o3 | 112 (Moderate) | 102 (Moderate) | 70 (Moderate) | 77 (Moderate) | 77 (Moderate) | 94 (Moderate) | 130 (Unhealthy for Sensitive Groups) | 116 (Moderate) | 168 (Unhealthy) | 124 (Unhealthy for Sensitive Groups) | 97 (Moderate) | 103 (Moderate) | 100 (Moderate) | 88 (Moderate) | 72 (Moderate) | 55 (Good) | 64 (Good) | 47 (Good) | 85 (Moderate) | 83 (Moderate) |
| pm10 | 48 (Moderate) | 54 (Unhealthy for Sensitive Groups) | 40 (Moderate) | 53 (Unhealthy for Sensitive Groups) | 65 (Unhealthy for Sensitive Groups) | 82 (Unhealthy) | 75 (Unhealthy for Sensitive Groups) | 53 (Unhealthy for Sensitive Groups) | 63 (Unhealthy for Sensitive Groups) | 44 (Moderate) | 34 (Moderate) | 32 (Moderate) | 52 (Unhealthy for Sensitive Groups) | 53 (Unhealthy for Sensitive Groups) | 59 (Unhealthy for Sensitive Groups) | 46 (Moderate) | 77 (Unhealthy for Sensitive Groups) | 59 (Unhealthy for Sensitive Groups) | 67 (Unhealthy for Sensitive Groups) | 54 (Unhealthy for Sensitive Groups) |
| so2 | 11 (Good) | 11 (Good) | 9.1 (Good) | 7.8 (Good) | 13 (Good) | 17 (Good) | 17 (Good) | 13 (Good) | 14 (Good) | 13 (Good) | 14 (Good) | 13 (Good) | 11 (Good) | 9.8 (Good) | 10 (Good) | 7.8 (Good) | 11 (Good) | 11 (Good) | 13 (Good) | 11 (Good) |
PM10 6.7 (gut)
Feinstaub (PM10) SchwebestaubPM2,5 1.7 (gut)
Feinstaub (PM2,5)CO 100 (gut)
Kohlenmonoxid (CO)NO2 7.6 (gut)
Stickstoffdioxid (NO2)O3 0.02 (gut)
Ozon (O3)SO2 8.6 (gut)
Schwefeldioxid (SO2)来冶招待所
| index | 2022-05-27 |
|---|---|
| pm10 | 32 |
| pm25 | 24 |
| co | 468 |
| no2 | 21 |
| o3 | 32 |
| so2 | 4.6 |
来冶招待所
| index | 2020-05 | 2020-04 | 2020-03 | 2020-02 | 2020-01 | 2019-12 | 2019-11 | 2019-10 | 2019-09 | 2019-08 | 2019-07 | 2019-06 | 2019-05 | 2019-04 | 2019-03 | 2019-02 | 2019-01 | 2018-12 | 2018-11 | 2018-10 |
|---|---|---|---|---|---|---|---|---|---|---|---|---|---|---|---|---|---|---|---|---|
| pm25 | 25 | 32 | 26 | 42 | 48 | 53 | 47 | 32 | 36 | 27 | 19 | 18 | 29 | 32 | 41 | 36 | 62 | 41 | 40 | 27 |
| co | 670 | 812 | 799 | 757 | 1 | 1 | 865 | 899 | 826 | 867 | 760 | 778 | 763 | 828 | 950 | 991 | 1 | 876 | 930 | 850 |
| no2 | 11 | 20 | 18 | 16 | 23 | 34 | 23 | 15 | 17 | 14 | 13 | 12 | 12 | 15 | 20 | 14 | 26 | 25 | 29 | 25 |
| o3 | 112 | 102 | 70 | 77 | 77 | 94 | 130 | 116 | 168 | 124 | 97 | 103 | 100 | 88 | 72 | 55 | 64 | 47 | 85 | 83 |
| pm10 | 48 | 54 | 40 | 53 | 65 | 82 | 75 | 53 | 63 | 44 | 34 | 32 | 52 | 53 | 59 | 46 | 77 | 59 | 67 | 54 |
| so2 | 11 | 11 | 9.1 | 7.8 | 13 | 17 | 17 | 13 | 14 | 13 | 14 | 13 | 11 | 9.8 | 10 | 7.8 | 11 | 11 | 13 | 11 |