Luftverschmutzung in Zhangjialong: Echtzeit-Luft-Qualitätsindex und Smog-Alarm.
Für die Zhangjialong. Heute ist Donnerstag, 4. Juni 2026. Für Zhangjialong wurden folgende Luftverschmutzungswerte gemessen:- Feinstaub (PM10) Schwebestaub - 179 (Sehr schlecht Gefährlich)
- Feinstaub (PM2,5) - 35 (Ungesund für sensible Gruppen)
- Ozon (O3) - 0 (gut)
- Stickstoffdioxid (NO2) - 0 (gut)
- Schwefeldioxid (SO2) - 0 (gut)

Wie ist die Luftqualität Zhangjialong heute? Ist die Luft in Zhangjialong? verschmutzt. Gibt es Smog?
Wie hoch ist der PM10-Stand heute in Zhangjialong? (Feinstaub (PM10) Schwebestaub)
Der aktuelle Feinstaubgehalt PM10 in Zhangjialong is:
179 (Sehr schlecht Gefährlich)
Die höchsten PM10-Werte treten in der Regel im Monat auf: 110 (Januar 2019).
Der niedrigste Wert der Feinstaub-PM10-Belastung in Zhangjialong ist in der Regel in: Juli (43).
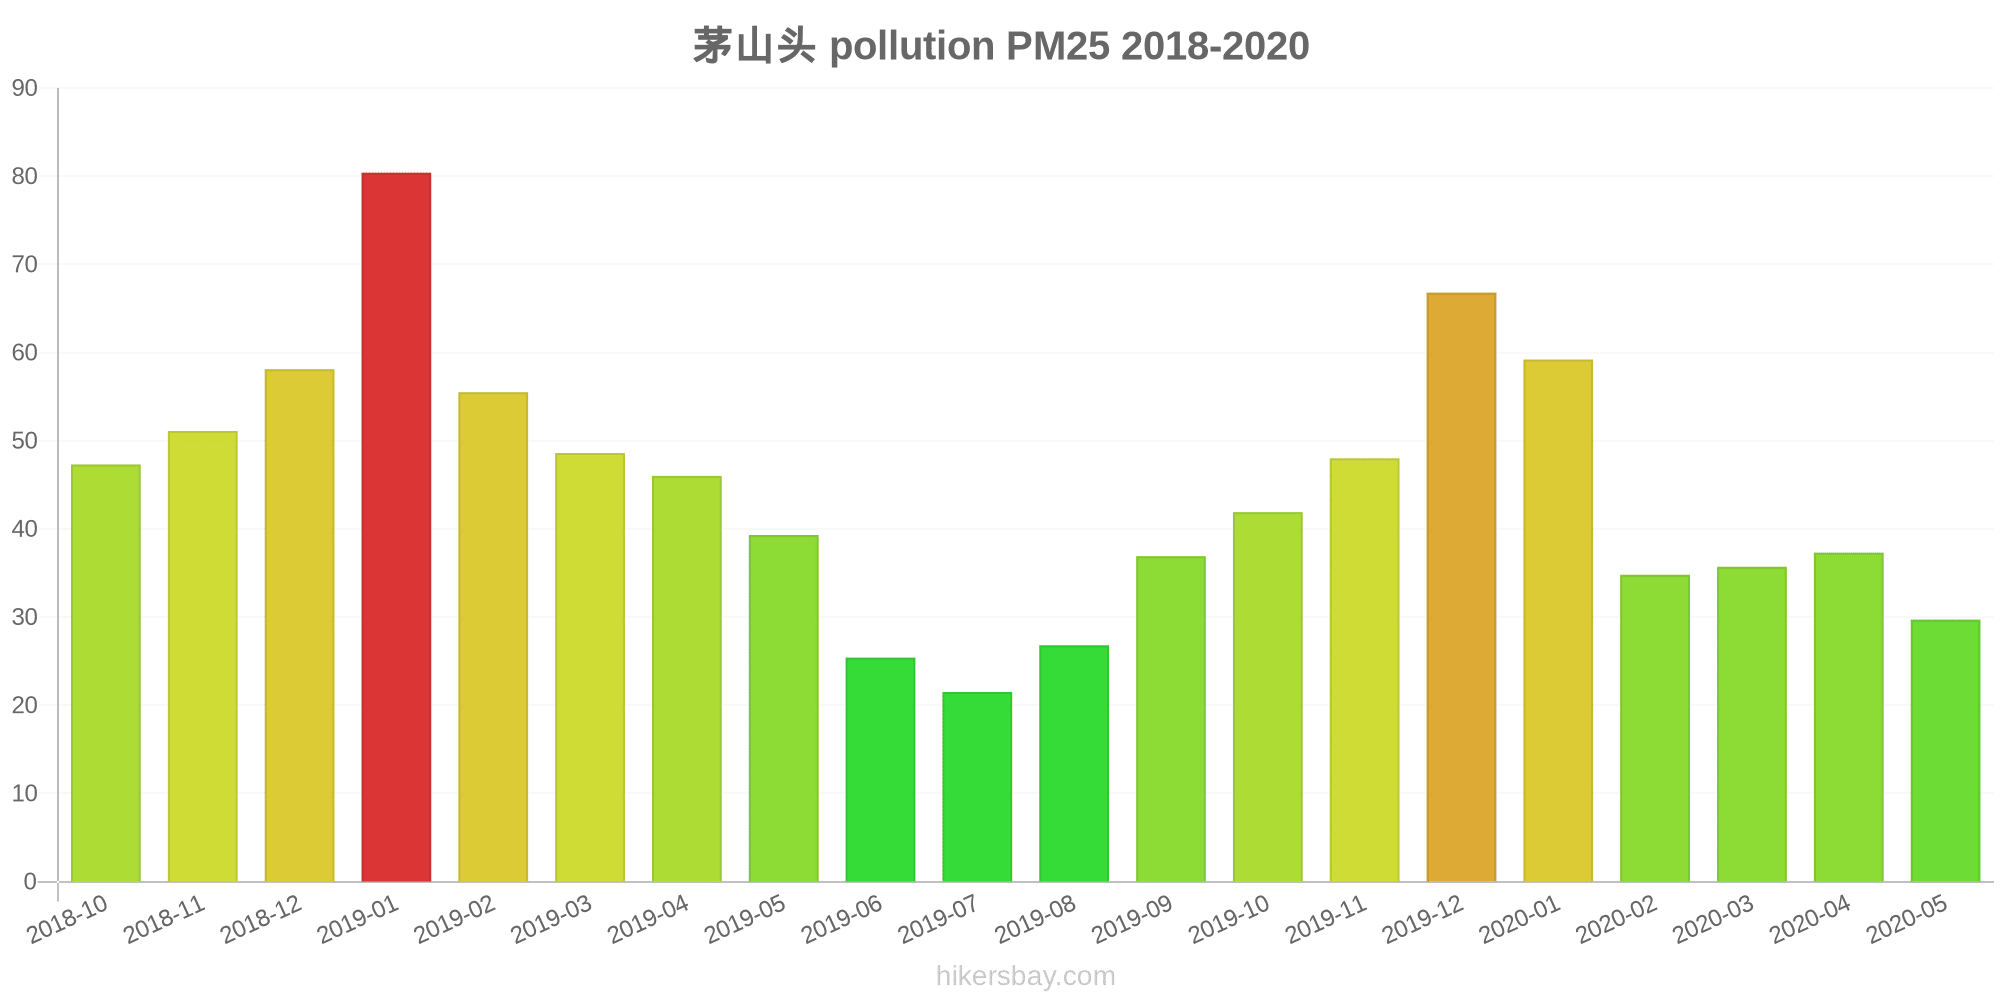
Wie hoch ist der aktuelle PM2,5-Wert in Zhangjialong? (Feinstaub (PM2,5))
Die heutige PM2.5-Stufe ist:
35 (Ungesund für sensible Gruppen)
Zum Vergleich: Der höchste PM2,5-Wert in Zhangjialong in den letzten 7 Tagen war: 56 (Freitag, 27. Mai 2022) und der niedrigste: 56 (Freitag, 27. Mai 2022).
Die höchsten PM2,5-Werte wurden gemessen: 80 (Januar 2019).
Die niedrigste Feinstaubbelastung PM2,5 tritt im Monat auf: Juli (22).
Wie ist das O3-Niveau heute in Zhangjialong? (Ozon (O3))
0 (gut)
Wie hoch ist das NO2-Niveau? (Stickstoffdioxid (NO2))
0 (gut)
Wie hoch ist die SO2-Belastung? (Schwefeldioxid (SO2))
0 (gut)
Aktuelle Daten Freitag, 27. Mai 2022, 12:00
PM10 179 (Sehr schlecht Gefährlich)
PM2,5 35 (Ungesund für sensible Gruppen)
O3 0 (gut)
NO2 0 (gut)
SO2 0 (gut)
Daten zur Luftverschmutzung der letzten Tage in Zhangjialong
index
2022-05-27
pm10
56
Unhealthy for Sensitive Groups
pm25
56
Unhealthy
o3
0
Good
no2
0
Good
so2
0
Good
data source »
Luftverschmutzung in Zhangjialong von Oktober 2018 bis Mai 2020

index
2020-05
2020-04
2020-03
2020-02
2020-01
2019-12
2019-11
2019-10
2019-09
2019-08
2019-07
2019-06
2019-05
2019-04
2019-03
2019-02
2019-01
2018-12
2018-11
2018-10
pm25
30 (Moderate)
37 (Unhealthy for Sensitive Groups)
36 (Unhealthy for Sensitive Groups)
35 (Moderate)
59 (Unhealthy)
67 (Unhealthy)
48 (Unhealthy for Sensitive Groups)
42 (Unhealthy for Sensitive Groups)
37 (Unhealthy for Sensitive Groups)
27 (Moderate)
22 (Moderate)
25 (Moderate)
39 (Unhealthy for Sensitive Groups)
46 (Unhealthy for Sensitive Groups)
49 (Unhealthy for Sensitive Groups)
56 (Unhealthy)
80 (Very Unhealthy)
58 (Unhealthy)
51 (Unhealthy for Sensitive Groups)
47 (Unhealthy for Sensitive Groups)
co
648 (Good)
619 (Good)
485 (Good)
582 (Good)
774 (Good)
837 (Good)
695 (Good)
613 (Good)
632 (Good)
706 (Good)
466 (Good)
429 (Good)
543 (Good)
581 (Good)
530 (Good)
706 (Good)
731 (Good)
848 (Good)
824 (Good)
826 (Good)
no2
27 (Good)
39 (Good)
30 (Good)
17 (Good)
29 (Good)
49 (Moderate)
47 (Moderate)
36 (Good)
22 (Good)
18 (Good)
20 (Good)
25 (Good)
33 (Good)
36 (Good)
39 (Good)
28 (Good)
45 (Moderate)
33 (Good)
39 (Good)
48 (Moderate)
o3
128 (Unhealthy for Sensitive Groups)
135 (Unhealthy for Sensitive Groups)
88 (Moderate)
82 (Moderate)
55 (Good)
62 (Good)
101 (Moderate)
126 (Unhealthy for Sensitive Groups)
162 (Unhealthy)
162 (Unhealthy)
126 (Unhealthy for Sensitive Groups)
146 (Unhealthy for Sensitive Groups)
114 (Moderate)
89 (Moderate)
88 (Moderate)
56 (Good)
54 (Good)
53 (Good)
73 (Moderate)
108 (Moderate)
pm10
59 (Unhealthy for Sensitive Groups)
70 (Unhealthy for Sensitive Groups)
59 (Unhealthy for Sensitive Groups)
44 (Moderate)
65 (Unhealthy for Sensitive Groups)
75 (Unhealthy for Sensitive Groups)
76 (Unhealthy for Sensitive Groups)
69 (Unhealthy for Sensitive Groups)
55 (Unhealthy for Sensitive Groups)
49 (Moderate)
43 (Moderate)
43 (Moderate)
68 (Unhealthy for Sensitive Groups)
66 (Unhealthy for Sensitive Groups)
79 (Unhealthy for Sensitive Groups)
67 (Unhealthy for Sensitive Groups)
110 (Very Unhealthy)
76 (Unhealthy for Sensitive Groups)
75 (Unhealthy for Sensitive Groups)
92 (Unhealthy)
so2
11 (Good)
11 (Good)
9.4 (Good)
8.9 (Good)
9 (Good)
10 (Good)
12 (Good)
12 (Good)
10 (Good)
9.8 (Good)
9.2 (Good)
9.5 (Good)
11 (Good)
10 (Good)
9.9 (Good)
9.7 (Good)
11 (Good)
11 (Good)
11 (Good)
15 (Good)
data source »
茅山头
Freitag, 27. Mai 2022, 12:00
PM10 179 (Sehr schlecht Gefährlich)
Feinstaub (PM10) Schwebestaub
PM2,5 35 (Ungesund für sensible Gruppen)
Feinstaub (PM2,5)
O3 0.04 (gut)
Ozon (O3)
NO2 0 (gut)
Stickstoffdioxid (NO2)
SO2 0 (gut)
Schwefeldioxid (SO2)
茅山头
index
2022-05-27
pm10
56
pm25
56
o3
0.03
no2
0
so2
0
茅山头
2018-10 2020-05

index
2020-05
2020-04
2020-03
2020-02
2020-01
2019-12
2019-11
2019-10
2019-09
2019-08
2019-07
2019-06
2019-05
2019-04
2019-03
2019-02
2019-01
2018-12
2018-11
2018-10
pm25
30
37
36
35
59
67
48
42
37
27
22
25
39
46
49
56
80
58
51
47
co
648
619
485
582
774
837
695
613
632
706
466
429
543
581
530
706
731
848
824
826
no2
27
39
30
17
29
49
47
36
22
18
20
25
33
36
39
28
45
33
39
48
o3
128
135
88
82
55
62
101
126
162
162
126
146
114
89
88
56
54
53
73
108
pm10
59
70
59
44
65
75
76
69
55
49
43
43
68
66
79
67
110
76
75
92
so2
11
11
9.4
8.9
9
10
12
12
10
9.8
9.2
9.5
11
10
9.9
9.7
11
11
11
15
* Pollution data source:
https://openaq.org
(ChinaAQIData)
The data is licensed under CC-By 4.0
PM10 179 (Sehr schlecht Gefährlich)
PM2,5 35 (Ungesund für sensible Gruppen)
O3 0 (gut)
NO2 0 (gut)
SO2 0 (gut)
Daten zur Luftverschmutzung der letzten Tage in Zhangjialong
| index | 2022-05-27 |
|---|---|
| pm10 | 56 Unhealthy for Sensitive Groups |
| pm25 | 56 Unhealthy |
| o3 | 0 Good |
| no2 | 0 Good |
| so2 | 0 Good |

| index | 2020-05 | 2020-04 | 2020-03 | 2020-02 | 2020-01 | 2019-12 | 2019-11 | 2019-10 | 2019-09 | 2019-08 | 2019-07 | 2019-06 | 2019-05 | 2019-04 | 2019-03 | 2019-02 | 2019-01 | 2018-12 | 2018-11 | 2018-10 |
|---|---|---|---|---|---|---|---|---|---|---|---|---|---|---|---|---|---|---|---|---|
| pm25 | 30 (Moderate) | 37 (Unhealthy for Sensitive Groups) | 36 (Unhealthy for Sensitive Groups) | 35 (Moderate) | 59 (Unhealthy) | 67 (Unhealthy) | 48 (Unhealthy for Sensitive Groups) | 42 (Unhealthy for Sensitive Groups) | 37 (Unhealthy for Sensitive Groups) | 27 (Moderate) | 22 (Moderate) | 25 (Moderate) | 39 (Unhealthy for Sensitive Groups) | 46 (Unhealthy for Sensitive Groups) | 49 (Unhealthy for Sensitive Groups) | 56 (Unhealthy) | 80 (Very Unhealthy) | 58 (Unhealthy) | 51 (Unhealthy for Sensitive Groups) | 47 (Unhealthy for Sensitive Groups) |
| co | 648 (Good) | 619 (Good) | 485 (Good) | 582 (Good) | 774 (Good) | 837 (Good) | 695 (Good) | 613 (Good) | 632 (Good) | 706 (Good) | 466 (Good) | 429 (Good) | 543 (Good) | 581 (Good) | 530 (Good) | 706 (Good) | 731 (Good) | 848 (Good) | 824 (Good) | 826 (Good) |
| no2 | 27 (Good) | 39 (Good) | 30 (Good) | 17 (Good) | 29 (Good) | 49 (Moderate) | 47 (Moderate) | 36 (Good) | 22 (Good) | 18 (Good) | 20 (Good) | 25 (Good) | 33 (Good) | 36 (Good) | 39 (Good) | 28 (Good) | 45 (Moderate) | 33 (Good) | 39 (Good) | 48 (Moderate) |
| o3 | 128 (Unhealthy for Sensitive Groups) | 135 (Unhealthy for Sensitive Groups) | 88 (Moderate) | 82 (Moderate) | 55 (Good) | 62 (Good) | 101 (Moderate) | 126 (Unhealthy for Sensitive Groups) | 162 (Unhealthy) | 162 (Unhealthy) | 126 (Unhealthy for Sensitive Groups) | 146 (Unhealthy for Sensitive Groups) | 114 (Moderate) | 89 (Moderate) | 88 (Moderate) | 56 (Good) | 54 (Good) | 53 (Good) | 73 (Moderate) | 108 (Moderate) |
| pm10 | 59 (Unhealthy for Sensitive Groups) | 70 (Unhealthy for Sensitive Groups) | 59 (Unhealthy for Sensitive Groups) | 44 (Moderate) | 65 (Unhealthy for Sensitive Groups) | 75 (Unhealthy for Sensitive Groups) | 76 (Unhealthy for Sensitive Groups) | 69 (Unhealthy for Sensitive Groups) | 55 (Unhealthy for Sensitive Groups) | 49 (Moderate) | 43 (Moderate) | 43 (Moderate) | 68 (Unhealthy for Sensitive Groups) | 66 (Unhealthy for Sensitive Groups) | 79 (Unhealthy for Sensitive Groups) | 67 (Unhealthy for Sensitive Groups) | 110 (Very Unhealthy) | 76 (Unhealthy for Sensitive Groups) | 75 (Unhealthy for Sensitive Groups) | 92 (Unhealthy) |
| so2 | 11 (Good) | 11 (Good) | 9.4 (Good) | 8.9 (Good) | 9 (Good) | 10 (Good) | 12 (Good) | 12 (Good) | 10 (Good) | 9.8 (Good) | 9.2 (Good) | 9.5 (Good) | 11 (Good) | 10 (Good) | 9.9 (Good) | 9.7 (Good) | 11 (Good) | 11 (Good) | 11 (Good) | 15 (Good) |
PM10 179 (Sehr schlecht Gefährlich)
Feinstaub (PM10) SchwebestaubPM2,5 35 (Ungesund für sensible Gruppen)
Feinstaub (PM2,5)O3 0.04 (gut)
Ozon (O3)NO2 0 (gut)
Stickstoffdioxid (NO2)SO2 0 (gut)
Schwefeldioxid (SO2)茅山头
| index | 2022-05-27 |
|---|---|
| pm10 | 56 |
| pm25 | 56 |
| o3 | 0.03 |
| no2 | 0 |
| so2 | 0 |
茅山头
| index | 2020-05 | 2020-04 | 2020-03 | 2020-02 | 2020-01 | 2019-12 | 2019-11 | 2019-10 | 2019-09 | 2019-08 | 2019-07 | 2019-06 | 2019-05 | 2019-04 | 2019-03 | 2019-02 | 2019-01 | 2018-12 | 2018-11 | 2018-10 |
|---|---|---|---|---|---|---|---|---|---|---|---|---|---|---|---|---|---|---|---|---|
| pm25 | 30 | 37 | 36 | 35 | 59 | 67 | 48 | 42 | 37 | 27 | 22 | 25 | 39 | 46 | 49 | 56 | 80 | 58 | 51 | 47 |
| co | 648 | 619 | 485 | 582 | 774 | 837 | 695 | 613 | 632 | 706 | 466 | 429 | 543 | 581 | 530 | 706 | 731 | 848 | 824 | 826 |
| no2 | 27 | 39 | 30 | 17 | 29 | 49 | 47 | 36 | 22 | 18 | 20 | 25 | 33 | 36 | 39 | 28 | 45 | 33 | 39 | 48 |
| o3 | 128 | 135 | 88 | 82 | 55 | 62 | 101 | 126 | 162 | 162 | 126 | 146 | 114 | 89 | 88 | 56 | 54 | 53 | 73 | 108 |
| pm10 | 59 | 70 | 59 | 44 | 65 | 75 | 76 | 69 | 55 | 49 | 43 | 43 | 68 | 66 | 79 | 67 | 110 | 76 | 75 | 92 |
| so2 | 11 | 11 | 9.4 | 8.9 | 9 | 10 | 12 | 12 | 10 | 9.8 | 9.2 | 9.5 | 11 | 10 | 9.9 | 9.7 | 11 | 11 | 11 | 15 |