Luftverschmutzung in Hetang: Echtzeit-Luft-Qualitätsindex und Smog-Alarm.
Für die Hetang. Heute ist Donnerstag, 4. Juni 2026. Für Hetang wurden folgende Luftverschmutzungswerte gemessen:- Feinstaub (PM10) Schwebestaub - 7 (gut)
- Feinstaub (PM2,5) - 2 (gut)
- Kohlenmonoxid (CO) - 100 (gut)
- Stickstoffdioxid (NO2) - 8 (gut)
- Ozon (O3) - 0 (gut)
- Schwefeldioxid (SO2) - 9 (gut)

Wie ist die Luftqualität Hetang heute? Ist die Luft in Hetang? verschmutzt. Gibt es Smog?
Wie hoch ist der PM10-Stand heute in Hetang? (Feinstaub (PM10) Schwebestaub)
Der aktuelle Feinstaubgehalt PM10 in Hetang is:
7 (gut)
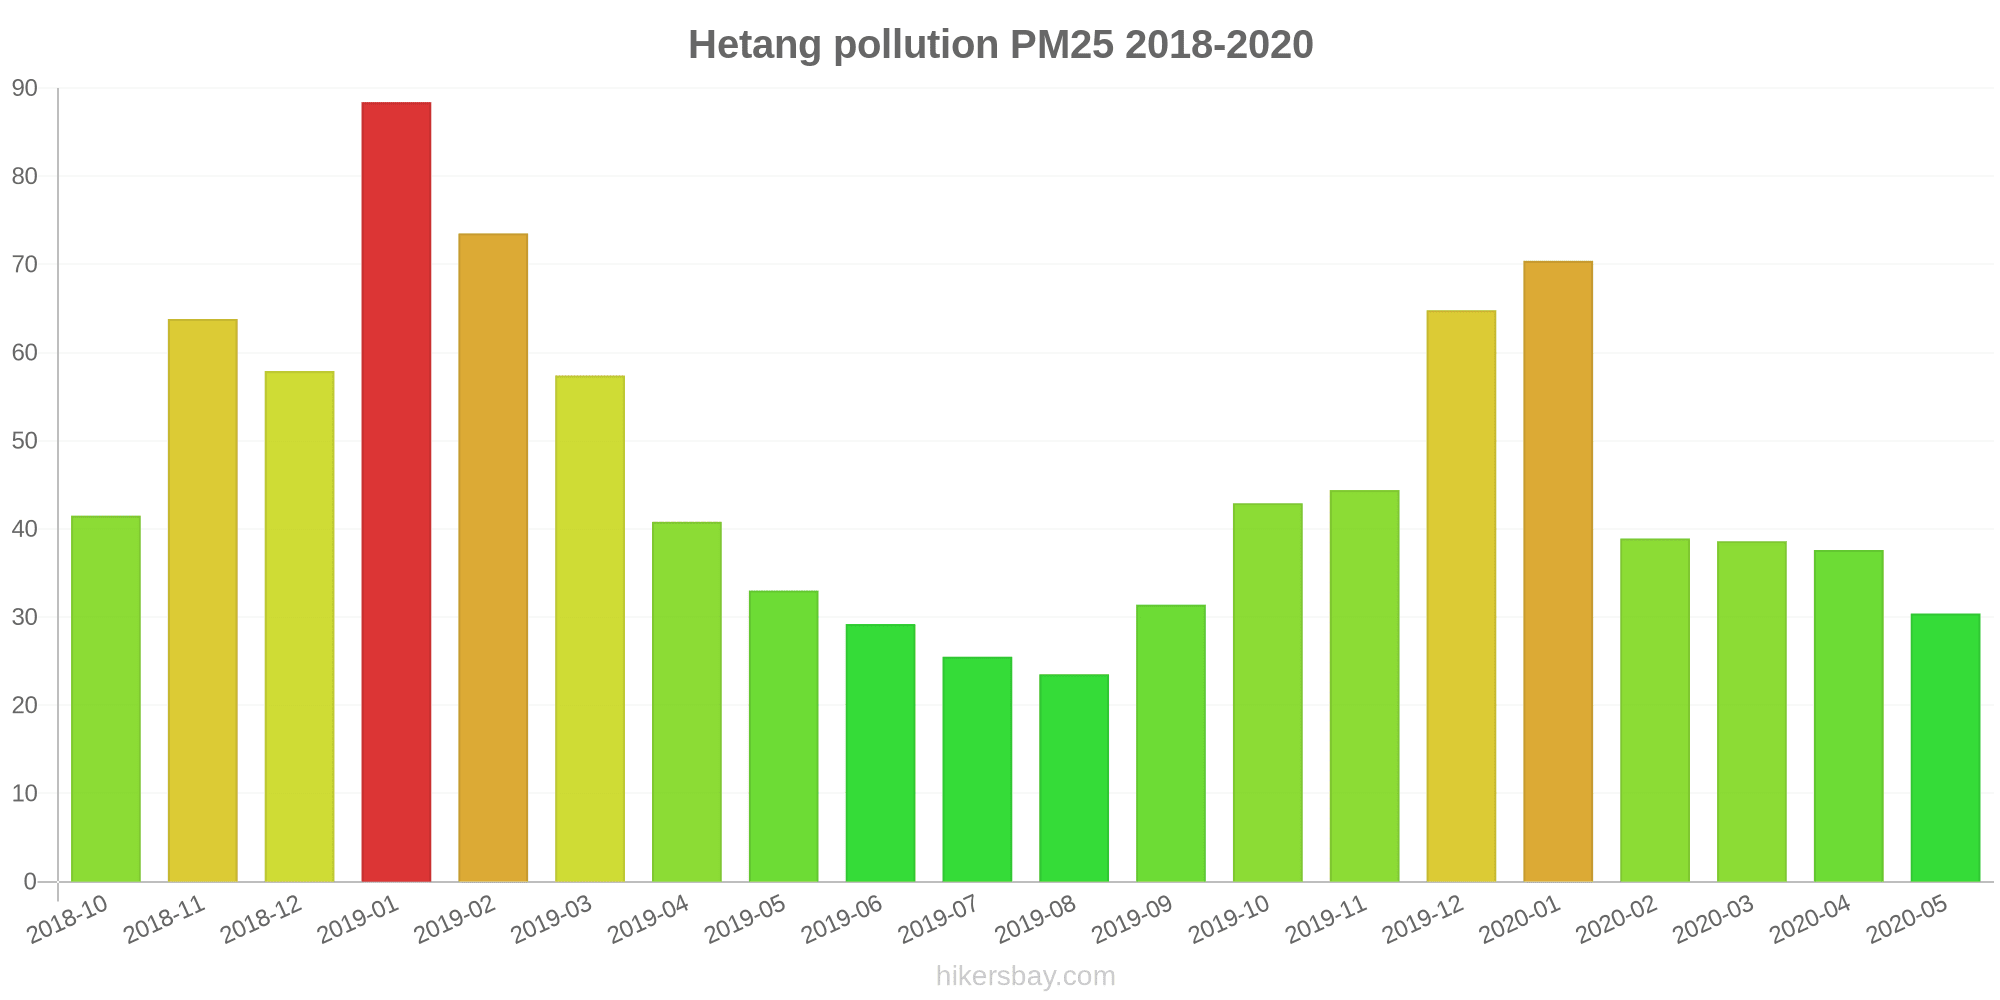
Die höchsten PM10-Werte treten in der Regel im Monat auf: 88 (Januar 2019).
Der niedrigste Wert der Feinstaub-PM10-Belastung in Hetang ist in der Regel in: August (42).
Wie hoch ist der aktuelle PM2,5-Wert in Hetang? (Feinstaub (PM2,5))
Die heutige PM2.5-Stufe ist:
2 (gut)
Zum Vergleich: Der höchste PM2,5-Wert in Hetang in den letzten 7 Tagen war: 24 (Freitag, 27. Mai 2022) und der niedrigste: 24 (Freitag, 27. Mai 2022).
Die höchsten PM2,5-Werte wurden gemessen: 88 (Januar 2019).
Die niedrigste Feinstaubbelastung PM2,5 tritt im Monat auf: August (24).
Wie hoch ist der CO-Gehalt? (Kohlenmonoxid (CO))
100 (gut)
Wie hoch ist das NO2-Niveau? (Stickstoffdioxid (NO2))
8 (gut)
Wie ist das O3-Niveau heute in Hetang? (Ozon (O3))
0 (gut)
Wie hoch ist die SO2-Belastung? (Schwefeldioxid (SO2))
9 (gut)
Aktuelle Daten Freitag, 27. Mai 2022, 12:00
PM10 7 (gut)
PM2,5 2 (gut)
CO 100 (gut)
NO2 8 (gut)
O3 0 (gut)
SO2 9 (gut)
Daten zur Luftverschmutzung der letzten Tage in Hetang
index
2022-05-27
pm10
32
Moderate
pm25
24
Moderate
co
468
Good
no2
21
Good
o3
32
Good
so2
5
Good
data source »
Luftverschmutzung in Hetang von Oktober 2018 bis Mai 2020

index
2020-05
2020-04
2020-03
2020-02
2020-01
2019-12
2019-11
2019-10
2019-09
2019-08
2019-07
2019-06
2019-05
2019-04
2019-03
2019-02
2019-01
2018-12
2018-11
2018-10
pm25
30 (Moderate)
38 (Unhealthy for Sensitive Groups)
39 (Unhealthy for Sensitive Groups)
39 (Unhealthy for Sensitive Groups)
70 (Unhealthy)
65 (Unhealthy)
44 (Unhealthy for Sensitive Groups)
43 (Unhealthy for Sensitive Groups)
31 (Moderate)
24 (Moderate)
26 (Moderate)
29 (Moderate)
33 (Moderate)
41 (Unhealthy for Sensitive Groups)
57 (Unhealthy)
74 (Unhealthy)
88 (Very Unhealthy)
58 (Unhealthy)
64 (Unhealthy)
42 (Unhealthy for Sensitive Groups)
co
984 (Good)
723 (Good)
819 (Good)
700 (Good)
893 (Good)
938 (Good)
877 (Good)
858 (Good)
881 (Good)
865 (Good)
920 (Good)
857 (Good)
727 (Good)
1 (Good)
959 (Good)
952 (Good)
1 (Good)
1 (Good)
1 (Good)
866 (Good)
no2
36 (Good)
42 (Moderate)
37 (Good)
24 (Good)
41 (Moderate)
57 (Moderate)
51 (Moderate)
46 (Moderate)
37 (Good)
20 (Good)
22 (Good)
25 (Good)
39 (Good)
38 (Good)
50 (Moderate)
35 (Good)
53 (Moderate)
46 (Moderate)
45 (Moderate)
43 (Moderate)
o3
134 (Unhealthy for Sensitive Groups)
137 (Unhealthy for Sensitive Groups)
101 (Moderate)
87 (Moderate)
60 (Good)
67 (Good)
103 (Moderate)
122 (Unhealthy for Sensitive Groups)
163 (Unhealthy)
164 (Unhealthy)
156 (Unhealthy)
181 (Very Unhealthy)
161 (Unhealthy)
129 (Unhealthy for Sensitive Groups)
110 (Moderate)
77 (Moderate)
63 (Good)
52 (Good)
93 (Moderate)
120 (Unhealthy for Sensitive Groups)
pm10
56 (Unhealthy for Sensitive Groups)
64 (Unhealthy for Sensitive Groups)
56 (Unhealthy for Sensitive Groups)
44 (Moderate)
60 (Unhealthy for Sensitive Groups)
69 (Unhealthy for Sensitive Groups)
79 (Unhealthy for Sensitive Groups)
83 (Unhealthy)
56 (Unhealthy for Sensitive Groups)
42 (Moderate)
43 (Moderate)
49 (Moderate)
64 (Unhealthy for Sensitive Groups)
65 (Unhealthy for Sensitive Groups)
80 (Unhealthy)
74 (Unhealthy for Sensitive Groups)
88 (Unhealthy)
70 (Unhealthy for Sensitive Groups)
69 (Unhealthy for Sensitive Groups)
68 (Unhealthy for Sensitive Groups)
so2
8.1 (Good)
9.2 (Good)
7.5 (Good)
5.5 (Good)
6.4 (Good)
8.8 (Good)
11 (Good)
12 (Good)
9.8 (Good)
8.7 (Good)
8 (Good)
8.6 (Good)
10 (Good)
11 (Good)
12 (Good)
8 (Good)
12 (Good)
12 (Good)
8.4 (Good)
11 (Good)
data source »
Wuhu Ke Chuang Zhong Xin
Freitag, 27. Mai 2022, 12:00
PM10 6.7 (gut)
Feinstaub (PM10) Schwebestaub
PM2,5 1.7 (gut)
Feinstaub (PM2,5)
CO 100 (gut)
Kohlenmonoxid (CO)
NO2 7.6 (gut)
Stickstoffdioxid (NO2)
O3 0.02 (gut)
Ozon (O3)
SO2 8.6 (gut)
Schwefeldioxid (SO2)
Wuhu Ke Chuang Zhong Xin
index
2022-05-27
pm10
32
pm25
24
co
468
no2
21
o3
32
so2
4.6
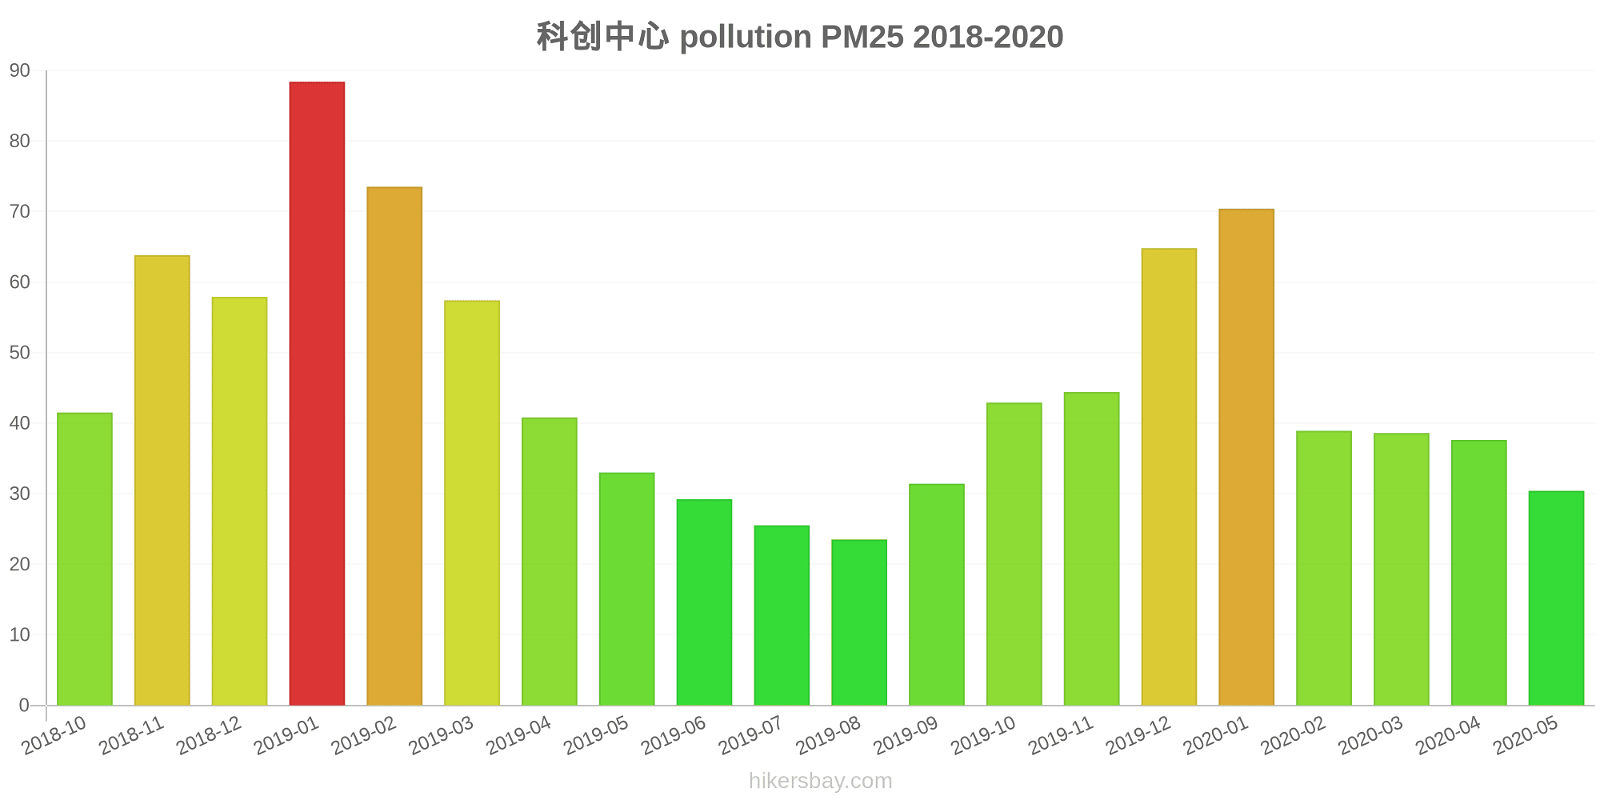
科创中心
2018-10 2020-05
index
2020-05
2020-04
2020-03
2020-02
2020-01
2019-12
2019-11
2019-10
2019-09
2019-08
2019-07
2019-06
2019-05
2019-04
2019-03
2019-02
2019-01
2018-12
2018-11
2018-10
pm25
30
38
39
39
70
65
44
43
31
24
26
29
33
41
57
74
88
58
64
42
co
984
723
819
700
893
938
877
858
881
865
920
857
727
1
959
952
1
1
1
866
no2
36
42
37
24
41
57
51
46
37
20
22
25
39
38
50
35
53
46
45
43
o3
134
137
101
87
60
67
103
122
163
164
156
181
161
129
110
77
63
52
93
120
pm10
56
64
56
44
60
69
79
83
56
42
43
49
64
65
80
74
88
70
69
68
so2
8.1
9.2
7.5
5.5
6.4
8.8
11
12
9.8
8.7
8
8.6
10
11
12
8
12
12
8.4
11
* Pollution data source:
https://openaq.org
(ChinaAQIData)
The data is licensed under CC-By 4.0
PM10 7 (gut)
PM2,5 2 (gut)
CO 100 (gut)
NO2 8 (gut)
O3 0 (gut)
SO2 9 (gut)
Daten zur Luftverschmutzung der letzten Tage in Hetang
| index | 2022-05-27 |
|---|---|
| pm10 | 32 Moderate |
| pm25 | 24 Moderate |
| co | 468 Good |
| no2 | 21 Good |
| o3 | 32 Good |
| so2 | 5 Good |
| index | 2020-05 | 2020-04 | 2020-03 | 2020-02 | 2020-01 | 2019-12 | 2019-11 | 2019-10 | 2019-09 | 2019-08 | 2019-07 | 2019-06 | 2019-05 | 2019-04 | 2019-03 | 2019-02 | 2019-01 | 2018-12 | 2018-11 | 2018-10 |
|---|---|---|---|---|---|---|---|---|---|---|---|---|---|---|---|---|---|---|---|---|
| pm25 | 30 (Moderate) | 38 (Unhealthy for Sensitive Groups) | 39 (Unhealthy for Sensitive Groups) | 39 (Unhealthy for Sensitive Groups) | 70 (Unhealthy) | 65 (Unhealthy) | 44 (Unhealthy for Sensitive Groups) | 43 (Unhealthy for Sensitive Groups) | 31 (Moderate) | 24 (Moderate) | 26 (Moderate) | 29 (Moderate) | 33 (Moderate) | 41 (Unhealthy for Sensitive Groups) | 57 (Unhealthy) | 74 (Unhealthy) | 88 (Very Unhealthy) | 58 (Unhealthy) | 64 (Unhealthy) | 42 (Unhealthy for Sensitive Groups) |
| co | 984 (Good) | 723 (Good) | 819 (Good) | 700 (Good) | 893 (Good) | 938 (Good) | 877 (Good) | 858 (Good) | 881 (Good) | 865 (Good) | 920 (Good) | 857 (Good) | 727 (Good) | 1 (Good) | 959 (Good) | 952 (Good) | 1 (Good) | 1 (Good) | 1 (Good) | 866 (Good) |
| no2 | 36 (Good) | 42 (Moderate) | 37 (Good) | 24 (Good) | 41 (Moderate) | 57 (Moderate) | 51 (Moderate) | 46 (Moderate) | 37 (Good) | 20 (Good) | 22 (Good) | 25 (Good) | 39 (Good) | 38 (Good) | 50 (Moderate) | 35 (Good) | 53 (Moderate) | 46 (Moderate) | 45 (Moderate) | 43 (Moderate) |
| o3 | 134 (Unhealthy for Sensitive Groups) | 137 (Unhealthy for Sensitive Groups) | 101 (Moderate) | 87 (Moderate) | 60 (Good) | 67 (Good) | 103 (Moderate) | 122 (Unhealthy for Sensitive Groups) | 163 (Unhealthy) | 164 (Unhealthy) | 156 (Unhealthy) | 181 (Very Unhealthy) | 161 (Unhealthy) | 129 (Unhealthy for Sensitive Groups) | 110 (Moderate) | 77 (Moderate) | 63 (Good) | 52 (Good) | 93 (Moderate) | 120 (Unhealthy for Sensitive Groups) |
| pm10 | 56 (Unhealthy for Sensitive Groups) | 64 (Unhealthy for Sensitive Groups) | 56 (Unhealthy for Sensitive Groups) | 44 (Moderate) | 60 (Unhealthy for Sensitive Groups) | 69 (Unhealthy for Sensitive Groups) | 79 (Unhealthy for Sensitive Groups) | 83 (Unhealthy) | 56 (Unhealthy for Sensitive Groups) | 42 (Moderate) | 43 (Moderate) | 49 (Moderate) | 64 (Unhealthy for Sensitive Groups) | 65 (Unhealthy for Sensitive Groups) | 80 (Unhealthy) | 74 (Unhealthy for Sensitive Groups) | 88 (Unhealthy) | 70 (Unhealthy for Sensitive Groups) | 69 (Unhealthy for Sensitive Groups) | 68 (Unhealthy for Sensitive Groups) |
| so2 | 8.1 (Good) | 9.2 (Good) | 7.5 (Good) | 5.5 (Good) | 6.4 (Good) | 8.8 (Good) | 11 (Good) | 12 (Good) | 9.8 (Good) | 8.7 (Good) | 8 (Good) | 8.6 (Good) | 10 (Good) | 11 (Good) | 12 (Good) | 8 (Good) | 12 (Good) | 12 (Good) | 8.4 (Good) | 11 (Good) |
PM10 6.7 (gut)
Feinstaub (PM10) SchwebestaubPM2,5 1.7 (gut)
Feinstaub (PM2,5)CO 100 (gut)
Kohlenmonoxid (CO)NO2 7.6 (gut)
Stickstoffdioxid (NO2)O3 0.02 (gut)
Ozon (O3)SO2 8.6 (gut)
Schwefeldioxid (SO2)Wuhu Ke Chuang Zhong Xin
| index | 2022-05-27 |
|---|---|
| pm10 | 32 |
| pm25 | 24 |
| co | 468 |
| no2 | 21 |
| o3 | 32 |
| so2 | 4.6 |
科创中心

| index | 2020-05 | 2020-04 | 2020-03 | 2020-02 | 2020-01 | 2019-12 | 2019-11 | 2019-10 | 2019-09 | 2019-08 | 2019-07 | 2019-06 | 2019-05 | 2019-04 | 2019-03 | 2019-02 | 2019-01 | 2018-12 | 2018-11 | 2018-10 |
|---|---|---|---|---|---|---|---|---|---|---|---|---|---|---|---|---|---|---|---|---|
| pm25 | 30 | 38 | 39 | 39 | 70 | 65 | 44 | 43 | 31 | 24 | 26 | 29 | 33 | 41 | 57 | 74 | 88 | 58 | 64 | 42 |
| co | 984 | 723 | 819 | 700 | 893 | 938 | 877 | 858 | 881 | 865 | 920 | 857 | 727 | 1 | 959 | 952 | 1 | 1 | 1 | 866 |
| no2 | 36 | 42 | 37 | 24 | 41 | 57 | 51 | 46 | 37 | 20 | 22 | 25 | 39 | 38 | 50 | 35 | 53 | 46 | 45 | 43 |
| o3 | 134 | 137 | 101 | 87 | 60 | 67 | 103 | 122 | 163 | 164 | 156 | 181 | 161 | 129 | 110 | 77 | 63 | 52 | 93 | 120 |
| pm10 | 56 | 64 | 56 | 44 | 60 | 69 | 79 | 83 | 56 | 42 | 43 | 49 | 64 | 65 | 80 | 74 | 88 | 70 | 69 | 68 |
| so2 | 8.1 | 9.2 | 7.5 | 5.5 | 6.4 | 8.8 | 11 | 12 | 9.8 | 8.7 | 8 | 8.6 | 10 | 11 | 12 | 8 | 12 | 12 | 8.4 | 11 |