Luftverschmutzung in Bulan: Echtzeit-Luft-Qualitätsindex und Smog-Alarm.
Für die Bulan. Heute ist Donnerstag, 4. Juni 2026. Für Bulan wurden folgende Luftverschmutzungswerte gemessen:- Feinstaub (PM10) Schwebestaub - 179 (Sehr schlecht Gefährlich)
- Feinstaub (PM2,5) - 35 (Ungesund für sensible Gruppen)
- Ozon (O3) - 0 (gut)
- Stickstoffdioxid (NO2) - 0 (gut)
- Schwefeldioxid (SO2) - 0 (gut)

Wie ist die Luftqualität Bulan heute? Ist die Luft in Bulan? verschmutzt. Gibt es Smog?
Wie hoch ist der PM10-Stand heute in Bulan? (Feinstaub (PM10) Schwebestaub)
Der aktuelle Feinstaubgehalt PM10 in Bulan is:
179 (Sehr schlecht Gefährlich)
Die höchsten PM10-Werte treten in der Regel im Monat auf: 111 (Januar 2019).
Der niedrigste Wert der Feinstaub-PM10-Belastung in Bulan ist in der Regel in: August (32).
Wie hoch ist der aktuelle PM2,5-Wert in Bulan? (Feinstaub (PM2,5))
Die heutige PM2.5-Stufe ist:
35 (Ungesund für sensible Gruppen)
Zum Vergleich: Der höchste PM2,5-Wert in Bulan in den letzten 7 Tagen war: 56 (Freitag, 27. Mai 2022) und der niedrigste: 56 (Freitag, 27. Mai 2022).
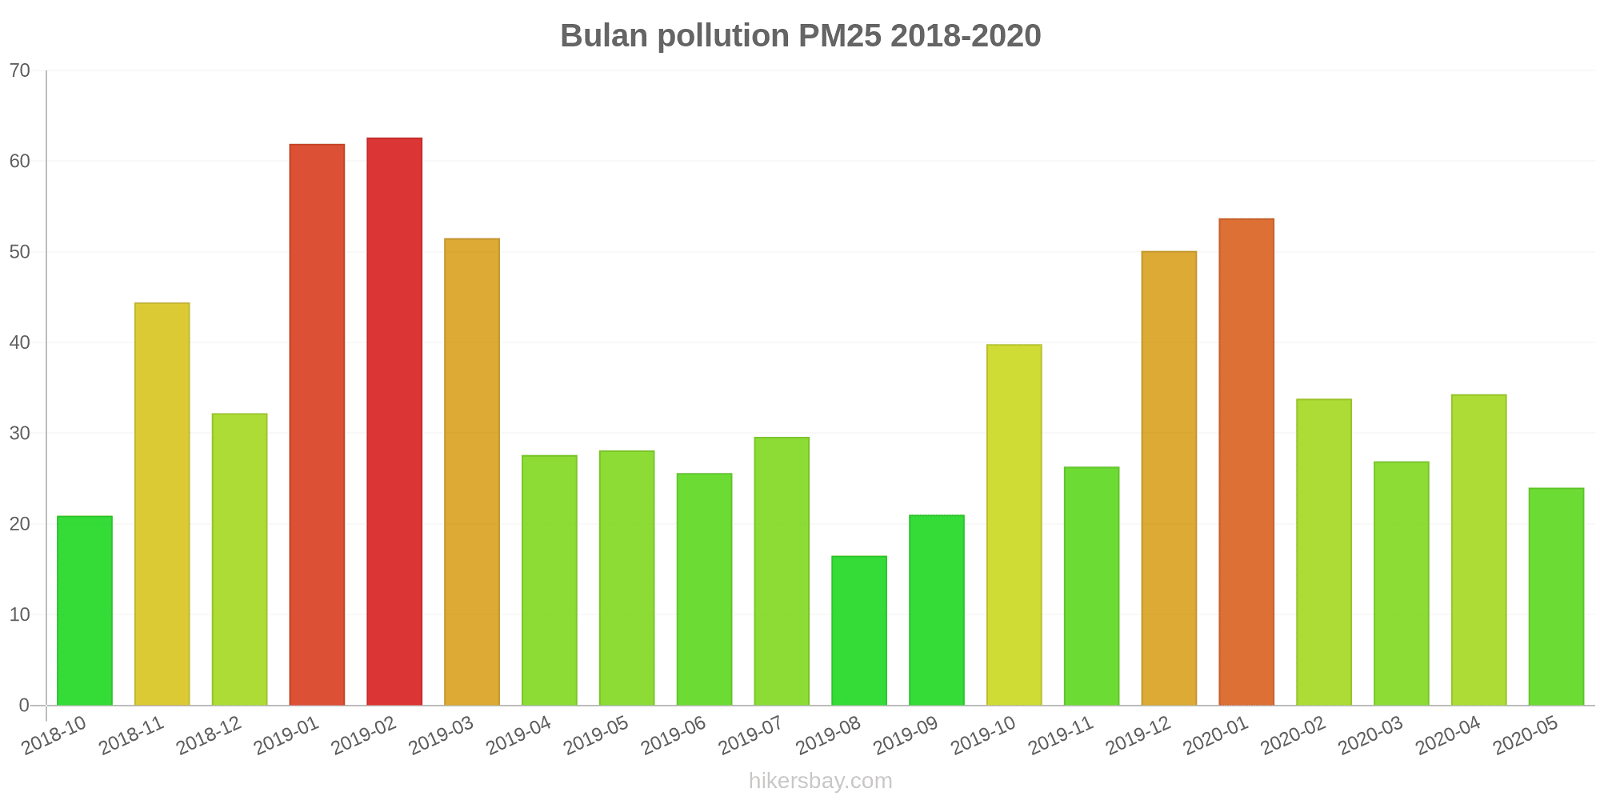
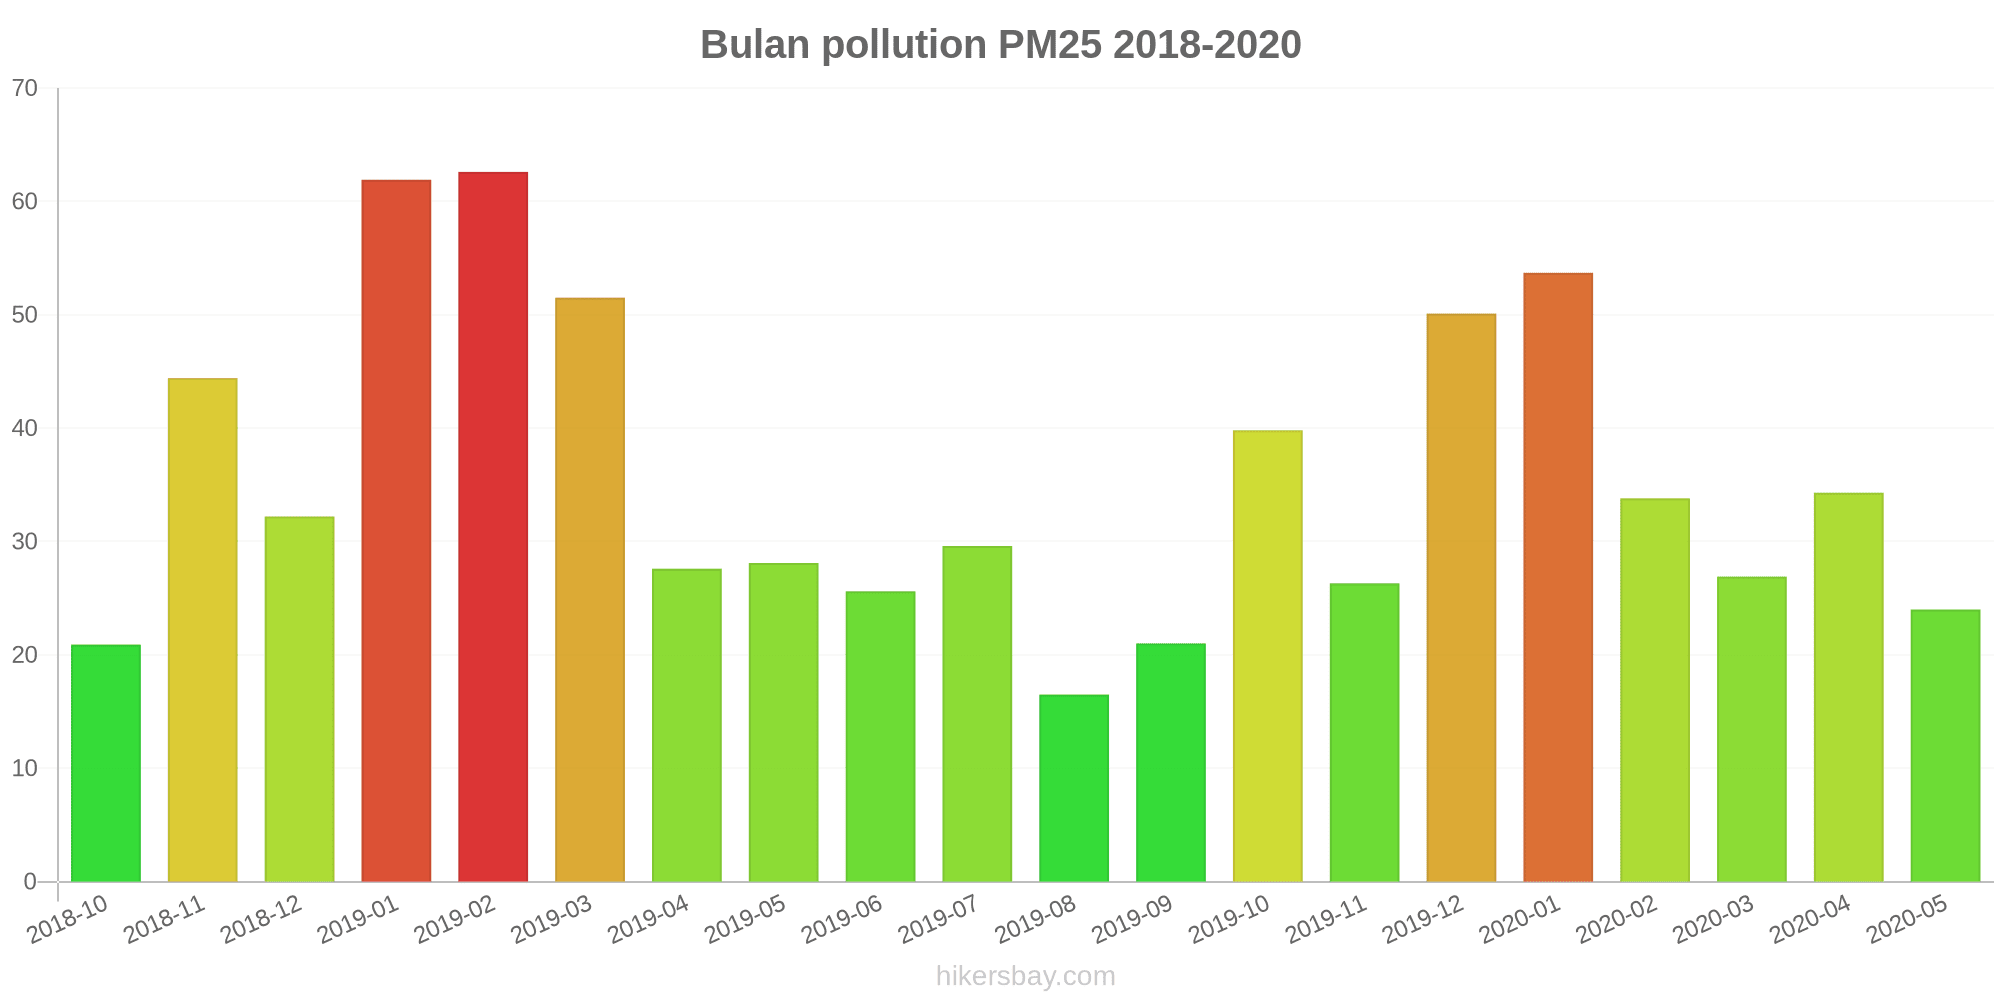
Die höchsten PM2,5-Werte wurden gemessen: 63 (Februar 2019).
Die niedrigste Feinstaubbelastung PM2,5 tritt im Monat auf: August (17).
Wie ist das O3-Niveau heute in Bulan? (Ozon (O3))
0 (gut)
Wie hoch ist das NO2-Niveau? (Stickstoffdioxid (NO2))
0 (gut)
Wie hoch ist die SO2-Belastung? (Schwefeldioxid (SO2))
0 (gut)
Aktuelle Daten Freitag, 27. Mai 2022, 12:00
PM10 179 (Sehr schlecht Gefährlich)
PM2,5 35 (Ungesund für sensible Gruppen)
O3 0 (gut)
NO2 0 (gut)
SO2 0 (gut)
Daten zur Luftverschmutzung der letzten Tage in Bulan
index
2022-05-27
pm10
56
Unhealthy for Sensitive Groups
pm25
56
Unhealthy
o3
0
Good
no2
0
Good
so2
0
Good
data source »
Luftverschmutzung in Bulan von Oktober 2018 bis Mai 2020
index
2020-05
2020-04
2020-03
2020-02
2020-01
2019-12
2019-11
2019-10
2019-09
2019-08
2019-07
2019-06
2019-05
2019-04
2019-03
2019-02
2019-01
2018-12
2018-11
2018-10
pm25
24 (Moderate)
34 (Moderate)
27 (Moderate)
34 (Moderate)
54 (Unhealthy for Sensitive Groups)
50 (Unhealthy for Sensitive Groups)
26 (Moderate)
40 (Unhealthy for Sensitive Groups)
21 (Moderate)
17 (Moderate)
30 (Moderate)
26 (Moderate)
28 (Moderate)
28 (Moderate)
52 (Unhealthy for Sensitive Groups)
63 (Unhealthy)
62 (Unhealthy)
32 (Moderate)
44 (Unhealthy for Sensitive Groups)
21 (Moderate)
co
453 (Good)
584 (Good)
599 (Good)
761 (Good)
846 (Good)
750 (Good)
540 (Good)
403 (Good)
365 (Good)
596 (Good)
527 (Good)
378 (Good)
341 (Good)
388 (Good)
407 (Good)
543 (Good)
773 (Good)
521 (Good)
510 (Good)
309 (Good)
no2
22 (Good)
28 (Good)
25 (Good)
18 (Good)
34 (Good)
35 (Good)
30 (Good)
30 (Good)
23 (Good)
18 (Good)
16 (Good)
18 (Good)
21 (Good)
25 (Good)
38 (Good)
30 (Good)
37 (Good)
28 (Good)
37 (Good)
24 (Good)
o3
137 (Unhealthy for Sensitive Groups)
132 (Unhealthy for Sensitive Groups)
106 (Moderate)
93 (Moderate)
76 (Moderate)
71 (Moderate)
81 (Moderate)
129 (Unhealthy for Sensitive Groups)
146 (Unhealthy for Sensitive Groups)
136 (Unhealthy for Sensitive Groups)
151 (Unhealthy)
146 (Unhealthy for Sensitive Groups)
169 (Unhealthy)
122 (Unhealthy for Sensitive Groups)
115 (Moderate)
95 (Moderate)
73 (Moderate)
75 (Moderate)
98 (Moderate)
103 (Moderate)
pm10
53 (Unhealthy for Sensitive Groups)
73 (Unhealthy for Sensitive Groups)
61 (Unhealthy for Sensitive Groups)
47 (Moderate)
73 (Unhealthy for Sensitive Groups)
74 (Unhealthy for Sensitive Groups)
55 (Unhealthy for Sensitive Groups)
81 (Unhealthy)
42 (Moderate)
32 (Moderate)
44 (Moderate)
44 (Moderate)
70 (Unhealthy for Sensitive Groups)
70 (Unhealthy for Sensitive Groups)
97 (Unhealthy)
106 (Unhealthy)
111 (Very Unhealthy)
74 (Unhealthy for Sensitive Groups)
105 (Unhealthy)
61 (Unhealthy for Sensitive Groups)
so2
8.4 (Good)
9.9 (Good)
8.8 (Good)
7.8 (Good)
12 (Good)
10 (Good)
8.3 (Good)
8.1 (Good)
7 (Good)
6.7 (Good)
5.7 (Good)
5.2 (Good)
6.8 (Good)
5.9 (Good)
9.5 (Good)
11 (Good)
15 (Good)
11 (Good)
8.7 (Good)
3.6 (Good)
data source »
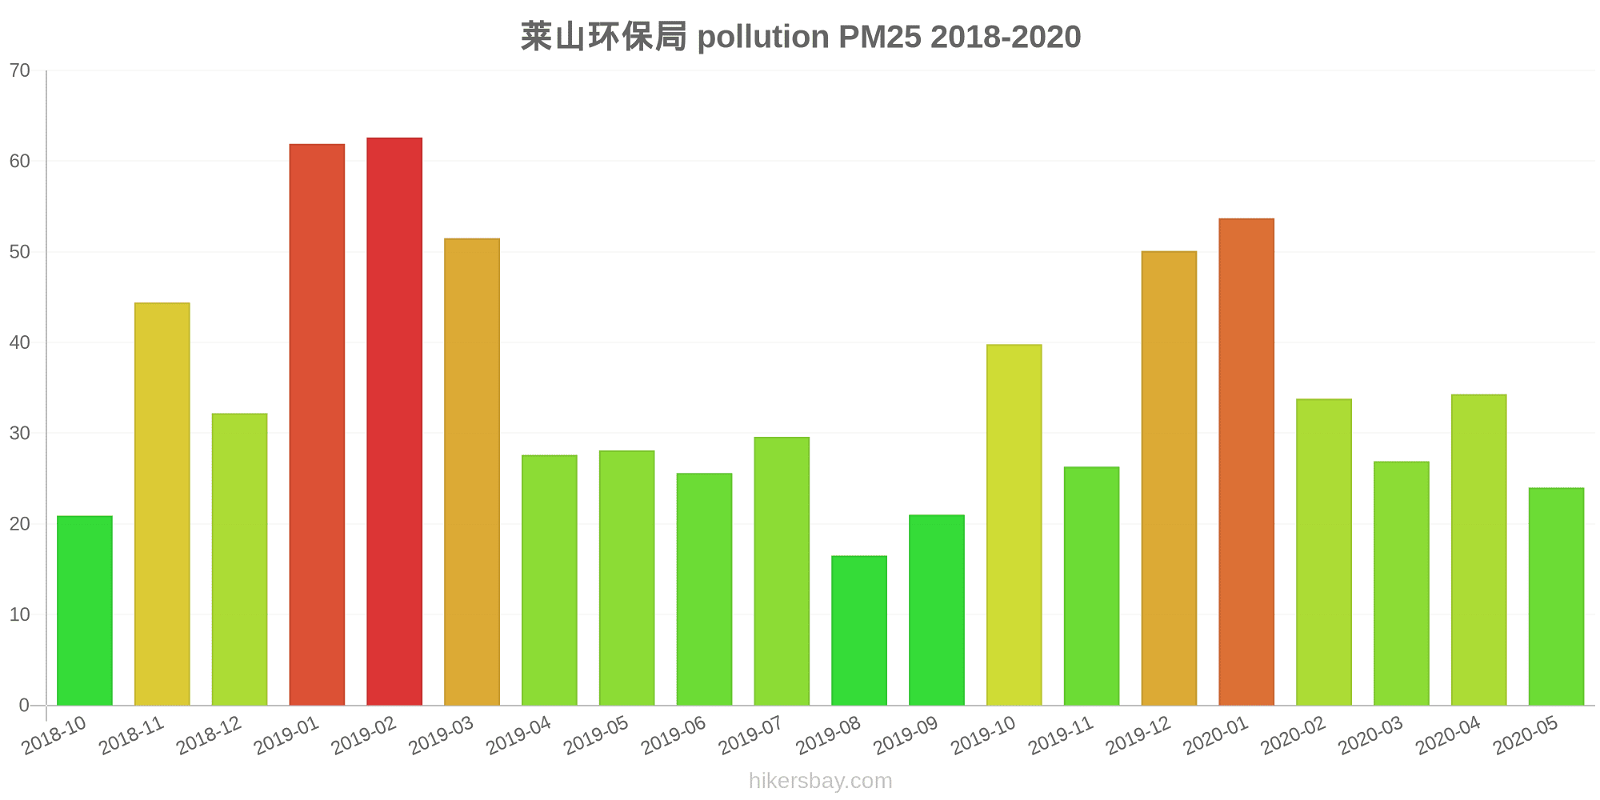
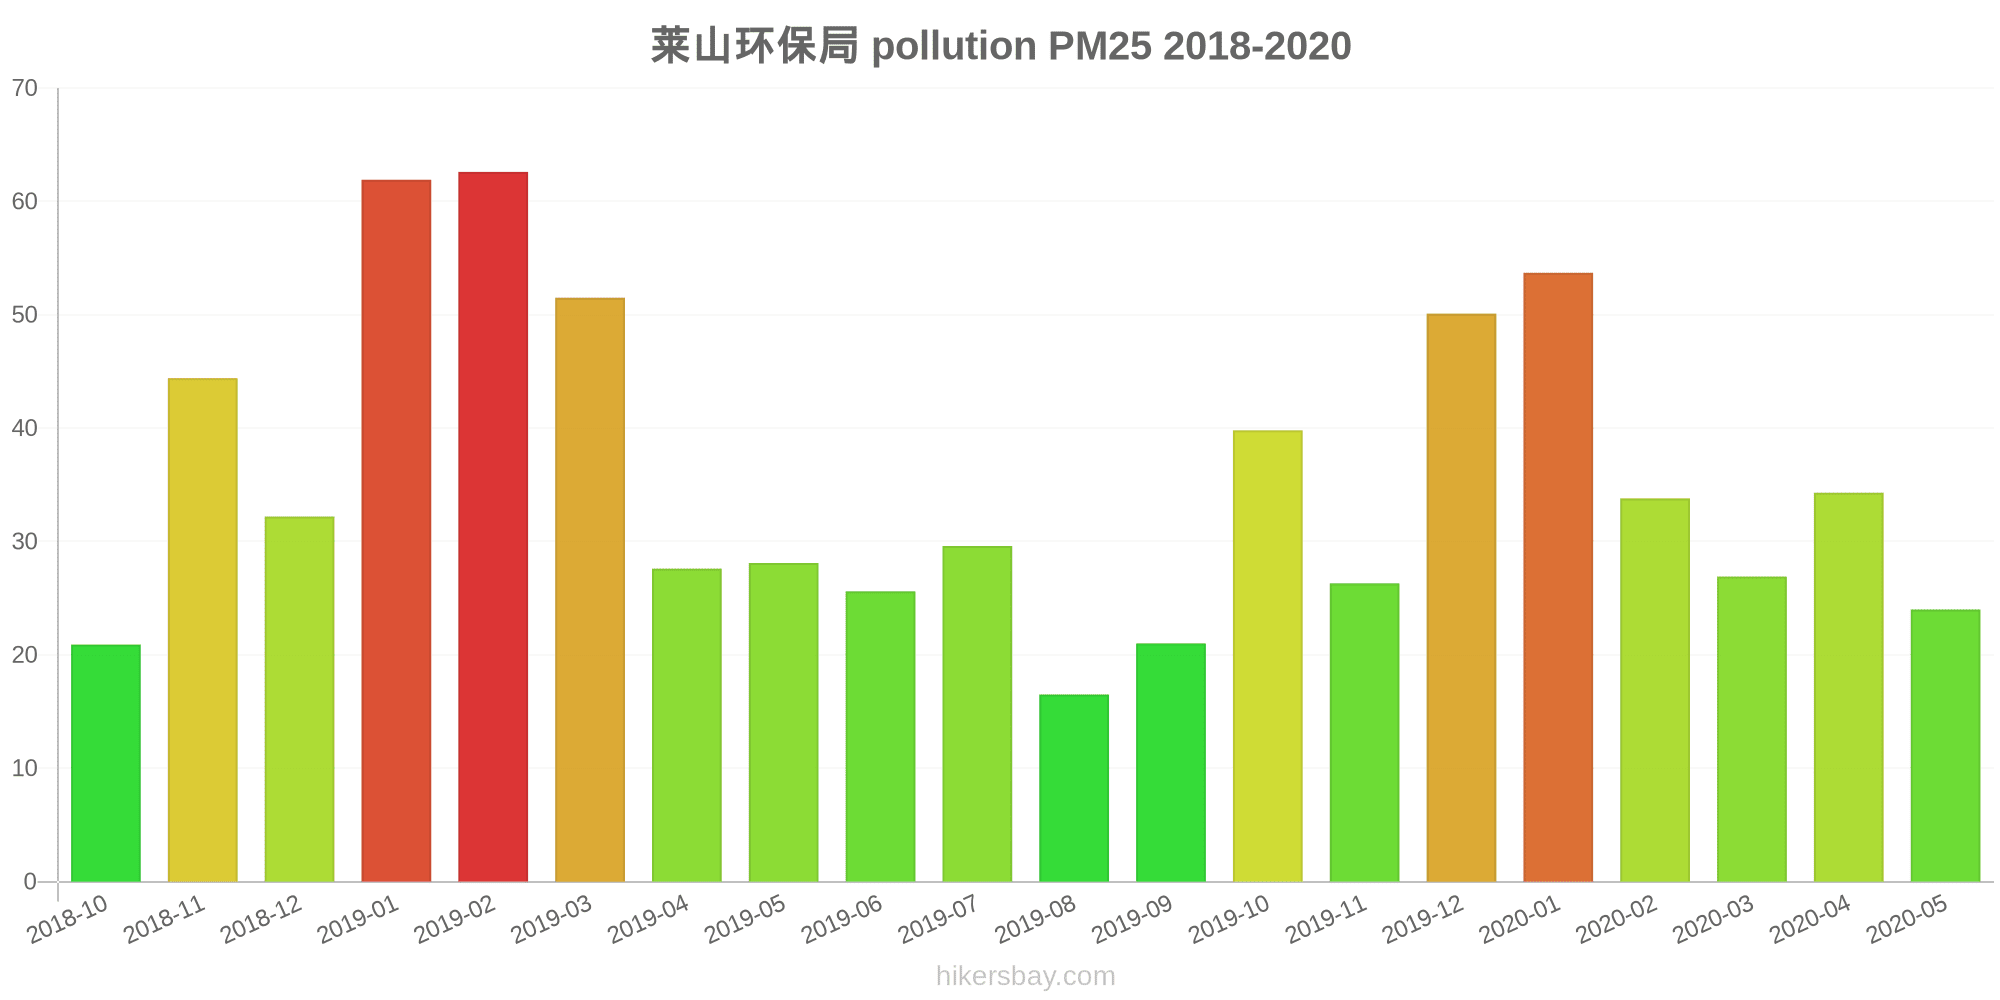
莱山环保局
Freitag, 27. Mai 2022, 12:00
PM10 179 (Sehr schlecht Gefährlich)
Feinstaub (PM10) Schwebestaub
PM2,5 35 (Ungesund für sensible Gruppen)
Feinstaub (PM2,5)
O3 0.04 (gut)
Ozon (O3)
NO2 0 (gut)
Stickstoffdioxid (NO2)
SO2 0 (gut)
Schwefeldioxid (SO2)
莱山环保局
index
2022-05-27
pm10
56
pm25
56
o3
0.03
no2
0
so2
0
莱山环保局
2018-10 2020-05
index
2020-05
2020-04
2020-03
2020-02
2020-01
2019-12
2019-11
2019-10
2019-09
2019-08
2019-07
2019-06
2019-05
2019-04
2019-03
2019-02
2019-01
2018-12
2018-11
2018-10
pm25
24
34
27
34
54
50
26
40
21
17
30
26
28
28
52
63
62
32
44
21
co
453
584
599
761
846
750
540
403
365
596
527
378
341
388
407
543
773
521
510
309
no2
22
28
25
18
34
35
30
30
23
18
16
18
21
25
38
30
37
28
37
24
o3
137
132
106
93
76
71
81
129
146
136
151
146
169
122
115
95
73
75
98
103
pm10
53
73
61
47
73
74
55
81
42
32
44
44
70
70
97
106
111
74
105
61
so2
8.4
9.9
8.8
7.8
12
10
8.3
8.1
7
6.7
5.7
5.2
6.8
5.9
9.5
11
15
11
8.7
3.6
* Pollution data source:
https://openaq.org
(ChinaAQIData)
The data is licensed under CC-By 4.0
PM10 179 (Sehr schlecht Gefährlich)
PM2,5 35 (Ungesund für sensible Gruppen)
O3 0 (gut)
NO2 0 (gut)
SO2 0 (gut)
Daten zur Luftverschmutzung der letzten Tage in Bulan
| index | 2022-05-27 |
|---|---|
| pm10 | 56 Unhealthy for Sensitive Groups |
| pm25 | 56 Unhealthy |
| o3 | 0 Good |
| no2 | 0 Good |
| so2 | 0 Good |
| index | 2020-05 | 2020-04 | 2020-03 | 2020-02 | 2020-01 | 2019-12 | 2019-11 | 2019-10 | 2019-09 | 2019-08 | 2019-07 | 2019-06 | 2019-05 | 2019-04 | 2019-03 | 2019-02 | 2019-01 | 2018-12 | 2018-11 | 2018-10 |
|---|---|---|---|---|---|---|---|---|---|---|---|---|---|---|---|---|---|---|---|---|
| pm25 | 24 (Moderate) | 34 (Moderate) | 27 (Moderate) | 34 (Moderate) | 54 (Unhealthy for Sensitive Groups) | 50 (Unhealthy for Sensitive Groups) | 26 (Moderate) | 40 (Unhealthy for Sensitive Groups) | 21 (Moderate) | 17 (Moderate) | 30 (Moderate) | 26 (Moderate) | 28 (Moderate) | 28 (Moderate) | 52 (Unhealthy for Sensitive Groups) | 63 (Unhealthy) | 62 (Unhealthy) | 32 (Moderate) | 44 (Unhealthy for Sensitive Groups) | 21 (Moderate) |
| co | 453 (Good) | 584 (Good) | 599 (Good) | 761 (Good) | 846 (Good) | 750 (Good) | 540 (Good) | 403 (Good) | 365 (Good) | 596 (Good) | 527 (Good) | 378 (Good) | 341 (Good) | 388 (Good) | 407 (Good) | 543 (Good) | 773 (Good) | 521 (Good) | 510 (Good) | 309 (Good) |
| no2 | 22 (Good) | 28 (Good) | 25 (Good) | 18 (Good) | 34 (Good) | 35 (Good) | 30 (Good) | 30 (Good) | 23 (Good) | 18 (Good) | 16 (Good) | 18 (Good) | 21 (Good) | 25 (Good) | 38 (Good) | 30 (Good) | 37 (Good) | 28 (Good) | 37 (Good) | 24 (Good) |
| o3 | 137 (Unhealthy for Sensitive Groups) | 132 (Unhealthy for Sensitive Groups) | 106 (Moderate) | 93 (Moderate) | 76 (Moderate) | 71 (Moderate) | 81 (Moderate) | 129 (Unhealthy for Sensitive Groups) | 146 (Unhealthy for Sensitive Groups) | 136 (Unhealthy for Sensitive Groups) | 151 (Unhealthy) | 146 (Unhealthy for Sensitive Groups) | 169 (Unhealthy) | 122 (Unhealthy for Sensitive Groups) | 115 (Moderate) | 95 (Moderate) | 73 (Moderate) | 75 (Moderate) | 98 (Moderate) | 103 (Moderate) |
| pm10 | 53 (Unhealthy for Sensitive Groups) | 73 (Unhealthy for Sensitive Groups) | 61 (Unhealthy for Sensitive Groups) | 47 (Moderate) | 73 (Unhealthy for Sensitive Groups) | 74 (Unhealthy for Sensitive Groups) | 55 (Unhealthy for Sensitive Groups) | 81 (Unhealthy) | 42 (Moderate) | 32 (Moderate) | 44 (Moderate) | 44 (Moderate) | 70 (Unhealthy for Sensitive Groups) | 70 (Unhealthy for Sensitive Groups) | 97 (Unhealthy) | 106 (Unhealthy) | 111 (Very Unhealthy) | 74 (Unhealthy for Sensitive Groups) | 105 (Unhealthy) | 61 (Unhealthy for Sensitive Groups) |
| so2 | 8.4 (Good) | 9.9 (Good) | 8.8 (Good) | 7.8 (Good) | 12 (Good) | 10 (Good) | 8.3 (Good) | 8.1 (Good) | 7 (Good) | 6.7 (Good) | 5.7 (Good) | 5.2 (Good) | 6.8 (Good) | 5.9 (Good) | 9.5 (Good) | 11 (Good) | 15 (Good) | 11 (Good) | 8.7 (Good) | 3.6 (Good) |
PM10 179 (Sehr schlecht Gefährlich)
Feinstaub (PM10) SchwebestaubPM2,5 35 (Ungesund für sensible Gruppen)
Feinstaub (PM2,5)O3 0.04 (gut)
Ozon (O3)NO2 0 (gut)
Stickstoffdioxid (NO2)SO2 0 (gut)
Schwefeldioxid (SO2)莱山环保局
| index | 2022-05-27 |
|---|---|
| pm10 | 56 |
| pm25 | 56 |
| o3 | 0.03 |
| no2 | 0 |
| so2 | 0 |
莱山环保局
| index | 2020-05 | 2020-04 | 2020-03 | 2020-02 | 2020-01 | 2019-12 | 2019-11 | 2019-10 | 2019-09 | 2019-08 | 2019-07 | 2019-06 | 2019-05 | 2019-04 | 2019-03 | 2019-02 | 2019-01 | 2018-12 | 2018-11 | 2018-10 |
|---|---|---|---|---|---|---|---|---|---|---|---|---|---|---|---|---|---|---|---|---|
| pm25 | 24 | 34 | 27 | 34 | 54 | 50 | 26 | 40 | 21 | 17 | 30 | 26 | 28 | 28 | 52 | 63 | 62 | 32 | 44 | 21 |
| co | 453 | 584 | 599 | 761 | 846 | 750 | 540 | 403 | 365 | 596 | 527 | 378 | 341 | 388 | 407 | 543 | 773 | 521 | 510 | 309 |
| no2 | 22 | 28 | 25 | 18 | 34 | 35 | 30 | 30 | 23 | 18 | 16 | 18 | 21 | 25 | 38 | 30 | 37 | 28 | 37 | 24 |
| o3 | 137 | 132 | 106 | 93 | 76 | 71 | 81 | 129 | 146 | 136 | 151 | 146 | 169 | 122 | 115 | 95 | 73 | 75 | 98 | 103 |
| pm10 | 53 | 73 | 61 | 47 | 73 | 74 | 55 | 81 | 42 | 32 | 44 | 44 | 70 | 70 | 97 | 106 | 111 | 74 | 105 | 61 |
| so2 | 8.4 | 9.9 | 8.8 | 7.8 | 12 | 10 | 8.3 | 8.1 | 7 | 6.7 | 5.7 | 5.2 | 6.8 | 5.9 | 9.5 | 11 | 15 | 11 | 8.7 | 3.6 |