Luftverschmutzung in Zhongqiao: Echtzeit-Luft-Qualitätsindex und Smog-Alarm.
Für die Zhongqiao. Heute ist Donnerstag, 4. Juni 2026. Für Zhongqiao wurden folgende Luftverschmutzungswerte gemessen:- Feinstaub (PM10) Schwebestaub - 179 (Sehr schlecht Gefährlich)
- Feinstaub (PM2,5) - 35 (Ungesund für sensible Gruppen)
- Ozon (O3) - 0 (gut)
- Stickstoffdioxid (NO2) - 0 (gut)
- Schwefeldioxid (SO2) - 0 (gut)

Wie ist die Luftqualität Zhongqiao heute? Ist die Luft in Zhongqiao? verschmutzt. Gibt es Smog?
Wie hoch ist der PM10-Stand heute in Zhongqiao? (Feinstaub (PM10) Schwebestaub)
Der aktuelle Feinstaubgehalt PM10 in Zhongqiao is:
179 (Sehr schlecht Gefährlich)
Die höchsten PM10-Werte treten in der Regel im Monat auf: 209 (Januar 2019).
Der niedrigste Wert der Feinstaub-PM10-Belastung in Zhongqiao ist in der Regel in: August (58).
Wie hoch ist der aktuelle PM2,5-Wert in Zhongqiao? (Feinstaub (PM2,5))
Die heutige PM2.5-Stufe ist:
35 (Ungesund für sensible Gruppen)
Zum Vergleich: Der höchste PM2,5-Wert in Zhongqiao in den letzten 7 Tagen war: 56 (Freitag, 27. Mai 2022) und der niedrigste: 56 (Freitag, 27. Mai 2022).
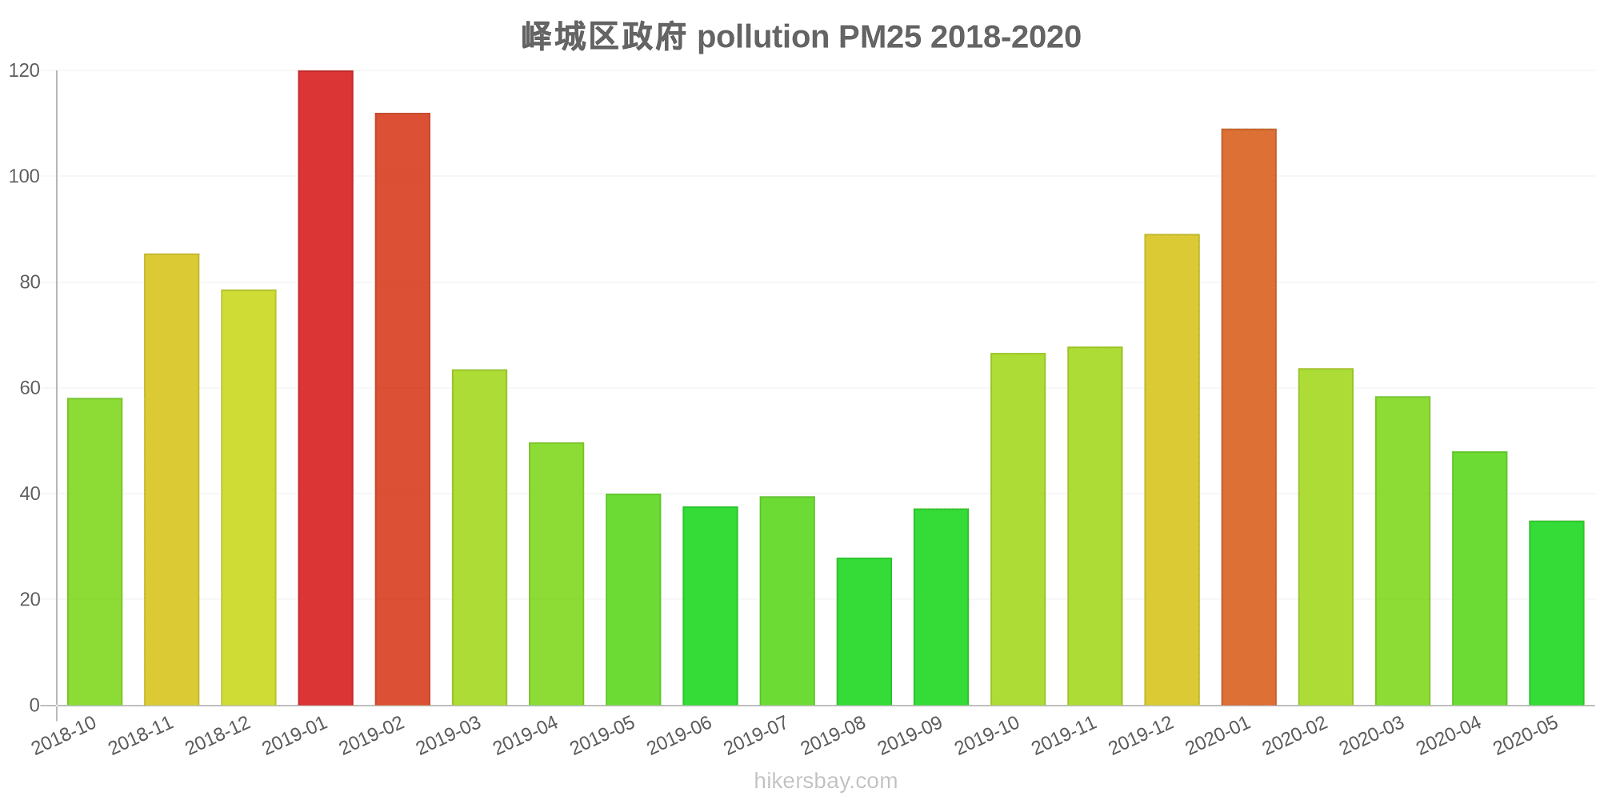
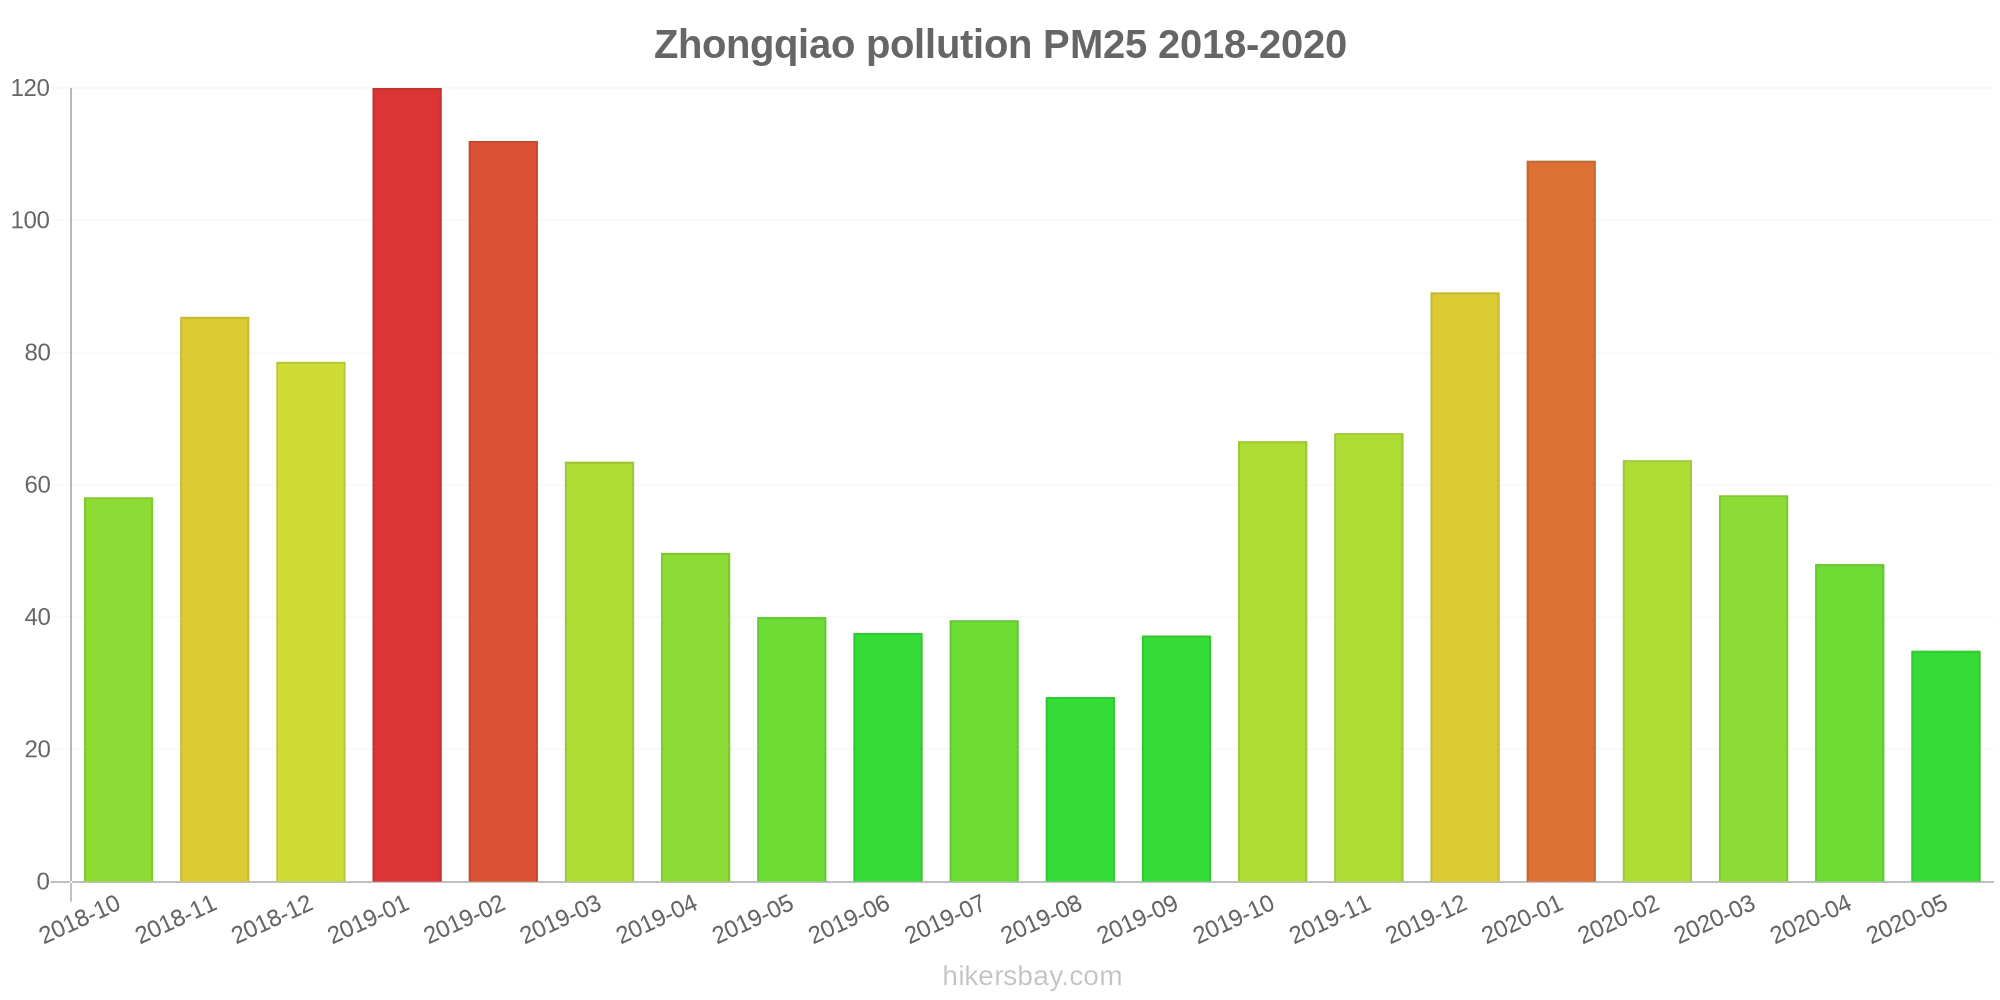
Die höchsten PM2,5-Werte wurden gemessen: 120 (Januar 2019).
Die niedrigste Feinstaubbelastung PM2,5 tritt im Monat auf: August (28).
Wie ist das O3-Niveau heute in Zhongqiao? (Ozon (O3))
0 (gut)
Wie hoch ist das NO2-Niveau? (Stickstoffdioxid (NO2))
0 (gut)
Wie hoch ist die SO2-Belastung? (Schwefeldioxid (SO2))
0 (gut)
Aktuelle Daten Freitag, 27. Mai 2022, 12:00
PM10 179 (Sehr schlecht Gefährlich)
PM2,5 35 (Ungesund für sensible Gruppen)
O3 0 (gut)
NO2 0 (gut)
SO2 0 (gut)
Daten zur Luftverschmutzung der letzten Tage in Zhongqiao
index
2022-05-27
pm10
56
Unhealthy for Sensitive Groups
pm25
56
Unhealthy
o3
0
Good
no2
0
Good
so2
0
Good
data source »
Luftverschmutzung in Zhongqiao von Oktober 2018 bis Mai 2020

index
2020-05
2020-04
2020-03
2020-02
2020-01
2019-12
2019-11
2019-10
2019-09
2019-08
2019-07
2019-06
2019-05
2019-04
2019-03
2019-02
2019-01
2018-12
2018-11
2018-10
pm25
35 (Moderate)
48 (Unhealthy for Sensitive Groups)
58 (Unhealthy)
64 (Unhealthy)
109 (Very Unhealthy)
89 (Very Unhealthy)
68 (Unhealthy)
67 (Unhealthy)
37 (Unhealthy for Sensitive Groups)
28 (Moderate)
40 (Unhealthy for Sensitive Groups)
38 (Unhealthy for Sensitive Groups)
40 (Unhealthy for Sensitive Groups)
50 (Unhealthy for Sensitive Groups)
64 (Unhealthy)
112 (Very bad Hazardous)
120 (Very bad Hazardous)
79 (Very Unhealthy)
85 (Very Unhealthy)
58 (Unhealthy)
co
335 (Good)
524 (Good)
666 (Good)
820 (Good)
1 (Good)
978 (Good)
802 (Good)
783 (Good)
589 (Good)
531 (Good)
589 (Good)
522 (Good)
717 (Good)
811 (Good)
662 (Good)
1 (Good)
1 (Good)
910 (Good)
1 (Good)
660 (Good)
no2
16 (Good)
31 (Good)
37 (Good)
21 (Good)
34 (Good)
41 (Moderate)
42 (Moderate)
46 (Moderate)
24 (Good)
15 (Good)
22 (Good)
20 (Good)
30 (Good)
34 (Good)
41 (Moderate)
39 (Good)
55 (Moderate)
48 (Moderate)
45 (Moderate)
48 (Moderate)
o3
144 (Unhealthy for Sensitive Groups)
141 (Unhealthy for Sensitive Groups)
108 (Moderate)
93 (Moderate)
77 (Moderate)
66 (Good)
96 (Moderate)
126 (Unhealthy for Sensitive Groups)
175 (Unhealthy)
141 (Unhealthy for Sensitive Groups)
171 (Unhealthy)
201 (Very Unhealthy)
180 (Very Unhealthy)
144 (Unhealthy for Sensitive Groups)
135 (Unhealthy for Sensitive Groups)
84 (Moderate)
62 (Good)
60 (Good)
92 (Moderate)
99 (Moderate)
pm10
91 (Unhealthy)
113 (Very Unhealthy)
117 (Very Unhealthy)
89 (Unhealthy)
145 (Very Unhealthy)
136 (Very Unhealthy)
149 (Very Unhealthy)
146 (Very Unhealthy)
89 (Unhealthy)
58 (Unhealthy for Sensitive Groups)
78 (Unhealthy for Sensitive Groups)
94 (Unhealthy)
110 (Very Unhealthy)
112 (Very Unhealthy)
147 (Very Unhealthy)
178 (Very bad Hazardous)
209 (Very bad Hazardous)
156 (Very bad Hazardous)
166 (Very bad Hazardous)
142 (Very Unhealthy)
so2
9.8 (Good)
19 (Good)
15 (Good)
9.9 (Good)
17 (Good)
18 (Good)
17 (Good)
18 (Good)
17 (Good)
9.3 (Good)
9.9 (Good)
9.4 (Good)
17 (Good)
15 (Good)
23 (Good)
23 (Good)
23 (Good)
20 (Good)
17 (Good)
23 (Good)
data source »
峄城区政府
Freitag, 27. Mai 2022, 12:00
PM10 179 (Sehr schlecht Gefährlich)
Feinstaub (PM10) Schwebestaub
PM2,5 35 (Ungesund für sensible Gruppen)
Feinstaub (PM2,5)
O3 0.04 (gut)
Ozon (O3)
NO2 0 (gut)
Stickstoffdioxid (NO2)
SO2 0 (gut)
Schwefeldioxid (SO2)
峄城区政府
index
2022-05-27
pm10
56
pm25
56
o3
0.03
no2
0
so2
0
峄城区政府
2018-10 2020-05
index
2020-05
2020-04
2020-03
2020-02
2020-01
2019-12
2019-11
2019-10
2019-09
2019-08
2019-07
2019-06
2019-05
2019-04
2019-03
2019-02
2019-01
2018-12
2018-11
2018-10
pm25
35
48
58
64
109
89
68
67
37
28
40
38
40
50
64
112
120
79
85
58
co
335
524
666
820
1
978
802
783
589
531
589
522
717
811
662
1
1
910
1
660
no2
16
31
37
21
34
41
42
46
24
15
22
20
30
34
41
39
55
48
45
48
o3
144
141
108
93
77
66
96
126
175
141
171
201
180
144
135
84
62
60
92
99
pm10
91
113
117
89
145
136
149
146
89
58
78
94
110
112
147
178
209
156
166
142
so2
9.8
19
15
9.9
17
18
17
18
17
9.3
9.9
9.4
17
15
23
23
23
20
17
23
* Pollution data source:
https://openaq.org
(ChinaAQIData)
The data is licensed under CC-By 4.0
PM10 179 (Sehr schlecht Gefährlich)
PM2,5 35 (Ungesund für sensible Gruppen)
O3 0 (gut)
NO2 0 (gut)
SO2 0 (gut)
Daten zur Luftverschmutzung der letzten Tage in Zhongqiao
| index | 2022-05-27 |
|---|---|
| pm10 | 56 Unhealthy for Sensitive Groups |
| pm25 | 56 Unhealthy |
| o3 | 0 Good |
| no2 | 0 Good |
| so2 | 0 Good |
| index | 2020-05 | 2020-04 | 2020-03 | 2020-02 | 2020-01 | 2019-12 | 2019-11 | 2019-10 | 2019-09 | 2019-08 | 2019-07 | 2019-06 | 2019-05 | 2019-04 | 2019-03 | 2019-02 | 2019-01 | 2018-12 | 2018-11 | 2018-10 |
|---|---|---|---|---|---|---|---|---|---|---|---|---|---|---|---|---|---|---|---|---|
| pm25 | 35 (Moderate) | 48 (Unhealthy for Sensitive Groups) | 58 (Unhealthy) | 64 (Unhealthy) | 109 (Very Unhealthy) | 89 (Very Unhealthy) | 68 (Unhealthy) | 67 (Unhealthy) | 37 (Unhealthy for Sensitive Groups) | 28 (Moderate) | 40 (Unhealthy for Sensitive Groups) | 38 (Unhealthy for Sensitive Groups) | 40 (Unhealthy for Sensitive Groups) | 50 (Unhealthy for Sensitive Groups) | 64 (Unhealthy) | 112 (Very bad Hazardous) | 120 (Very bad Hazardous) | 79 (Very Unhealthy) | 85 (Very Unhealthy) | 58 (Unhealthy) |
| co | 335 (Good) | 524 (Good) | 666 (Good) | 820 (Good) | 1 (Good) | 978 (Good) | 802 (Good) | 783 (Good) | 589 (Good) | 531 (Good) | 589 (Good) | 522 (Good) | 717 (Good) | 811 (Good) | 662 (Good) | 1 (Good) | 1 (Good) | 910 (Good) | 1 (Good) | 660 (Good) |
| no2 | 16 (Good) | 31 (Good) | 37 (Good) | 21 (Good) | 34 (Good) | 41 (Moderate) | 42 (Moderate) | 46 (Moderate) | 24 (Good) | 15 (Good) | 22 (Good) | 20 (Good) | 30 (Good) | 34 (Good) | 41 (Moderate) | 39 (Good) | 55 (Moderate) | 48 (Moderate) | 45 (Moderate) | 48 (Moderate) |
| o3 | 144 (Unhealthy for Sensitive Groups) | 141 (Unhealthy for Sensitive Groups) | 108 (Moderate) | 93 (Moderate) | 77 (Moderate) | 66 (Good) | 96 (Moderate) | 126 (Unhealthy for Sensitive Groups) | 175 (Unhealthy) | 141 (Unhealthy for Sensitive Groups) | 171 (Unhealthy) | 201 (Very Unhealthy) | 180 (Very Unhealthy) | 144 (Unhealthy for Sensitive Groups) | 135 (Unhealthy for Sensitive Groups) | 84 (Moderate) | 62 (Good) | 60 (Good) | 92 (Moderate) | 99 (Moderate) |
| pm10 | 91 (Unhealthy) | 113 (Very Unhealthy) | 117 (Very Unhealthy) | 89 (Unhealthy) | 145 (Very Unhealthy) | 136 (Very Unhealthy) | 149 (Very Unhealthy) | 146 (Very Unhealthy) | 89 (Unhealthy) | 58 (Unhealthy for Sensitive Groups) | 78 (Unhealthy for Sensitive Groups) | 94 (Unhealthy) | 110 (Very Unhealthy) | 112 (Very Unhealthy) | 147 (Very Unhealthy) | 178 (Very bad Hazardous) | 209 (Very bad Hazardous) | 156 (Very bad Hazardous) | 166 (Very bad Hazardous) | 142 (Very Unhealthy) |
| so2 | 9.8 (Good) | 19 (Good) | 15 (Good) | 9.9 (Good) | 17 (Good) | 18 (Good) | 17 (Good) | 18 (Good) | 17 (Good) | 9.3 (Good) | 9.9 (Good) | 9.4 (Good) | 17 (Good) | 15 (Good) | 23 (Good) | 23 (Good) | 23 (Good) | 20 (Good) | 17 (Good) | 23 (Good) |
PM10 179 (Sehr schlecht Gefährlich)
Feinstaub (PM10) SchwebestaubPM2,5 35 (Ungesund für sensible Gruppen)
Feinstaub (PM2,5)O3 0.04 (gut)
Ozon (O3)NO2 0 (gut)
Stickstoffdioxid (NO2)SO2 0 (gut)
Schwefeldioxid (SO2)峄城区政府
| index | 2022-05-27 |
|---|---|
| pm10 | 56 |
| pm25 | 56 |
| o3 | 0.03 |
| no2 | 0 |
| so2 | 0 |
峄城区政府

| index | 2020-05 | 2020-04 | 2020-03 | 2020-02 | 2020-01 | 2019-12 | 2019-11 | 2019-10 | 2019-09 | 2019-08 | 2019-07 | 2019-06 | 2019-05 | 2019-04 | 2019-03 | 2019-02 | 2019-01 | 2018-12 | 2018-11 | 2018-10 |
|---|---|---|---|---|---|---|---|---|---|---|---|---|---|---|---|---|---|---|---|---|
| pm25 | 35 | 48 | 58 | 64 | 109 | 89 | 68 | 67 | 37 | 28 | 40 | 38 | 40 | 50 | 64 | 112 | 120 | 79 | 85 | 58 |
| co | 335 | 524 | 666 | 820 | 1 | 978 | 802 | 783 | 589 | 531 | 589 | 522 | 717 | 811 | 662 | 1 | 1 | 910 | 1 | 660 |
| no2 | 16 | 31 | 37 | 21 | 34 | 41 | 42 | 46 | 24 | 15 | 22 | 20 | 30 | 34 | 41 | 39 | 55 | 48 | 45 | 48 |
| o3 | 144 | 141 | 108 | 93 | 77 | 66 | 96 | 126 | 175 | 141 | 171 | 201 | 180 | 144 | 135 | 84 | 62 | 60 | 92 | 99 |
| pm10 | 91 | 113 | 117 | 89 | 145 | 136 | 149 | 146 | 89 | 58 | 78 | 94 | 110 | 112 | 147 | 178 | 209 | 156 | 166 | 142 |
| so2 | 9.8 | 19 | 15 | 9.9 | 17 | 18 | 17 | 18 | 17 | 9.3 | 9.9 | 9.4 | 17 | 15 | 23 | 23 | 23 | 20 | 17 | 23 |