Luftverschmutzung in Nangouxi: Echtzeit-Luft-Qualitätsindex und Smog-Alarm.
Für die Nangouxi. Heute ist Donnerstag, 4. Juni 2026. Für Nangouxi wurden folgende Luftverschmutzungswerte gemessen:- Feinstaub (PM10) Schwebestaub - 53 (Ungesund für sensible Gruppen)
- Ozon (O3) - 0 (gut)
- Feinstaub (PM2,5) - 7 (gut)
- Schwefeldioxid (SO2) - 18 (gut)
- Stickstoffdioxid (NO2) - 3 (gut)
- Kohlenmonoxid (CO) - 1 (gut)

Wie ist die Luftqualität Nangouxi heute? Ist die Luft in Nangouxi? verschmutzt. Gibt es Smog?
Wie hoch ist der PM10-Stand heute in Nangouxi? (Feinstaub (PM10) Schwebestaub)
Der aktuelle Feinstaubgehalt PM10 in Nangouxi is:
53 (Ungesund für sensible Gruppen)
Die höchsten PM10-Werte treten in der Regel im Monat auf: 173 (Januar 2019).
Der niedrigste Wert der Feinstaub-PM10-Belastung in Nangouxi ist in der Regel in: August (50).
Wie ist das O3-Niveau heute in Nangouxi? (Ozon (O3))
0 (gut)
Wie hoch ist der aktuelle PM2,5-Wert in Nangouxi? (Feinstaub (PM2,5))
Die heutige PM2.5-Stufe ist:
7 (gut)
Zum Vergleich: Der höchste PM2,5-Wert in Nangouxi in den letzten 7 Tagen war: 21 (Freitag, 27. Mai 2022) und der niedrigste: 21 (Freitag, 27. Mai 2022).
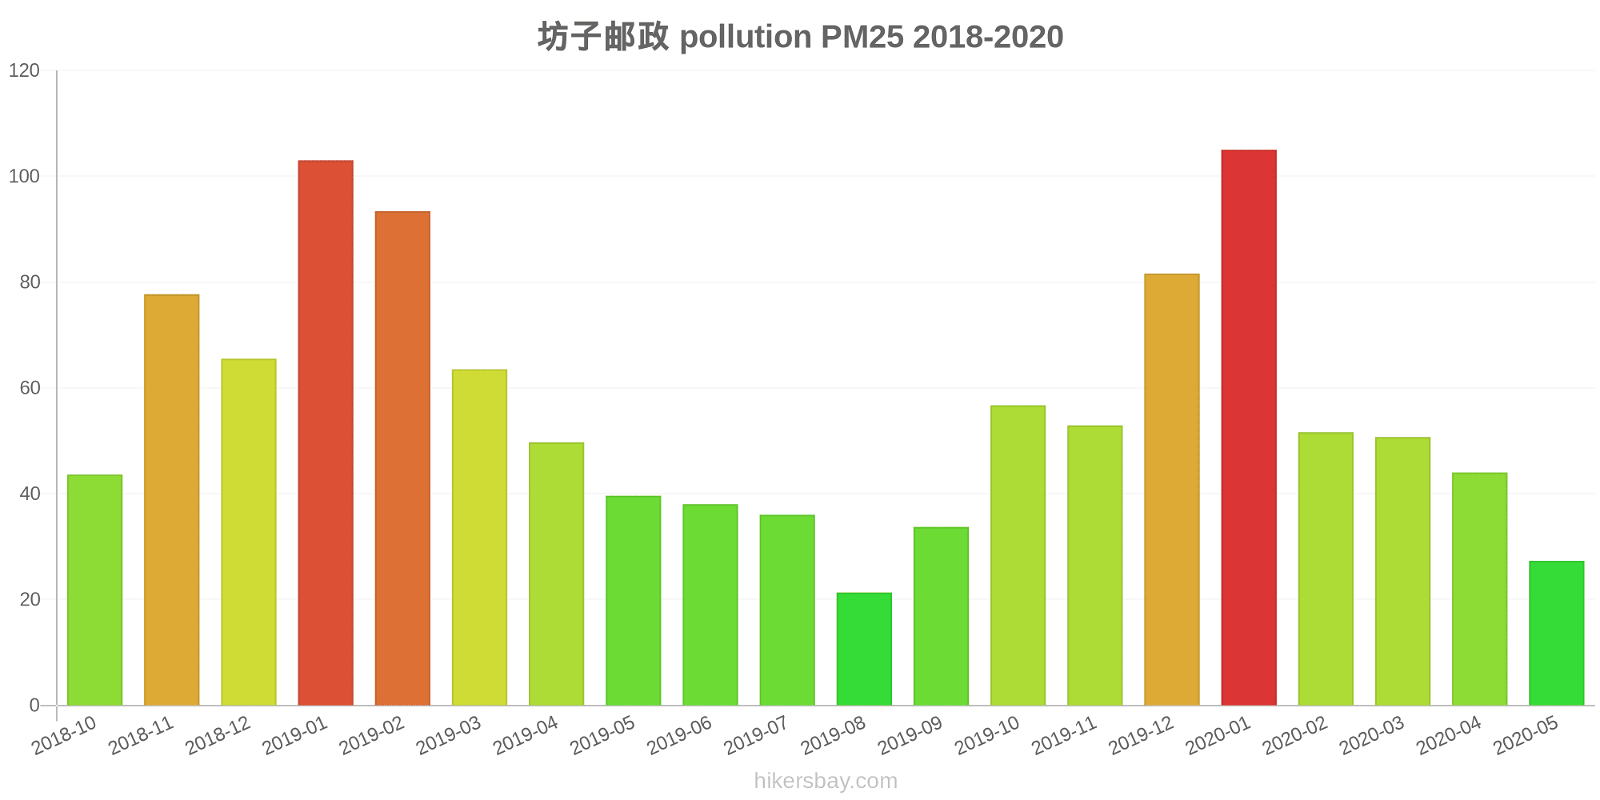
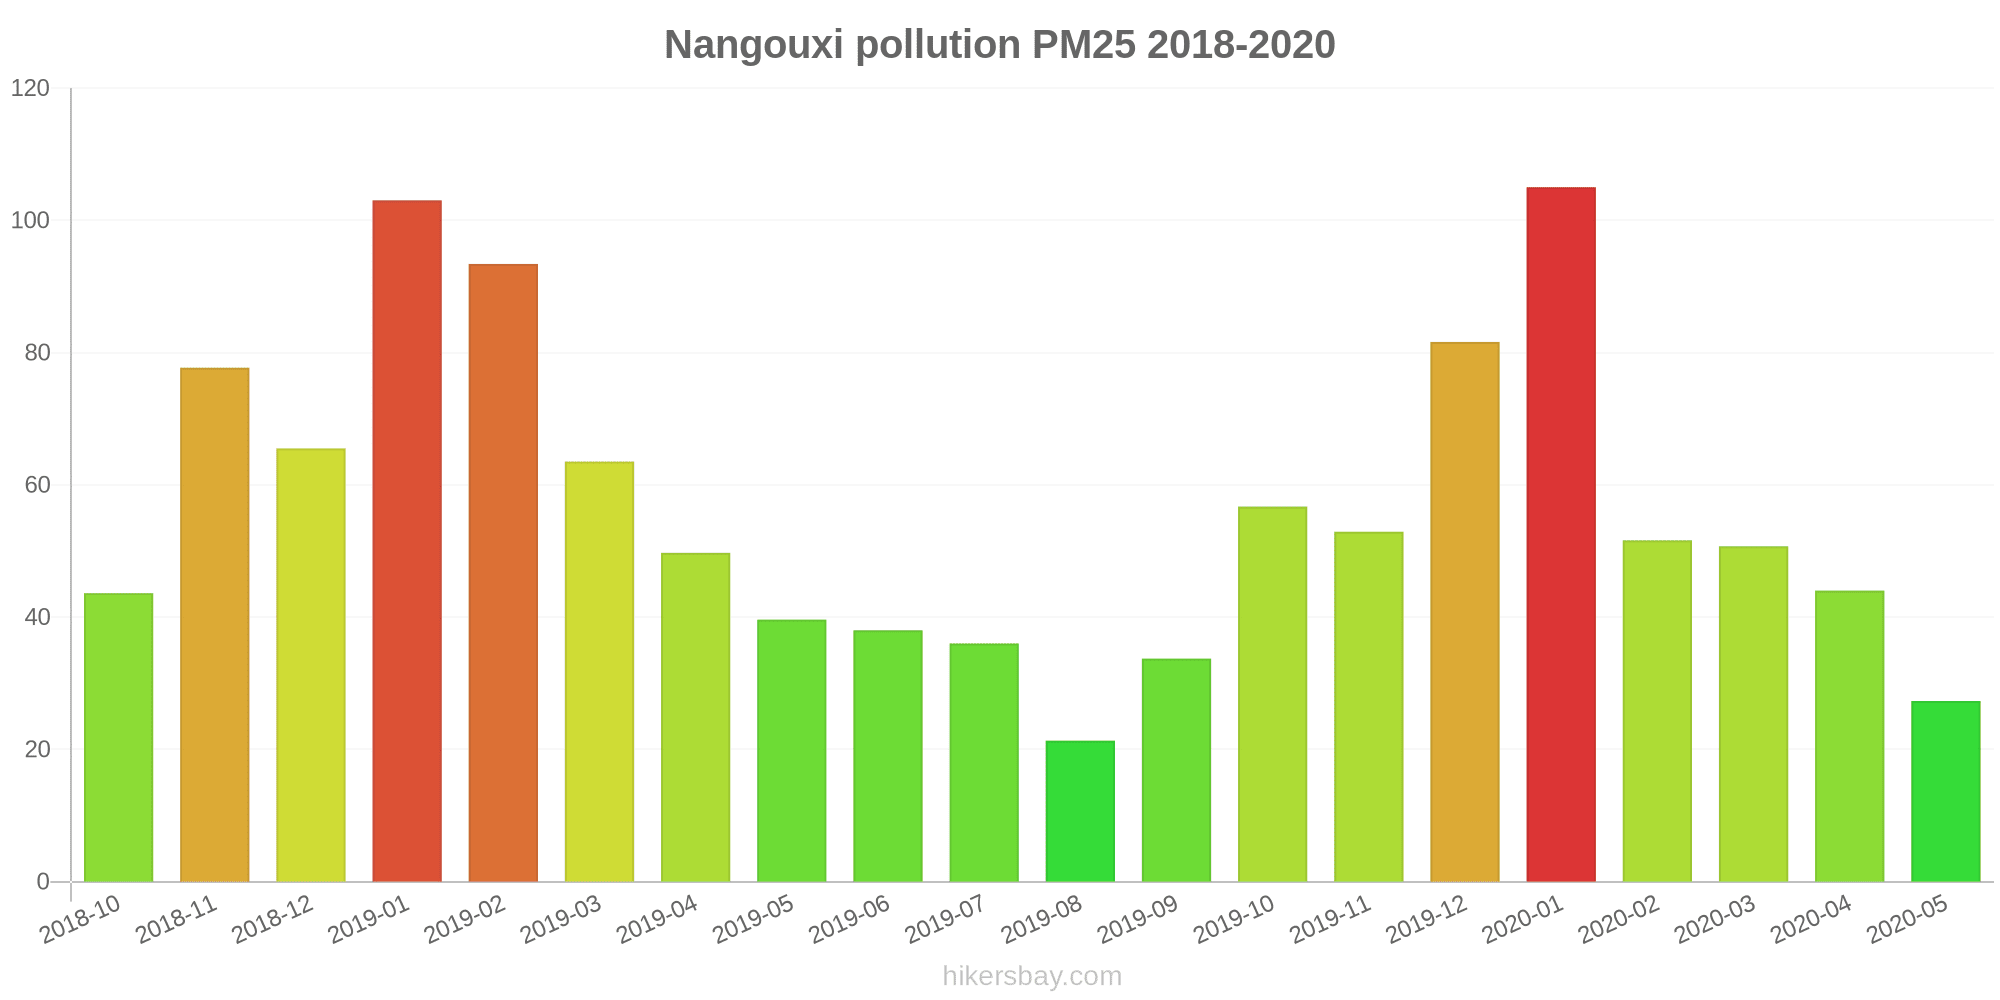
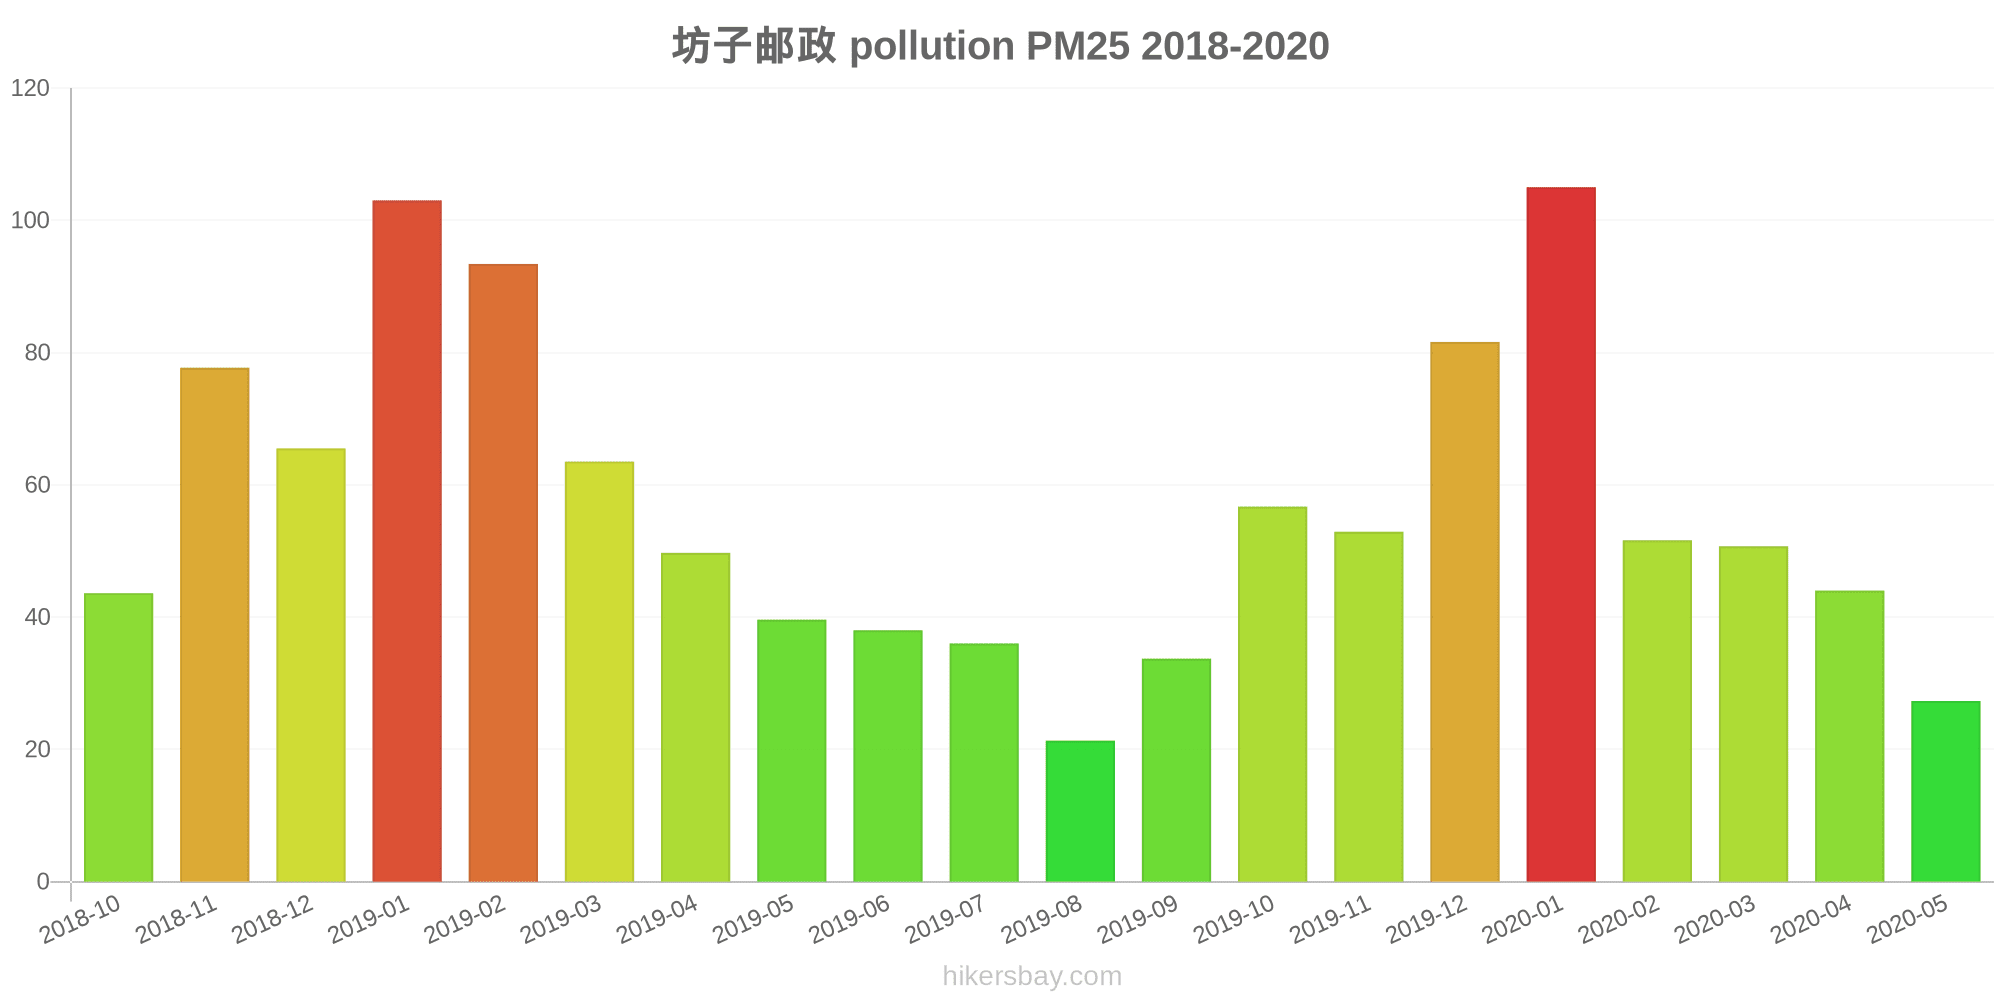
Die höchsten PM2,5-Werte wurden gemessen: 105 (Januar 2020).
Die niedrigste Feinstaubbelastung PM2,5 tritt im Monat auf: August (21).
Wie hoch ist die SO2-Belastung? (Schwefeldioxid (SO2))
18 (gut)
Wie hoch ist das NO2-Niveau? (Stickstoffdioxid (NO2))
3 (gut)
Wie hoch ist der CO-Gehalt? (Kohlenmonoxid (CO))
1 (gut)
Aktuelle Daten Freitag, 27. Mai 2022, 12:00
PM10 53 (Ungesund für sensible Gruppen)
O3 0 (gut)
PM2,5 7 (gut)
SO2 18 (gut)
NO2 3 (gut)
CO 1 (gut)
Daten zur Luftverschmutzung der letzten Tage in Nangouxi
index
2022-05-27
pm10
51
Unhealthy for Sensitive Groups
o3
0
Good
pm25
21
Moderate
so2
10
Good
no2
0
Good
co
1
Good
data source »
Luftverschmutzung in Nangouxi von Oktober 2018 bis Mai 2020

index
2020-05
2020-04
2020-03
2020-02
2020-01
2019-12
2019-11
2019-10
2019-09
2019-08
2019-07
2019-06
2019-05
2019-04
2019-03
2019-02
2019-01
2018-12
2018-11
2018-10
pm25
27 (Moderate)
44 (Unhealthy for Sensitive Groups)
51 (Unhealthy for Sensitive Groups)
52 (Unhealthy for Sensitive Groups)
105 (Very Unhealthy)
82 (Very Unhealthy)
53 (Unhealthy for Sensitive Groups)
57 (Unhealthy)
34 (Moderate)
21 (Moderate)
36 (Unhealthy for Sensitive Groups)
38 (Unhealthy for Sensitive Groups)
40 (Unhealthy for Sensitive Groups)
50 (Unhealthy for Sensitive Groups)
64 (Unhealthy)
93 (Very Unhealthy)
103 (Very Unhealthy)
66 (Unhealthy)
78 (Very Unhealthy)
44 (Unhealthy for Sensitive Groups)
co
247 (Good)
423 (Good)
492 (Good)
638 (Good)
1 (Good)
977 (Good)
661 (Good)
691 (Good)
536 (Good)
390 (Good)
512 (Good)
546 (Good)
420 (Good)
460 (Good)
634 (Good)
1 (Good)
1 (Good)
976 (Good)
943 (Good)
634 (Good)
no2
16 (Good)
33 (Good)
30 (Good)
19 (Good)
44 (Moderate)
45 (Moderate)
41 (Moderate)
44 (Moderate)
32 (Good)
24 (Good)
23 (Good)
21 (Good)
28 (Good)
32 (Good)
46 (Moderate)
45 (Moderate)
66 (Moderate)
51 (Moderate)
45 (Moderate)
43 (Moderate)
o3
127 (Unhealthy for Sensitive Groups)
130 (Unhealthy for Sensitive Groups)
109 (Moderate)
90 (Moderate)
69 (Good)
57 (Good)
83 (Moderate)
126 (Unhealthy for Sensitive Groups)
160 (Unhealthy)
123 (Unhealthy for Sensitive Groups)
181 (Very Unhealthy)
189 (Very Unhealthy)
173 (Unhealthy)
133 (Unhealthy for Sensitive Groups)
124 (Unhealthy for Sensitive Groups)
85 (Moderate)
63 (Good)
60 (Good)
88 (Moderate)
104 (Moderate)
pm10
62 (Unhealthy for Sensitive Groups)
94 (Unhealthy)
102 (Unhealthy)
70 (Unhealthy for Sensitive Groups)
138 (Very Unhealthy)
108 (Unhealthy)
115 (Very Unhealthy)
126 (Very Unhealthy)
82 (Unhealthy)
50 (Moderate)
70 (Unhealthy for Sensitive Groups)
81 (Unhealthy)
106 (Unhealthy)
104 (Unhealthy)
124 (Very Unhealthy)
140 (Very Unhealthy)
173 (Very bad Hazardous)
125 (Very Unhealthy)
151 (Very bad Hazardous)
101 (Unhealthy)
so2
6.9 (Good)
9.8 (Good)
9.1 (Good)
8.1 (Good)
16 (Good)
12 (Good)
9.4 (Good)
8.4 (Good)
7.5 (Good)
4.7 (Good)
4 (Good)
7.2 (Good)
9.7 (Good)
9 (Good)
14 (Good)
19 (Good)
28 (Good)
21 (Good)
12 (Good)
14 (Good)
data source »
坊子邮政
Freitag, 27. Mai 2022, 12:00
PM10 53 (Ungesund für sensible Gruppen)
Feinstaub (PM10) Schwebestaub
O3 0.02 (gut)
Ozon (O3)
PM2,5 6.6 (gut)
Feinstaub (PM2,5)
SO2 18 (gut)
Schwefeldioxid (SO2)
NO2 3 (gut)
Stickstoffdioxid (NO2)
CO 1.3 (gut)
Kohlenmonoxid (CO)
坊子邮政
index
2022-05-27
pm10
51
o3
0.02
pm25
21
so2
9.6
no2
0.38
co
0.64
坊子邮政
2018-10 2020-05
index
2020-05
2020-04
2020-03
2020-02
2020-01
2019-12
2019-11
2019-10
2019-09
2019-08
2019-07
2019-06
2019-05
2019-04
2019-03
2019-02
2019-01
2018-12
2018-11
2018-10
pm25
27
44
51
52
105
82
53
57
34
21
36
38
40
50
64
93
103
66
78
44
co
247
423
492
638
1
977
661
691
536
390
512
546
420
460
634
1
1
976
943
634
no2
16
33
30
19
44
45
41
44
32
24
23
21
28
32
46
45
66
51
45
43
o3
127
130
109
90
69
57
83
126
160
123
181
189
173
133
124
85
63
60
88
104
pm10
62
94
102
70
138
108
115
126
82
50
70
81
106
104
124
140
173
125
151
101
so2
6.9
9.8
9.1
8.1
16
12
9.4
8.4
7.5
4.7
4
7.2
9.7
9
14
19
28
21
12
14
* Pollution data source:
https://openaq.org
(ChinaAQIData)
The data is licensed under CC-By 4.0
PM10 53 (Ungesund für sensible Gruppen)
O3 0 (gut)
PM2,5 7 (gut)
SO2 18 (gut)
NO2 3 (gut)
CO 1 (gut)
Daten zur Luftverschmutzung der letzten Tage in Nangouxi
| index | 2022-05-27 |
|---|---|
| pm10 | 51 Unhealthy for Sensitive Groups |
| o3 | 0 Good |
| pm25 | 21 Moderate |
| so2 | 10 Good |
| no2 | 0 Good |
| co | 1 Good |
| index | 2020-05 | 2020-04 | 2020-03 | 2020-02 | 2020-01 | 2019-12 | 2019-11 | 2019-10 | 2019-09 | 2019-08 | 2019-07 | 2019-06 | 2019-05 | 2019-04 | 2019-03 | 2019-02 | 2019-01 | 2018-12 | 2018-11 | 2018-10 |
|---|---|---|---|---|---|---|---|---|---|---|---|---|---|---|---|---|---|---|---|---|
| pm25 | 27 (Moderate) | 44 (Unhealthy for Sensitive Groups) | 51 (Unhealthy for Sensitive Groups) | 52 (Unhealthy for Sensitive Groups) | 105 (Very Unhealthy) | 82 (Very Unhealthy) | 53 (Unhealthy for Sensitive Groups) | 57 (Unhealthy) | 34 (Moderate) | 21 (Moderate) | 36 (Unhealthy for Sensitive Groups) | 38 (Unhealthy for Sensitive Groups) | 40 (Unhealthy for Sensitive Groups) | 50 (Unhealthy for Sensitive Groups) | 64 (Unhealthy) | 93 (Very Unhealthy) | 103 (Very Unhealthy) | 66 (Unhealthy) | 78 (Very Unhealthy) | 44 (Unhealthy for Sensitive Groups) |
| co | 247 (Good) | 423 (Good) | 492 (Good) | 638 (Good) | 1 (Good) | 977 (Good) | 661 (Good) | 691 (Good) | 536 (Good) | 390 (Good) | 512 (Good) | 546 (Good) | 420 (Good) | 460 (Good) | 634 (Good) | 1 (Good) | 1 (Good) | 976 (Good) | 943 (Good) | 634 (Good) |
| no2 | 16 (Good) | 33 (Good) | 30 (Good) | 19 (Good) | 44 (Moderate) | 45 (Moderate) | 41 (Moderate) | 44 (Moderate) | 32 (Good) | 24 (Good) | 23 (Good) | 21 (Good) | 28 (Good) | 32 (Good) | 46 (Moderate) | 45 (Moderate) | 66 (Moderate) | 51 (Moderate) | 45 (Moderate) | 43 (Moderate) |
| o3 | 127 (Unhealthy for Sensitive Groups) | 130 (Unhealthy for Sensitive Groups) | 109 (Moderate) | 90 (Moderate) | 69 (Good) | 57 (Good) | 83 (Moderate) | 126 (Unhealthy for Sensitive Groups) | 160 (Unhealthy) | 123 (Unhealthy for Sensitive Groups) | 181 (Very Unhealthy) | 189 (Very Unhealthy) | 173 (Unhealthy) | 133 (Unhealthy for Sensitive Groups) | 124 (Unhealthy for Sensitive Groups) | 85 (Moderate) | 63 (Good) | 60 (Good) | 88 (Moderate) | 104 (Moderate) |
| pm10 | 62 (Unhealthy for Sensitive Groups) | 94 (Unhealthy) | 102 (Unhealthy) | 70 (Unhealthy for Sensitive Groups) | 138 (Very Unhealthy) | 108 (Unhealthy) | 115 (Very Unhealthy) | 126 (Very Unhealthy) | 82 (Unhealthy) | 50 (Moderate) | 70 (Unhealthy for Sensitive Groups) | 81 (Unhealthy) | 106 (Unhealthy) | 104 (Unhealthy) | 124 (Very Unhealthy) | 140 (Very Unhealthy) | 173 (Very bad Hazardous) | 125 (Very Unhealthy) | 151 (Very bad Hazardous) | 101 (Unhealthy) |
| so2 | 6.9 (Good) | 9.8 (Good) | 9.1 (Good) | 8.1 (Good) | 16 (Good) | 12 (Good) | 9.4 (Good) | 8.4 (Good) | 7.5 (Good) | 4.7 (Good) | 4 (Good) | 7.2 (Good) | 9.7 (Good) | 9 (Good) | 14 (Good) | 19 (Good) | 28 (Good) | 21 (Good) | 12 (Good) | 14 (Good) |
PM10 53 (Ungesund für sensible Gruppen)
Feinstaub (PM10) SchwebestaubO3 0.02 (gut)
Ozon (O3)PM2,5 6.6 (gut)
Feinstaub (PM2,5)SO2 18 (gut)
Schwefeldioxid (SO2)NO2 3 (gut)
Stickstoffdioxid (NO2)CO 1.3 (gut)
Kohlenmonoxid (CO)坊子邮政
| index | 2022-05-27 |
|---|---|
| pm10 | 51 |
| o3 | 0.02 |
| pm25 | 21 |
| so2 | 9.6 |
| no2 | 0.38 |
| co | 0.64 |
坊子邮政
| index | 2020-05 | 2020-04 | 2020-03 | 2020-02 | 2020-01 | 2019-12 | 2019-11 | 2019-10 | 2019-09 | 2019-08 | 2019-07 | 2019-06 | 2019-05 | 2019-04 | 2019-03 | 2019-02 | 2019-01 | 2018-12 | 2018-11 | 2018-10 |
|---|---|---|---|---|---|---|---|---|---|---|---|---|---|---|---|---|---|---|---|---|
| pm25 | 27 | 44 | 51 | 52 | 105 | 82 | 53 | 57 | 34 | 21 | 36 | 38 | 40 | 50 | 64 | 93 | 103 | 66 | 78 | 44 |
| co | 247 | 423 | 492 | 638 | 1 | 977 | 661 | 691 | 536 | 390 | 512 | 546 | 420 | 460 | 634 | 1 | 1 | 976 | 943 | 634 |
| no2 | 16 | 33 | 30 | 19 | 44 | 45 | 41 | 44 | 32 | 24 | 23 | 21 | 28 | 32 | 46 | 45 | 66 | 51 | 45 | 43 |
| o3 | 127 | 130 | 109 | 90 | 69 | 57 | 83 | 126 | 160 | 123 | 181 | 189 | 173 | 133 | 124 | 85 | 63 | 60 | 88 | 104 |
| pm10 | 62 | 94 | 102 | 70 | 138 | 108 | 115 | 126 | 82 | 50 | 70 | 81 | 106 | 104 | 124 | 140 | 173 | 125 | 151 | 101 |
| so2 | 6.9 | 9.8 | 9.1 | 8.1 | 16 | 12 | 9.4 | 8.4 | 7.5 | 4.7 | 4 | 7.2 | 9.7 | 9 | 14 | 19 | 28 | 21 | 12 | 14 |