Luftverschmutzung in Dongqicun: Echtzeit-Luft-Qualitätsindex und Smog-Alarm.
Für die Dongqicun. Heute ist Donnerstag, 4. Juni 2026. Für Dongqicun wurden folgende Luftverschmutzungswerte gemessen:- Feinstaub (PM10) Schwebestaub - 53 (Ungesund für sensible Gruppen)
- Ozon (O3) - 0 (gut)
- Feinstaub (PM2,5) - 7 (gut)
- Schwefeldioxid (SO2) - 18 (gut)
- Stickstoffdioxid (NO2) - 3 (gut)
- Kohlenmonoxid (CO) - 1 (gut)

Wie ist die Luftqualität Dongqicun heute? Ist die Luft in Dongqicun? verschmutzt. Gibt es Smog?
Wie hoch ist der PM10-Stand heute in Dongqicun? (Feinstaub (PM10) Schwebestaub)
Der aktuelle Feinstaubgehalt PM10 in Dongqicun is:
53 (Ungesund für sensible Gruppen)
Die höchsten PM10-Werte treten in der Regel im Monat auf: 159 (Januar 2019).
Der niedrigste Wert der Feinstaub-PM10-Belastung in Dongqicun ist in der Regel in: August (50).
Wie ist das O3-Niveau heute in Dongqicun? (Ozon (O3))
0 (gut)
Wie hoch ist der aktuelle PM2,5-Wert in Dongqicun? (Feinstaub (PM2,5))
Die heutige PM2.5-Stufe ist:
7 (gut)
Zum Vergleich: Der höchste PM2,5-Wert in Dongqicun in den letzten 7 Tagen war: 21 (Freitag, 27. Mai 2022) und der niedrigste: 21 (Freitag, 27. Mai 2022).
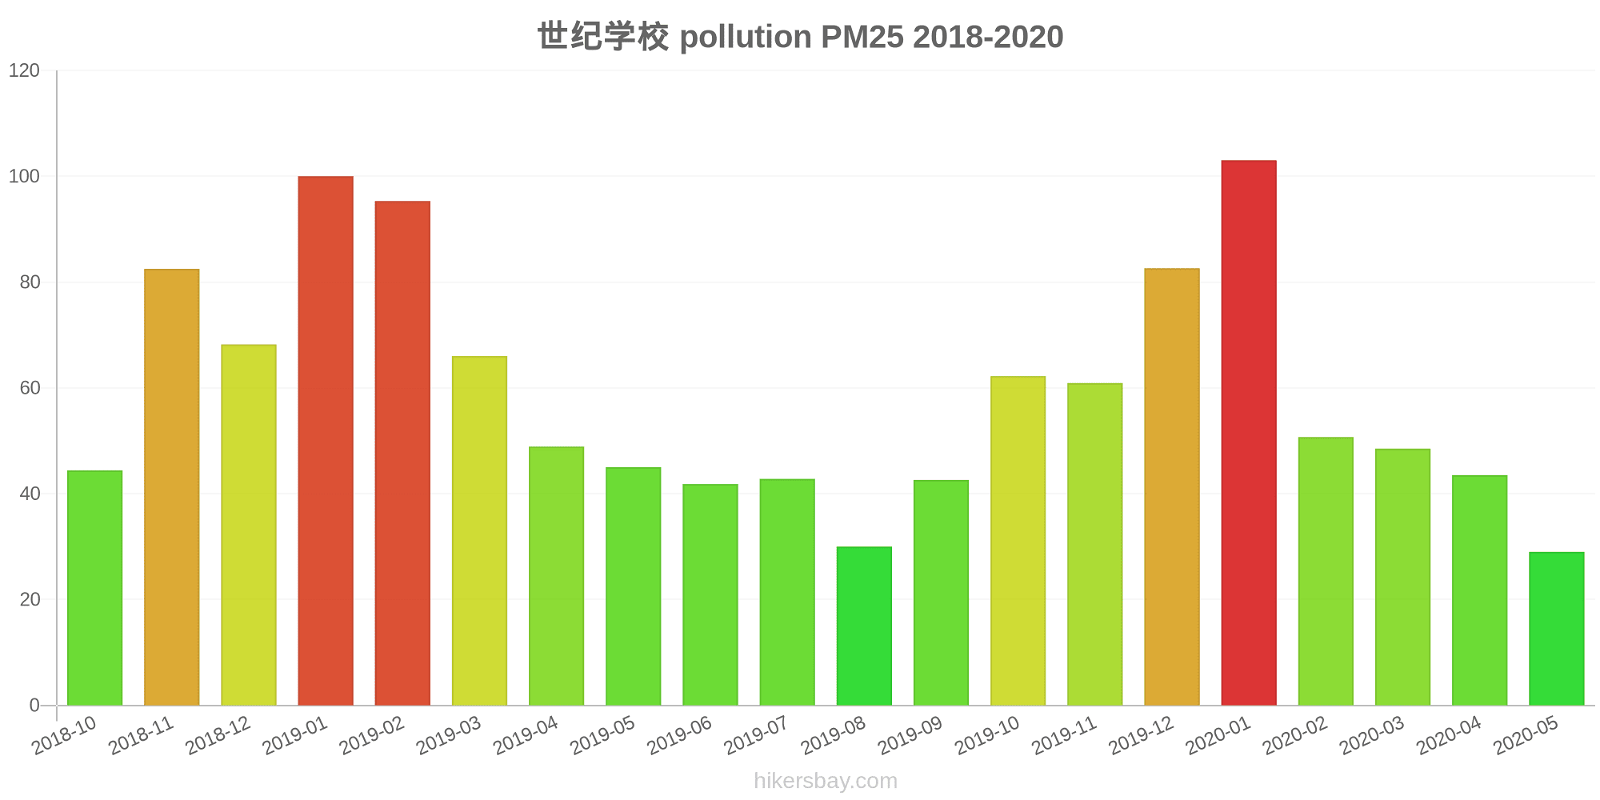
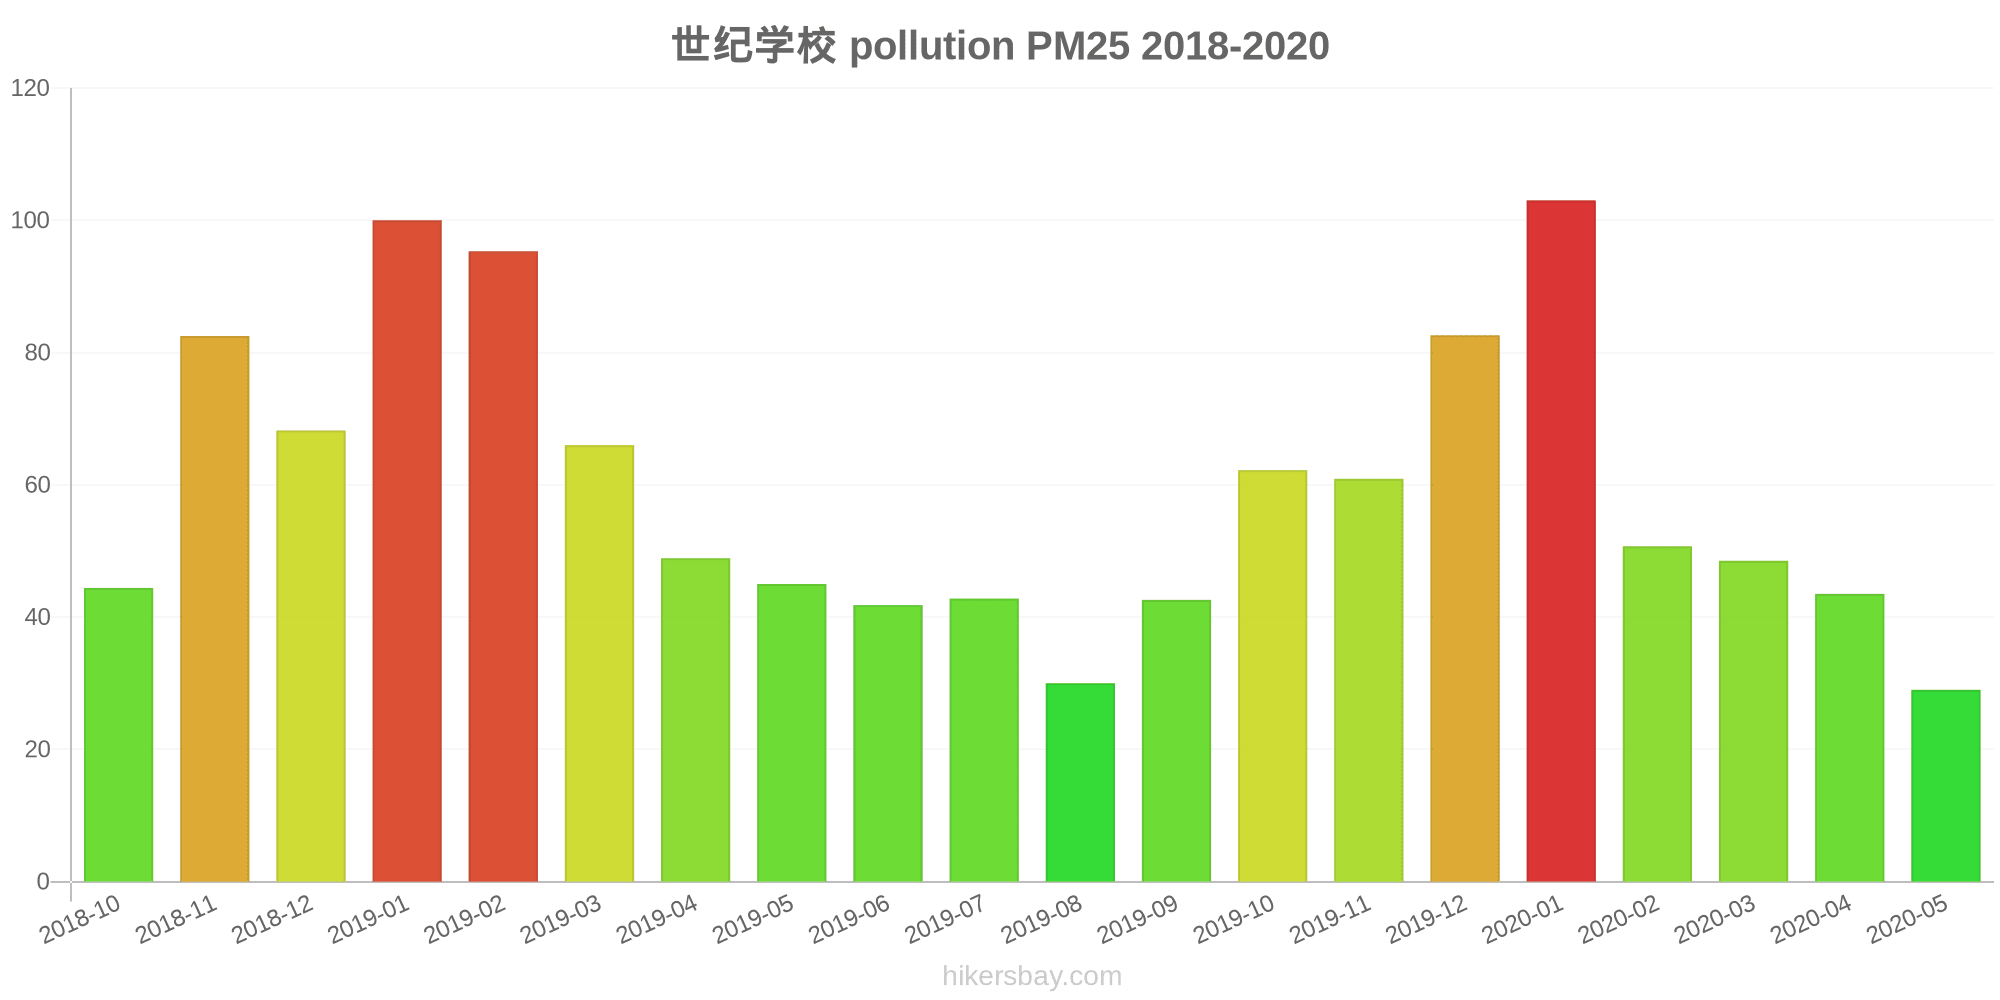
Die höchsten PM2,5-Werte wurden gemessen: 103 (Januar 2020).
Die niedrigste Feinstaubbelastung PM2,5 tritt im Monat auf: Mai (29).
Wie hoch ist die SO2-Belastung? (Schwefeldioxid (SO2))
18 (gut)
Wie hoch ist das NO2-Niveau? (Stickstoffdioxid (NO2))
3 (gut)
Wie hoch ist der CO-Gehalt? (Kohlenmonoxid (CO))
1 (gut)
Aktuelle Daten Freitag, 27. Mai 2022, 12:00
PM10 53 (Ungesund für sensible Gruppen)
O3 0 (gut)
PM2,5 7 (gut)
SO2 18 (gut)
NO2 3 (gut)
CO 1 (gut)
Daten zur Luftverschmutzung der letzten Tage in Dongqicun
index
2022-05-27
pm10
51
Unhealthy for Sensitive Groups
o3
0
Good
pm25
21
Moderate
so2
10
Good
no2
0
Good
co
1
Good
data source »
Luftverschmutzung in Dongqicun von Oktober 2018 bis Mai 2020

index
2020-05
2020-04
2020-03
2020-02
2020-01
2019-12
2019-11
2019-10
2019-09
2019-08
2019-07
2019-06
2019-05
2019-04
2019-03
2019-02
2019-01
2018-12
2018-11
2018-10
pm25
29 (Moderate)
44 (Unhealthy for Sensitive Groups)
49 (Unhealthy for Sensitive Groups)
51 (Unhealthy for Sensitive Groups)
103 (Very Unhealthy)
83 (Very Unhealthy)
61 (Unhealthy)
62 (Unhealthy)
43 (Unhealthy for Sensitive Groups)
30 (Moderate)
43 (Unhealthy for Sensitive Groups)
42 (Unhealthy for Sensitive Groups)
45 (Unhealthy for Sensitive Groups)
49 (Unhealthy for Sensitive Groups)
66 (Unhealthy)
95 (Very Unhealthy)
100 (Very Unhealthy)
68 (Unhealthy)
83 (Very Unhealthy)
44 (Unhealthy for Sensitive Groups)
co
413 (Good)
982 (Good)
884 (Good)
762 (Good)
1 (Good)
1 (Good)
858 (Good)
735 (Good)
681 (Good)
714 (Good)
800 (Good)
677 (Good)
956 (Good)
769 (Good)
1 (Good)
1 (Good)
1 (Good)
1 (Good)
1 (Good)
860 (Good)
no2
20 (Good)
35 (Good)
33 (Good)
22 (Good)
45 (Moderate)
46 (Moderate)
39 (Good)
43 (Moderate)
37 (Good)
29 (Good)
23 (Good)
23 (Good)
33 (Good)
36 (Good)
41 (Moderate)
40 (Moderate)
58 (Moderate)
50 (Moderate)
42 (Moderate)
38 (Good)
o3
117 (Moderate)
111 (Moderate)
98 (Moderate)
73 (Moderate)
57 (Good)
47 (Good)
70 (Good)
114 (Moderate)
156 (Unhealthy)
128 (Unhealthy for Sensitive Groups)
176 (Unhealthy)
178 (Unhealthy)
149 (Unhealthy for Sensitive Groups)
113 (Moderate)
110 (Moderate)
83 (Moderate)
56 (Good)
45 (Good)
71 (Moderate)
91 (Moderate)
pm10
65 (Unhealthy for Sensitive Groups)
93 (Unhealthy)
96 (Unhealthy)
70 (Unhealthy for Sensitive Groups)
141 (Very Unhealthy)
119 (Very Unhealthy)
116 (Very Unhealthy)
111 (Very Unhealthy)
79 (Unhealthy for Sensitive Groups)
50 (Unhealthy for Sensitive Groups)
63 (Unhealthy for Sensitive Groups)
75 (Unhealthy for Sensitive Groups)
112 (Very Unhealthy)
115 (Very Unhealthy)
124 (Very Unhealthy)
138 (Very Unhealthy)
159 (Very bad Hazardous)
125 (Very Unhealthy)
149 (Very Unhealthy)
86 (Unhealthy)
so2
10 (Good)
17 (Good)
16 (Good)
15 (Good)
29 (Good)
22 (Good)
14 (Good)
10 (Good)
9.8 (Good)
7.3 (Good)
6.2 (Good)
7.9 (Good)
13 (Good)
10 (Good)
18 (Good)
25 (Good)
32 (Good)
24 (Good)
13 (Good)
15 (Good)
data source »
世纪学校
Freitag, 27. Mai 2022, 12:00
PM10 53 (Ungesund für sensible Gruppen)
Feinstaub (PM10) Schwebestaub
O3 0.02 (gut)
Ozon (O3)
PM2,5 6.6 (gut)
Feinstaub (PM2,5)
SO2 18 (gut)
Schwefeldioxid (SO2)
NO2 3 (gut)
Stickstoffdioxid (NO2)
CO 1.3 (gut)
Kohlenmonoxid (CO)
世纪学校
index
2022-05-27
pm10
51
o3
0.02
pm25
21
so2
9.6
no2
0.38
co
0.64
世纪学校
2018-10 2020-05
index
2020-05
2020-04
2020-03
2020-02
2020-01
2019-12
2019-11
2019-10
2019-09
2019-08
2019-07
2019-06
2019-05
2019-04
2019-03
2019-02
2019-01
2018-12
2018-11
2018-10
pm25
29
44
49
51
103
83
61
62
43
30
43
42
45
49
66
95
100
68
83
44
co
413
982
884
762
1
1
858
735
681
714
800
677
956
769
1
1
1
1
1
860
no2
20
35
33
22
45
46
39
43
37
29
23
23
33
36
41
40
58
50
42
38
o3
117
111
98
73
57
47
70
114
156
128
176
178
149
113
110
83
56
45
71
91
pm10
65
93
96
70
141
119
116
111
79
50
63
75
112
115
124
138
159
125
149
86
so2
10
17
16
15
29
22
14
10
9.8
7.3
6.2
7.9
13
10
18
25
32
24
13
15
* Pollution data source:
https://openaq.org
(ChinaAQIData)
The data is licensed under CC-By 4.0
PM10 53 (Ungesund für sensible Gruppen)
O3 0 (gut)
PM2,5 7 (gut)
SO2 18 (gut)
NO2 3 (gut)
CO 1 (gut)
Daten zur Luftverschmutzung der letzten Tage in Dongqicun
| index | 2022-05-27 |
|---|---|
| pm10 | 51 Unhealthy for Sensitive Groups |
| o3 | 0 Good |
| pm25 | 21 Moderate |
| so2 | 10 Good |
| no2 | 0 Good |
| co | 1 Good |

| index | 2020-05 | 2020-04 | 2020-03 | 2020-02 | 2020-01 | 2019-12 | 2019-11 | 2019-10 | 2019-09 | 2019-08 | 2019-07 | 2019-06 | 2019-05 | 2019-04 | 2019-03 | 2019-02 | 2019-01 | 2018-12 | 2018-11 | 2018-10 |
|---|---|---|---|---|---|---|---|---|---|---|---|---|---|---|---|---|---|---|---|---|
| pm25 | 29 (Moderate) | 44 (Unhealthy for Sensitive Groups) | 49 (Unhealthy for Sensitive Groups) | 51 (Unhealthy for Sensitive Groups) | 103 (Very Unhealthy) | 83 (Very Unhealthy) | 61 (Unhealthy) | 62 (Unhealthy) | 43 (Unhealthy for Sensitive Groups) | 30 (Moderate) | 43 (Unhealthy for Sensitive Groups) | 42 (Unhealthy for Sensitive Groups) | 45 (Unhealthy for Sensitive Groups) | 49 (Unhealthy for Sensitive Groups) | 66 (Unhealthy) | 95 (Very Unhealthy) | 100 (Very Unhealthy) | 68 (Unhealthy) | 83 (Very Unhealthy) | 44 (Unhealthy for Sensitive Groups) |
| co | 413 (Good) | 982 (Good) | 884 (Good) | 762 (Good) | 1 (Good) | 1 (Good) | 858 (Good) | 735 (Good) | 681 (Good) | 714 (Good) | 800 (Good) | 677 (Good) | 956 (Good) | 769 (Good) | 1 (Good) | 1 (Good) | 1 (Good) | 1 (Good) | 1 (Good) | 860 (Good) |
| no2 | 20 (Good) | 35 (Good) | 33 (Good) | 22 (Good) | 45 (Moderate) | 46 (Moderate) | 39 (Good) | 43 (Moderate) | 37 (Good) | 29 (Good) | 23 (Good) | 23 (Good) | 33 (Good) | 36 (Good) | 41 (Moderate) | 40 (Moderate) | 58 (Moderate) | 50 (Moderate) | 42 (Moderate) | 38 (Good) |
| o3 | 117 (Moderate) | 111 (Moderate) | 98 (Moderate) | 73 (Moderate) | 57 (Good) | 47 (Good) | 70 (Good) | 114 (Moderate) | 156 (Unhealthy) | 128 (Unhealthy for Sensitive Groups) | 176 (Unhealthy) | 178 (Unhealthy) | 149 (Unhealthy for Sensitive Groups) | 113 (Moderate) | 110 (Moderate) | 83 (Moderate) | 56 (Good) | 45 (Good) | 71 (Moderate) | 91 (Moderate) |
| pm10 | 65 (Unhealthy for Sensitive Groups) | 93 (Unhealthy) | 96 (Unhealthy) | 70 (Unhealthy for Sensitive Groups) | 141 (Very Unhealthy) | 119 (Very Unhealthy) | 116 (Very Unhealthy) | 111 (Very Unhealthy) | 79 (Unhealthy for Sensitive Groups) | 50 (Unhealthy for Sensitive Groups) | 63 (Unhealthy for Sensitive Groups) | 75 (Unhealthy for Sensitive Groups) | 112 (Very Unhealthy) | 115 (Very Unhealthy) | 124 (Very Unhealthy) | 138 (Very Unhealthy) | 159 (Very bad Hazardous) | 125 (Very Unhealthy) | 149 (Very Unhealthy) | 86 (Unhealthy) |
| so2 | 10 (Good) | 17 (Good) | 16 (Good) | 15 (Good) | 29 (Good) | 22 (Good) | 14 (Good) | 10 (Good) | 9.8 (Good) | 7.3 (Good) | 6.2 (Good) | 7.9 (Good) | 13 (Good) | 10 (Good) | 18 (Good) | 25 (Good) | 32 (Good) | 24 (Good) | 13 (Good) | 15 (Good) |
PM10 53 (Ungesund für sensible Gruppen)
Feinstaub (PM10) SchwebestaubO3 0.02 (gut)
Ozon (O3)PM2,5 6.6 (gut)
Feinstaub (PM2,5)SO2 18 (gut)
Schwefeldioxid (SO2)NO2 3 (gut)
Stickstoffdioxid (NO2)CO 1.3 (gut)
Kohlenmonoxid (CO)世纪学校
| index | 2022-05-27 |
|---|---|
| pm10 | 51 |
| o3 | 0.02 |
| pm25 | 21 |
| so2 | 9.6 |
| no2 | 0.38 |
| co | 0.64 |
世纪学校
| index | 2020-05 | 2020-04 | 2020-03 | 2020-02 | 2020-01 | 2019-12 | 2019-11 | 2019-10 | 2019-09 | 2019-08 | 2019-07 | 2019-06 | 2019-05 | 2019-04 | 2019-03 | 2019-02 | 2019-01 | 2018-12 | 2018-11 | 2018-10 |
|---|---|---|---|---|---|---|---|---|---|---|---|---|---|---|---|---|---|---|---|---|
| pm25 | 29 | 44 | 49 | 51 | 103 | 83 | 61 | 62 | 43 | 30 | 43 | 42 | 45 | 49 | 66 | 95 | 100 | 68 | 83 | 44 |
| co | 413 | 982 | 884 | 762 | 1 | 1 | 858 | 735 | 681 | 714 | 800 | 677 | 956 | 769 | 1 | 1 | 1 | 1 | 1 | 860 |
| no2 | 20 | 35 | 33 | 22 | 45 | 46 | 39 | 43 | 37 | 29 | 23 | 23 | 33 | 36 | 41 | 40 | 58 | 50 | 42 | 38 |
| o3 | 117 | 111 | 98 | 73 | 57 | 47 | 70 | 114 | 156 | 128 | 176 | 178 | 149 | 113 | 110 | 83 | 56 | 45 | 71 | 91 |
| pm10 | 65 | 93 | 96 | 70 | 141 | 119 | 116 | 111 | 79 | 50 | 63 | 75 | 112 | 115 | 124 | 138 | 159 | 125 | 149 | 86 |
| so2 | 10 | 17 | 16 | 15 | 29 | 22 | 14 | 10 | 9.8 | 7.3 | 6.2 | 7.9 | 13 | 10 | 18 | 25 | 32 | 24 | 13 | 15 |