Luftverschmutzung in Beixiaoyuhe: Echtzeit-Luft-Qualitätsindex und Smog-Alarm.
Für die Beixiaoyuhe. Heute ist Donnerstag, 4. Juni 2026. Für Beixiaoyuhe wurden folgende Luftverschmutzungswerte gemessen:- Feinstaub (PM10) Schwebestaub - 53 (Ungesund für sensible Gruppen)
- Ozon (O3) - 0 (gut)
- Feinstaub (PM2,5) - 7 (gut)
- Schwefeldioxid (SO2) - 18 (gut)
- Stickstoffdioxid (NO2) - 3 (gut)
- Kohlenmonoxid (CO) - 1 (gut)

Wie ist die Luftqualität Beixiaoyuhe heute? Ist die Luft in Beixiaoyuhe? verschmutzt. Gibt es Smog?
Wie hoch ist der PM10-Stand heute in Beixiaoyuhe? (Feinstaub (PM10) Schwebestaub)
Der aktuelle Feinstaubgehalt PM10 in Beixiaoyuhe is:
53 (Ungesund für sensible Gruppen)
Die höchsten PM10-Werte treten in der Regel im Monat auf: 177 (Januar 2019).
Der niedrigste Wert der Feinstaub-PM10-Belastung in Beixiaoyuhe ist in der Regel in: August (56).
Wie ist das O3-Niveau heute in Beixiaoyuhe? (Ozon (O3))
0 (gut)
Wie hoch ist der aktuelle PM2,5-Wert in Beixiaoyuhe? (Feinstaub (PM2,5))
Die heutige PM2.5-Stufe ist:
7 (gut)
Zum Vergleich: Der höchste PM2,5-Wert in Beixiaoyuhe in den letzten 7 Tagen war: 21 (Freitag, 27. Mai 2022) und der niedrigste: 21 (Freitag, 27. Mai 2022).
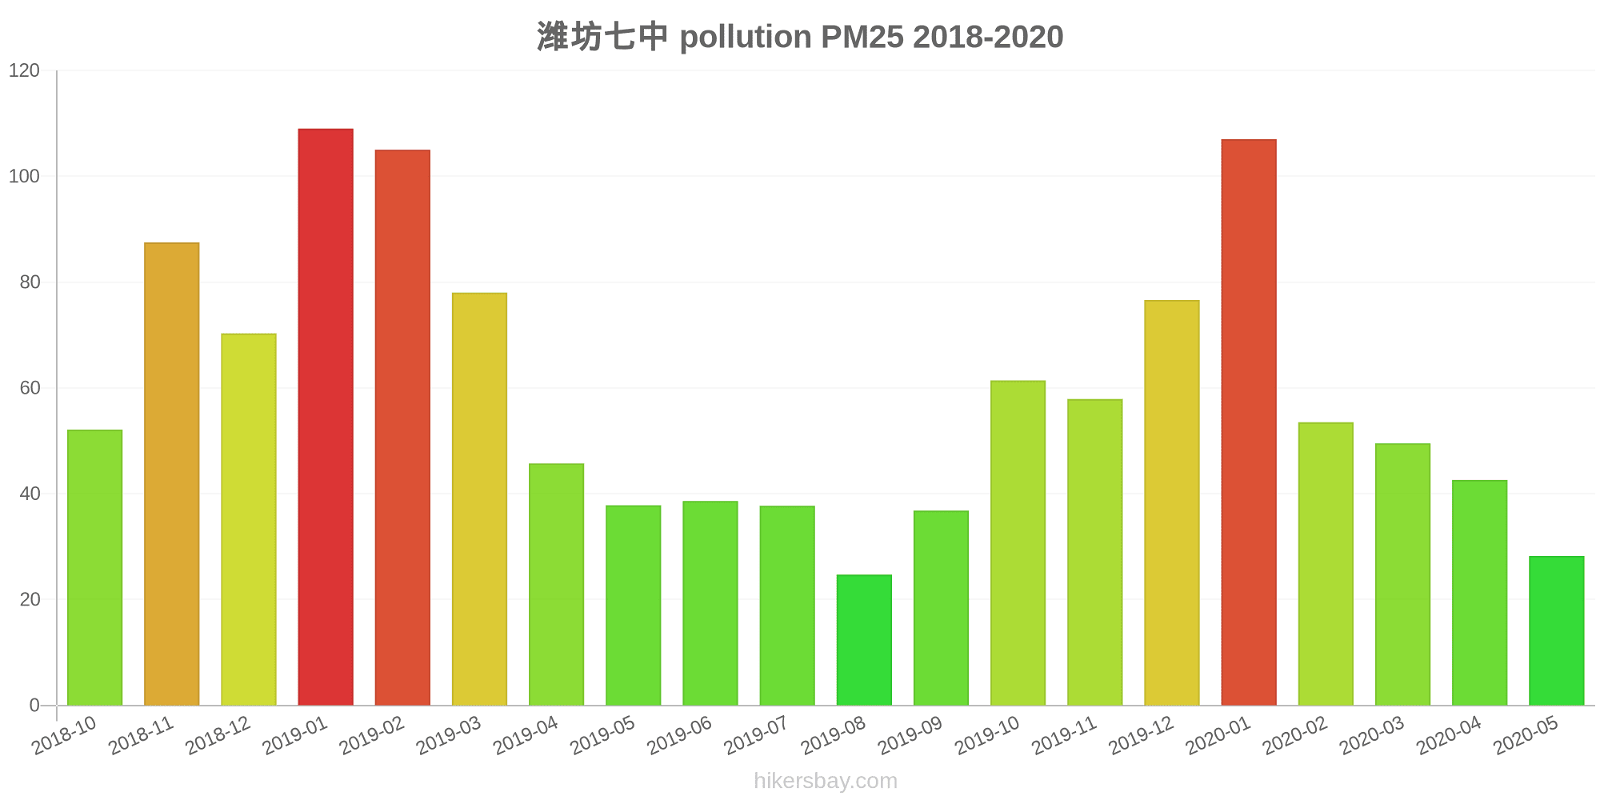
Die höchsten PM2,5-Werte wurden gemessen: 109 (Januar 2019).
Die niedrigste Feinstaubbelastung PM2,5 tritt im Monat auf: August (25).
Wie hoch ist die SO2-Belastung? (Schwefeldioxid (SO2))
18 (gut)
Wie hoch ist das NO2-Niveau? (Stickstoffdioxid (NO2))
3 (gut)
Wie hoch ist der CO-Gehalt? (Kohlenmonoxid (CO))
1 (gut)
Aktuelle Daten Freitag, 27. Mai 2022, 12:00
PM10 53 (Ungesund für sensible Gruppen)
O3 0 (gut)
PM2,5 7 (gut)
SO2 18 (gut)
NO2 3 (gut)
CO 1 (gut)
Daten zur Luftverschmutzung der letzten Tage in Beixiaoyuhe
index
2022-05-27
pm10
51
Unhealthy for Sensitive Groups
o3
0
Good
pm25
21
Moderate
so2
10
Good
no2
0
Good
co
1
Good
data source »
Luftverschmutzung in Beixiaoyuhe von Oktober 2018 bis Mai 2020

index
2020-05
2020-04
2020-03
2020-02
2020-01
2019-12
2019-11
2019-10
2019-09
2019-08
2019-07
2019-06
2019-05
2019-04
2019-03
2019-02
2019-01
2018-12
2018-11
2018-10
pm25
28 (Moderate)
43 (Unhealthy for Sensitive Groups)
50 (Unhealthy for Sensitive Groups)
54 (Unhealthy for Sensitive Groups)
107 (Very Unhealthy)
77 (Very Unhealthy)
58 (Unhealthy)
61 (Unhealthy)
37 (Unhealthy for Sensitive Groups)
25 (Moderate)
38 (Unhealthy for Sensitive Groups)
39 (Unhealthy for Sensitive Groups)
38 (Unhealthy for Sensitive Groups)
46 (Unhealthy for Sensitive Groups)
78 (Very Unhealthy)
105 (Very Unhealthy)
109 (Very Unhealthy)
70 (Unhealthy)
88 (Very Unhealthy)
52 (Unhealthy for Sensitive Groups)
co
418 (Good)
516 (Good)
610 (Good)
681 (Good)
1 (Good)
1 (Good)
810 (Good)
780 (Good)
590 (Good)
468 (Good)
518 (Good)
587 (Good)
467 (Good)
516 (Good)
843 (Good)
1 (Good)
1 (Good)
1 (Good)
981 (Good)
678 (Good)
no2
17 (Good)
37 (Good)
32 (Good)
20 (Good)
48 (Moderate)
48 (Moderate)
46 (Moderate)
46 (Moderate)
38 (Good)
31 (Good)
25 (Good)
23 (Good)
29 (Good)
33 (Good)
45 (Moderate)
40 (Good)
57 (Moderate)
51 (Moderate)
50 (Moderate)
46 (Moderate)
o3
132 (Unhealthy for Sensitive Groups)
131 (Unhealthy for Sensitive Groups)
108 (Moderate)
88 (Moderate)
68 (Good)
55 (Good)
79 (Moderate)
119 (Moderate)
151 (Unhealthy)
126 (Unhealthy for Sensitive Groups)
183 (Very Unhealthy)
192 (Very Unhealthy)
172 (Unhealthy)
132 (Unhealthy for Sensitive Groups)
106 (Moderate)
72 (Moderate)
51 (Good)
49 (Good)
73 (Moderate)
95 (Moderate)
pm10
68 (Unhealthy for Sensitive Groups)
94 (Unhealthy)
99 (Unhealthy)
73 (Unhealthy for Sensitive Groups)
151 (Very bad Hazardous)
114 (Very Unhealthy)
121 (Very Unhealthy)
122 (Very Unhealthy)
82 (Unhealthy)
56 (Unhealthy for Sensitive Groups)
73 (Unhealthy for Sensitive Groups)
87 (Unhealthy)
110 (Very Unhealthy)
105 (Unhealthy)
135 (Very Unhealthy)
145 (Very Unhealthy)
177 (Very bad Hazardous)
132 (Very Unhealthy)
170 (Very bad Hazardous)
118 (Very Unhealthy)
so2
6.3 (Good)
10 (Good)
9.7 (Good)
9.6 (Good)
19 (Good)
16 (Good)
12 (Good)
8.4 (Good)
7.3 (Good)
7.3 (Good)
6.2 (Good)
8.7 (Good)
9.8 (Good)
9 (Good)
16 (Good)
27 (Good)
35 (Good)
28 (Good)
20 (Good)
16 (Good)
data source »
潍坊七中
Freitag, 27. Mai 2022, 12:00
PM10 53 (Ungesund für sensible Gruppen)
Feinstaub (PM10) Schwebestaub
O3 0.02 (gut)
Ozon (O3)
PM2,5 6.6 (gut)
Feinstaub (PM2,5)
SO2 18 (gut)
Schwefeldioxid (SO2)
NO2 3 (gut)
Stickstoffdioxid (NO2)
CO 1.3 (gut)
Kohlenmonoxid (CO)
潍坊七中
index
2022-05-27
pm10
51
o3
0.02
pm25
21
so2
9.6
no2
0.38
co
0.64
潍坊七中
2018-10 2020-05
index
2020-05
2020-04
2020-03
2020-02
2020-01
2019-12
2019-11
2019-10
2019-09
2019-08
2019-07
2019-06
2019-05
2019-04
2019-03
2019-02
2019-01
2018-12
2018-11
2018-10
pm25
28
43
50
54
107
77
58
61
37
25
38
39
38
46
78
105
109
70
88
52
co
418
516
610
681
1
1
810
780
590
468
518
587
467
516
843
1
1
1
981
678
no2
17
37
32
20
48
48
46
46
38
31
25
23
29
33
45
40
57
51
50
46
o3
132
131
108
88
68
55
79
119
151
126
183
192
172
132
106
72
51
49
73
95
pm10
68
94
99
73
151
114
121
122
82
56
73
87
110
105
135
145
177
132
170
118
so2
6.3
10
9.7
9.6
19
16
12
8.4
7.3
7.3
6.2
8.7
9.8
9
16
27
35
28
20
16
* Pollution data source:
https://openaq.org
(ChinaAQIData)
The data is licensed under CC-By 4.0
PM10 53 (Ungesund für sensible Gruppen)
O3 0 (gut)
PM2,5 7 (gut)
SO2 18 (gut)
NO2 3 (gut)
CO 1 (gut)
Daten zur Luftverschmutzung der letzten Tage in Beixiaoyuhe
| index | 2022-05-27 |
|---|---|
| pm10 | 51 Unhealthy for Sensitive Groups |
| o3 | 0 Good |
| pm25 | 21 Moderate |
| so2 | 10 Good |
| no2 | 0 Good |
| co | 1 Good |

| index | 2020-05 | 2020-04 | 2020-03 | 2020-02 | 2020-01 | 2019-12 | 2019-11 | 2019-10 | 2019-09 | 2019-08 | 2019-07 | 2019-06 | 2019-05 | 2019-04 | 2019-03 | 2019-02 | 2019-01 | 2018-12 | 2018-11 | 2018-10 |
|---|---|---|---|---|---|---|---|---|---|---|---|---|---|---|---|---|---|---|---|---|
| pm25 | 28 (Moderate) | 43 (Unhealthy for Sensitive Groups) | 50 (Unhealthy for Sensitive Groups) | 54 (Unhealthy for Sensitive Groups) | 107 (Very Unhealthy) | 77 (Very Unhealthy) | 58 (Unhealthy) | 61 (Unhealthy) | 37 (Unhealthy for Sensitive Groups) | 25 (Moderate) | 38 (Unhealthy for Sensitive Groups) | 39 (Unhealthy for Sensitive Groups) | 38 (Unhealthy for Sensitive Groups) | 46 (Unhealthy for Sensitive Groups) | 78 (Very Unhealthy) | 105 (Very Unhealthy) | 109 (Very Unhealthy) | 70 (Unhealthy) | 88 (Very Unhealthy) | 52 (Unhealthy for Sensitive Groups) |
| co | 418 (Good) | 516 (Good) | 610 (Good) | 681 (Good) | 1 (Good) | 1 (Good) | 810 (Good) | 780 (Good) | 590 (Good) | 468 (Good) | 518 (Good) | 587 (Good) | 467 (Good) | 516 (Good) | 843 (Good) | 1 (Good) | 1 (Good) | 1 (Good) | 981 (Good) | 678 (Good) |
| no2 | 17 (Good) | 37 (Good) | 32 (Good) | 20 (Good) | 48 (Moderate) | 48 (Moderate) | 46 (Moderate) | 46 (Moderate) | 38 (Good) | 31 (Good) | 25 (Good) | 23 (Good) | 29 (Good) | 33 (Good) | 45 (Moderate) | 40 (Good) | 57 (Moderate) | 51 (Moderate) | 50 (Moderate) | 46 (Moderate) |
| o3 | 132 (Unhealthy for Sensitive Groups) | 131 (Unhealthy for Sensitive Groups) | 108 (Moderate) | 88 (Moderate) | 68 (Good) | 55 (Good) | 79 (Moderate) | 119 (Moderate) | 151 (Unhealthy) | 126 (Unhealthy for Sensitive Groups) | 183 (Very Unhealthy) | 192 (Very Unhealthy) | 172 (Unhealthy) | 132 (Unhealthy for Sensitive Groups) | 106 (Moderate) | 72 (Moderate) | 51 (Good) | 49 (Good) | 73 (Moderate) | 95 (Moderate) |
| pm10 | 68 (Unhealthy for Sensitive Groups) | 94 (Unhealthy) | 99 (Unhealthy) | 73 (Unhealthy for Sensitive Groups) | 151 (Very bad Hazardous) | 114 (Very Unhealthy) | 121 (Very Unhealthy) | 122 (Very Unhealthy) | 82 (Unhealthy) | 56 (Unhealthy for Sensitive Groups) | 73 (Unhealthy for Sensitive Groups) | 87 (Unhealthy) | 110 (Very Unhealthy) | 105 (Unhealthy) | 135 (Very Unhealthy) | 145 (Very Unhealthy) | 177 (Very bad Hazardous) | 132 (Very Unhealthy) | 170 (Very bad Hazardous) | 118 (Very Unhealthy) |
| so2 | 6.3 (Good) | 10 (Good) | 9.7 (Good) | 9.6 (Good) | 19 (Good) | 16 (Good) | 12 (Good) | 8.4 (Good) | 7.3 (Good) | 7.3 (Good) | 6.2 (Good) | 8.7 (Good) | 9.8 (Good) | 9 (Good) | 16 (Good) | 27 (Good) | 35 (Good) | 28 (Good) | 20 (Good) | 16 (Good) |
PM10 53 (Ungesund für sensible Gruppen)
Feinstaub (PM10) SchwebestaubO3 0.02 (gut)
Ozon (O3)PM2,5 6.6 (gut)
Feinstaub (PM2,5)SO2 18 (gut)
Schwefeldioxid (SO2)NO2 3 (gut)
Stickstoffdioxid (NO2)CO 1.3 (gut)
Kohlenmonoxid (CO)潍坊七中
| index | 2022-05-27 |
|---|---|
| pm10 | 51 |
| o3 | 0.02 |
| pm25 | 21 |
| so2 | 9.6 |
| no2 | 0.38 |
| co | 0.64 |
潍坊七中

| index | 2020-05 | 2020-04 | 2020-03 | 2020-02 | 2020-01 | 2019-12 | 2019-11 | 2019-10 | 2019-09 | 2019-08 | 2019-07 | 2019-06 | 2019-05 | 2019-04 | 2019-03 | 2019-02 | 2019-01 | 2018-12 | 2018-11 | 2018-10 |
|---|---|---|---|---|---|---|---|---|---|---|---|---|---|---|---|---|---|---|---|---|
| pm25 | 28 | 43 | 50 | 54 | 107 | 77 | 58 | 61 | 37 | 25 | 38 | 39 | 38 | 46 | 78 | 105 | 109 | 70 | 88 | 52 |
| co | 418 | 516 | 610 | 681 | 1 | 1 | 810 | 780 | 590 | 468 | 518 | 587 | 467 | 516 | 843 | 1 | 1 | 1 | 981 | 678 |
| no2 | 17 | 37 | 32 | 20 | 48 | 48 | 46 | 46 | 38 | 31 | 25 | 23 | 29 | 33 | 45 | 40 | 57 | 51 | 50 | 46 |
| o3 | 132 | 131 | 108 | 88 | 68 | 55 | 79 | 119 | 151 | 126 | 183 | 192 | 172 | 132 | 106 | 72 | 51 | 49 | 73 | 95 |
| pm10 | 68 | 94 | 99 | 73 | 151 | 114 | 121 | 122 | 82 | 56 | 73 | 87 | 110 | 105 | 135 | 145 | 177 | 132 | 170 | 118 |
| so2 | 6.3 | 10 | 9.7 | 9.6 | 19 | 16 | 12 | 8.4 | 7.3 | 7.3 | 6.2 | 8.7 | 9.8 | 9 | 16 | 27 | 35 | 28 | 20 | 16 |